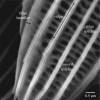
Phenotypic variation in Heliconius erato crosses shows that iridescent structural colour is sex-linked and controlled by multiple genes
- PMID: 30603067
- PMCID: PMC6304015
- DOI: 10.1098/rsfs.2018.0047
Phenotypic variation in Heliconius erato crosses shows that iridescent structural colour is sex-linked and controlled by multiple genes
Abstract
Bright, highly reflective iridescent colours can be seen across nature and are produced by the scattering of light from nanostructures. Heliconius butterflies have been widely studied for their diversity and mimicry of wing colour patterns. Despite iridescence evolving multiple times in this genus, little is known about the genetic basis of the colour and the development of the structures which produce it. Heliconius erato can be found across Central and South America, but only races found in western Ecuador and Colombia have developed blue iridescent colour. Here, we use crosses between iridescent and non-iridescent races of H. erato to study phenotypic variation in the resulting F2 generation. Using measurements of blue colour from photographs, we find that iridescent structural colour is a quantitative trait controlled by multiple genes, with strong evidence for loci on the Z sex chromosome. Iridescence is not linked to the Mendelian colour pattern locus that also segregates in these crosses (controlled by the gene cortex). Small-angle X-ray scattering data show that spacing between longitudinal ridges on the scales, which affects the intensity of the blue reflectance, also varies quantitatively in F2 crosses.
Keywords: Heliconius; butterflies; evolution; iridescence; quantitative genetics; structural colour.
Conflict of interest statement
We declare we have no competing interests.
Figures


Similar articles
-
The genetic basis of structural colour variation in mimetic Heliconius butterflies.Philos Trans R Soc Lond B Biol Sci. 2022 Jul 18;377(1855):20200505. doi: 10.1098/rstb.2020.0505. Epub 2022 May 30. Philos Trans R Soc Lond B Biol Sci. 2022. PMID: 35634924 Free PMC article.
-
Wing scale ultrastructure underlying convergent and divergent iridescent colours in mimetic Heliconius butterflies.J R Soc Interface. 2018 Apr;15(141):20170948. doi: 10.1098/rsif.2017.0948. J R Soc Interface. 2018. PMID: 29669892 Free PMC article.
-
Cortex cis-regulatory switches establish scale colour identity and pattern diversity in Heliconius.Elife. 2021 Jul 19;10:e68549. doi: 10.7554/eLife.68549. Elife. 2021. PMID: 34280087 Free PMC article.
-
The functional basis of wing patterning in Heliconius butterflies: the molecules behind mimicry.Genetics. 2015 May;200(1):1-19. doi: 10.1534/genetics.114.172387. Genetics. 2015. PMID: 25953905 Free PMC article. Review.
-
Iridescence: a functional perspective.J R Soc Interface. 2009 Apr 6;6 Suppl 2(Suppl 2):S115-32. doi: 10.1098/rsif.2008.0395.focus. J R Soc Interface. 2009. PMID: 19336344 Free PMC article. Review.
Cited by
-
The genetic basis of structural colour variation in mimetic Heliconius butterflies.Philos Trans R Soc Lond B Biol Sci. 2022 Jul 18;377(1855):20200505. doi: 10.1098/rstb.2020.0505. Epub 2022 May 30. Philos Trans R Soc Lond B Biol Sci. 2022. PMID: 35634924 Free PMC article.
-
Structural color in the bacterial domain: The ecogenomics of a 2-dimensional optical phenotype.Proc Natl Acad Sci U S A. 2024 Jul 16;121(29):e2309757121. doi: 10.1073/pnas.2309757121. Epub 2024 Jul 11. Proc Natl Acad Sci U S A. 2024. PMID: 38990940 Free PMC article.
-
Heliconius butterflies: a window into the evolution and development of diversity.Curr Opin Genet Dev. 2021 Aug;69:72-81. doi: 10.1016/j.gde.2021.01.010. Epub 2021 Mar 11. Curr Opin Genet Dev. 2021. PMID: 33714874 Free PMC article. Review.
-
Structural color in Junonia butterflies evolves by tuning scale lamina thickness.Elife. 2020 Apr 7;9:e52187. doi: 10.7554/eLife.52187. Elife. 2020. PMID: 32254023 Free PMC article.
-
In vivo visualization of butterfly scale cell morphogenesis in Vanessa cardui.Proc Natl Acad Sci U S A. 2021 Dec 7;118(49):e2112009118. doi: 10.1073/pnas.2112009118. Proc Natl Acad Sci U S A. 2021. PMID: 34845021 Free PMC article.
References
-
- Bálint Z, Kertész K, Piszter G, Vértesy Z, Biró LP. 2012. The well-tuned blues: the role of structural colours as optical signals in the species recognition of a local butterfly fauna (Lepidoptera: Lycaenidae: Polyommatinae). J. R. Soc. Interface 9, 1745–1756. (10.1098/rsif.2011.0854) - DOI - PMC - PubMed
-
- Hadley NF, Savill A, Schultz TD. 1992. Coloration and its thermal consequences in the New Zealand tiger beetle Neocicindela perhispida. J. Therm. Biol. 17, 55–61. (10.1016/0306-4565(92)90020-G) - DOI
-
- Vukusic P, Sambles JR, Lawrence CR, Wootton RJ. 1999. Quantified interference and diffraction in single Morpho butterfly scales. Proc. R. Soc. B 266, 1403–1411. (10.1098/rspb.1999.0794) - DOI
Associated data
LinkOut - more resources
Full Text Sources
Miscellaneous

