Review
. 2018 Apr 25;8(2):203-213.
doi: 10.1007/s13534-018-0067-2. eCollection 2018 May.

Photoacoustic microscopy: principles and biomedical applications

Affiliations
Review

Photoacoustic microscopy: principles and biomedical applications

Wei Liu et al. Biomed Eng Lett. .

Abstract

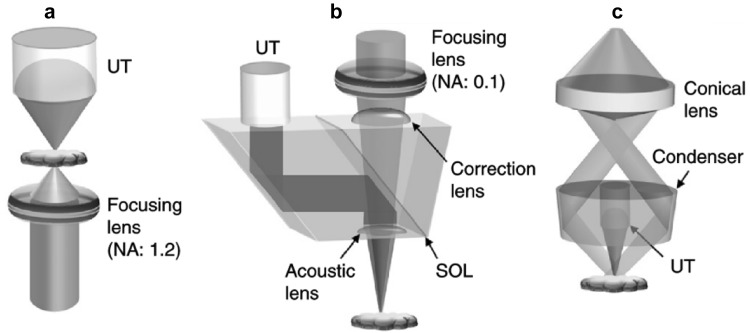
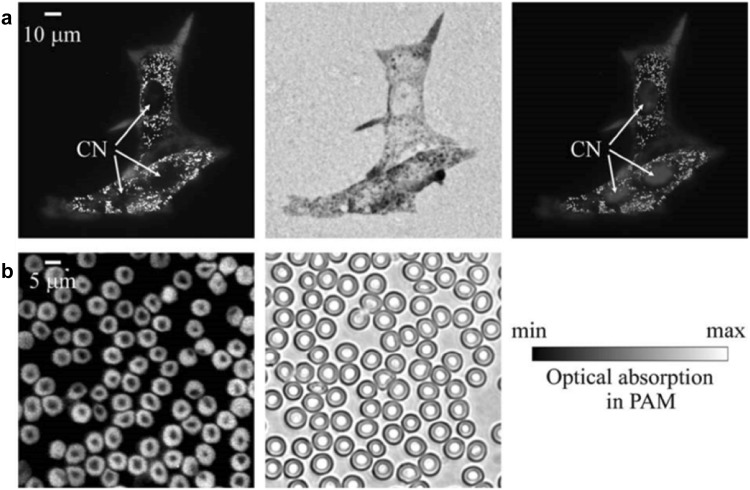
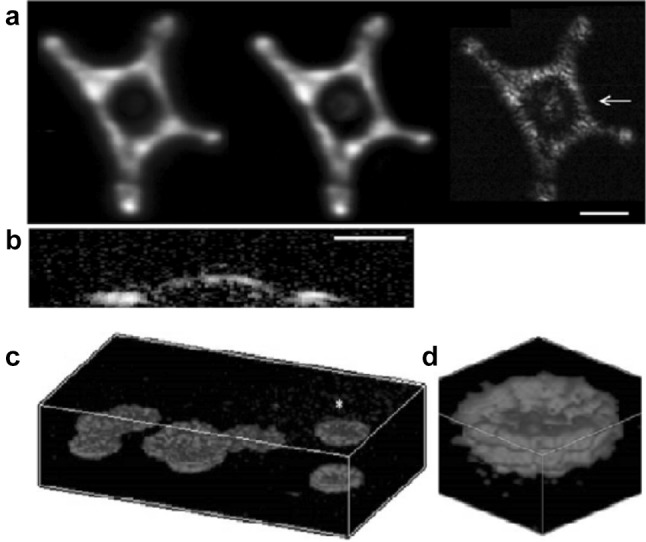
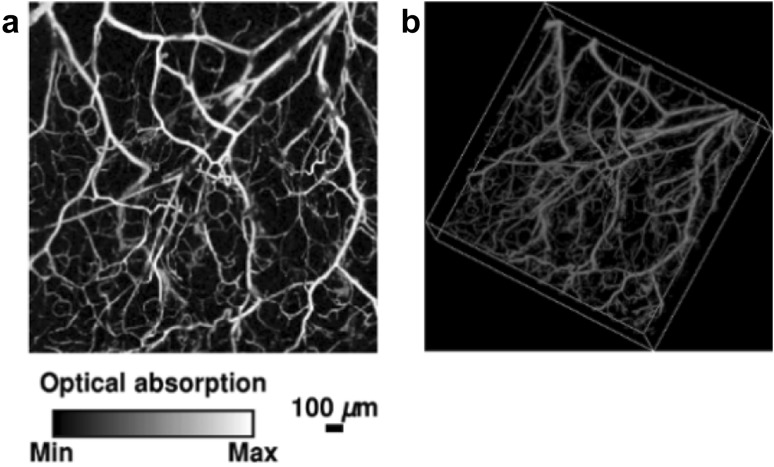
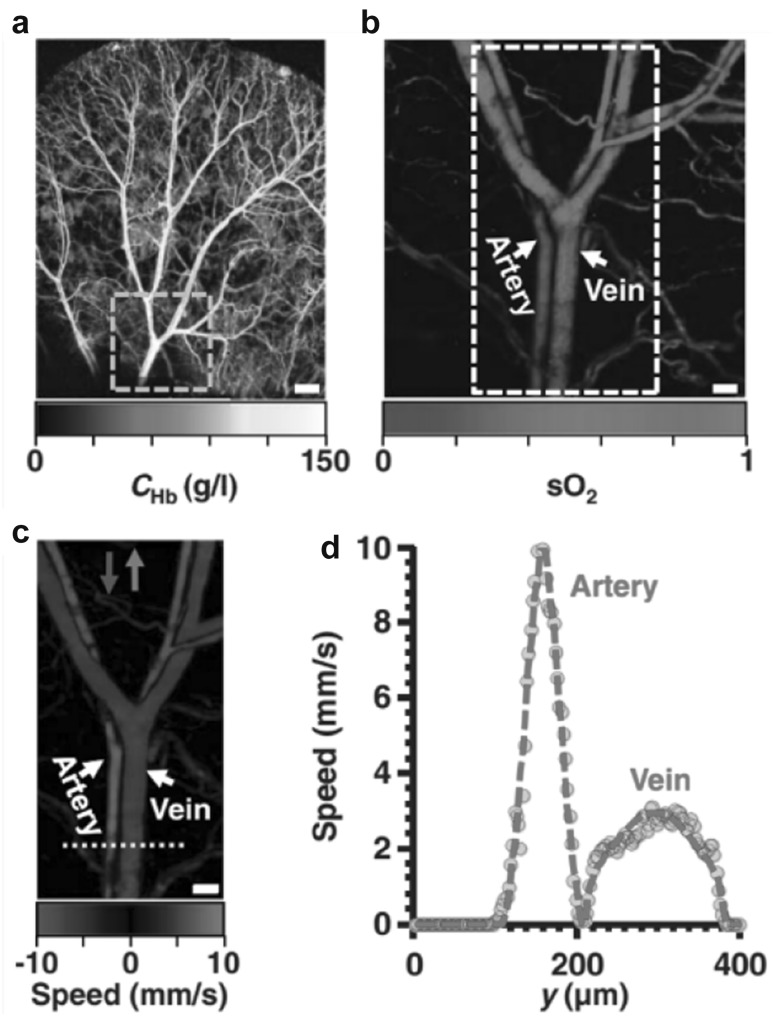
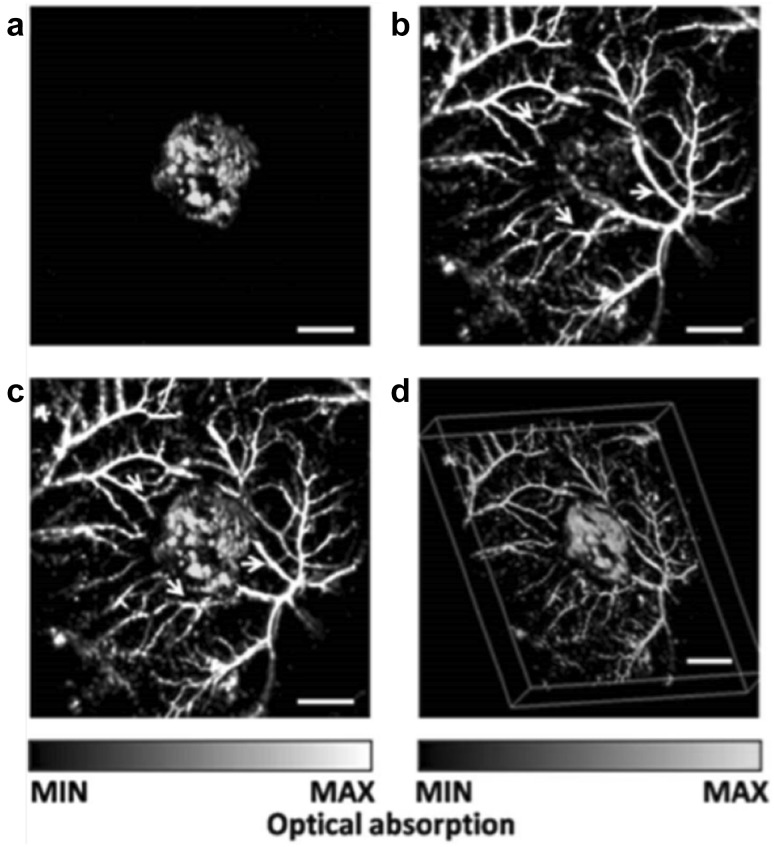
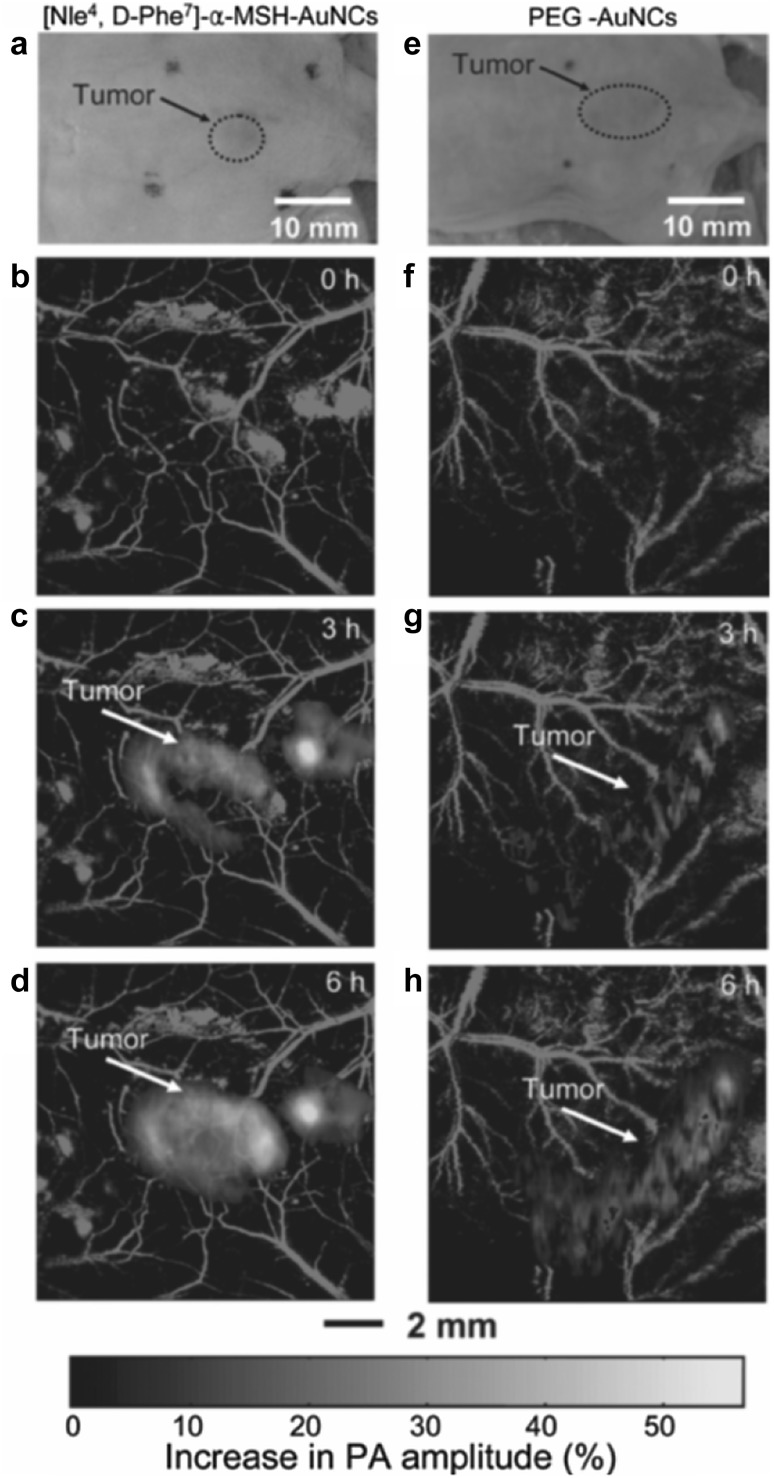
Photoacoustic microscopy (PAM) has become an increasingly popular technology for biomedical applications, providing anatomical, functional, and molecular information. In this concise review, we first introduce the basic principles and typical system designs of PAM, including optical-resolution PAM and acoustic-resolution PAM. The major imaging characteristics of PAM, i.e. spatial resolutions, penetration depth, and scanning approach are discussed in detail. Then, we introduce the major biomedical applications of PAM, including anatomical imaging across scales from cellular level to organismal level, label-free functional imaging using endogenous biomolecules, and molecular imaging using exogenous contrast agents. Lastly, we discuss the technical and engineering challenges of PAM in the translation to potential clinical impacts.

Keywords: Endogenous biomolecules; Exogenous contrast agents; Functional imaging; Molecular imaging; Photoacoustic microscopy; Structural imaging.


Conflict of interest statement

The authors declare that they have no conflict of interests.This article does not contain any studies with human participants or animals performed by any of the authors.

Figures

Fig. 1
Fig. 1
The schematics of typical PAM systems. a Transmission-mode OR-PAM. UT, ultrasonic transducer. b Reflection-mode OR-PAM. SOL, silicone oil layer. c Reflection-mode AR-PAM. Figures reproduced with permission from [16]
Fig. 2
Fig. 2
Ex vivo images of melanoma cells and RBCs obtained by OR-PAM with an optical NA of 1.23. a Melanoma cells on a glass slide. From left to right: PAM image, OM (0.5 NA) image, and a composite of the PAM image and the fluorescence OM image. The blue regions show the fluorescent stained nucleus. CN: cell nucleus. b PAM and OM (1.0 NA) images of RBCs. Figures adapted with permission from [14]. (Color figure online)
Fig. 3
Fig. 3
Images of melanoma cells obtained by high-frequency OR-PAM and red blood cells obtained by multiphoton OR-PAM. a Top-view MAP images obtained by the 200-, 375- and 1200-MHz ultrasonic transducers. Scale bar, 30 µm. b A cross-sectional image around the cell nucleus as indicated by the arrow in (a). Scale bar, 15 µm. c Volumetric images of several RBCs on a glass slide within the volume of 50 × 50 × 20 µm3. d Close-up image of a single RBC marked with a yellow asterisk in (c). Figures reproduced with permissions from [34, 37]. (Color figure online)
Fig. 4
Fig. 4
A typical in vivo OR-PAM image of the microvasculature in a mouse ear. a Top-view MAP image. b Volumetric image. Figures adopted with permission from [47]
Fig. 5
Fig. 5
A typical in vivo AR-PAM image of the microvasculature in a human palm. a Photograph of a human hand. Solid rectangle indicates the imaged area. b Top-view MAP image after removing the skin surface and the stratum corneum. c B-scan image along the dashed line in (b). d Top-view MAP images from different layers. Figures reproduced with permission from [54]
Fig. 6
Fig. 6
3D ma-OR-PAM image of an unstained agarose-embedded mouse brain. a Volumetric image of a mouse brain with a sectioning thickness of 200 µm. bk Ten representative coronal views as positioned by the dashed lines in (a). Figures adopted with permission from [56]
Fig. 7
Fig. 7
Optical absorption spectra of major endogenous biomolecules in tissues. Figure adopted with permission from [16]
Fig. 8
Fig. 8
In vivo OR-PAM of the mouse brain responses to the electrical stimulations of the hindlimbs. a Fractional PA amplitude response to left hindlimb stimulation (LHS) and right hindlimb stimulation (RHS). LH, left hemisphere; RH, right hemisphere. b Depth-resolved response. c sO2 changes in response to the stimulations. d The changes of cerebral blood flow (CBF), oxygen extraction fraction (OEF) and cerebral metabolic rate of oxygen (CMRO2) in the core responding region. Figure adopted with permission from [27]
Fig. 9
Fig. 9
In vivo OR-PAM images of the oxygen saturation of hemoglobin and blood flow speed measured on a mouse ear. a The total concentration of hemoglobin acquired at 584 nm. b The measured sO2 in the area indicated by the dashed box in (a). c The measured flow speed in the area indicated by the dashed box in (b). d The profile of the flow speed along the dashed line indicated in (c). Figures reproduced with permission from [13]
Fig. 10
Fig. 10
In vivo AR-PAM images showing the lacZ-expressing tumor and the surrounding microvascular networks. a MAP image of the lacZ-expressing tumor acquired at 635 nm. b MAP image of the surrounding microvasculature acquired at 584 nm. c Fused MAP image of the two wavelengths. d Fused 3D image of the two wavelengths. Figures adopted with permission from [77]
Fig. 11
Fig. 11
In vivo AR-PAM images of the melanomas targeted by [Nle4, D-Phe7]-α-MSH-AuNCs and PEG-AuNCs, respectively. a Photographs of the nude mice bearing melanoma. bd MAP images of the melanomas and surrounding microvasculature after injection of [Nle4, D-Phe7]-α-MSH-AuNCs. fh MAP images of the melanomas and surrounding microvasculature after injection of PEG-AuNCs. Figures adopted with permission from [72]

Similar articles

Cited by

References

    1. Mcqueen DH. Acoustical theory of the photoacoustic effect in gaseous and liquid-media. J Phys D Appl Phys. 1979;12:1673–1678. doi: 10.1088/0022-3727/12/10/008. - DOI
    1. Yang JM, Favazza C, Chen RM, Yao JJ, Cai X, Maslov K, Zhou QF, Shung KK, Wang LHV. Simultaneous functional photoacoustic and ultrasonic endoscopy of internal organs in vivo. Nat Med. 2012;18:1297–1302. doi: 10.1038/nm.2823. - DOI - PMC - PubMed
    1. Wang LHV, Yao JJ. A practical guide to photoacoustic tomography in the life sciences. Nat Methods. 2016;13:627–638. doi: 10.1038/nmeth.3925. - DOI - PMC - PubMed
    1. Wang LV. Multiscale photoacoustic microscopy and computed tomography. Nat Photonics. 2009;3:503–509. doi: 10.1038/nphoton.2009.157. - DOI - PMC - PubMed
    1. Xu MH, Wang LHV. Photoacoustic imaging in biomedicine. Rev Sci Instrum. 2006;77:041101. doi: 10.1063/1.2195024. - DOI

LinkOut - more resources