

The effect of mechanical or electrical stimulation on apnea length in mice
- PMID: 30603217
- PMCID: PMC6208540
- DOI: 10.1007/s13534-018-0076-1
The effect of mechanical or electrical stimulation on apnea length in mice
Abstract
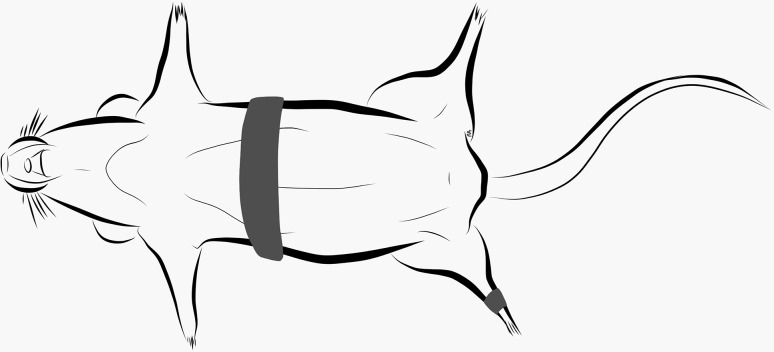
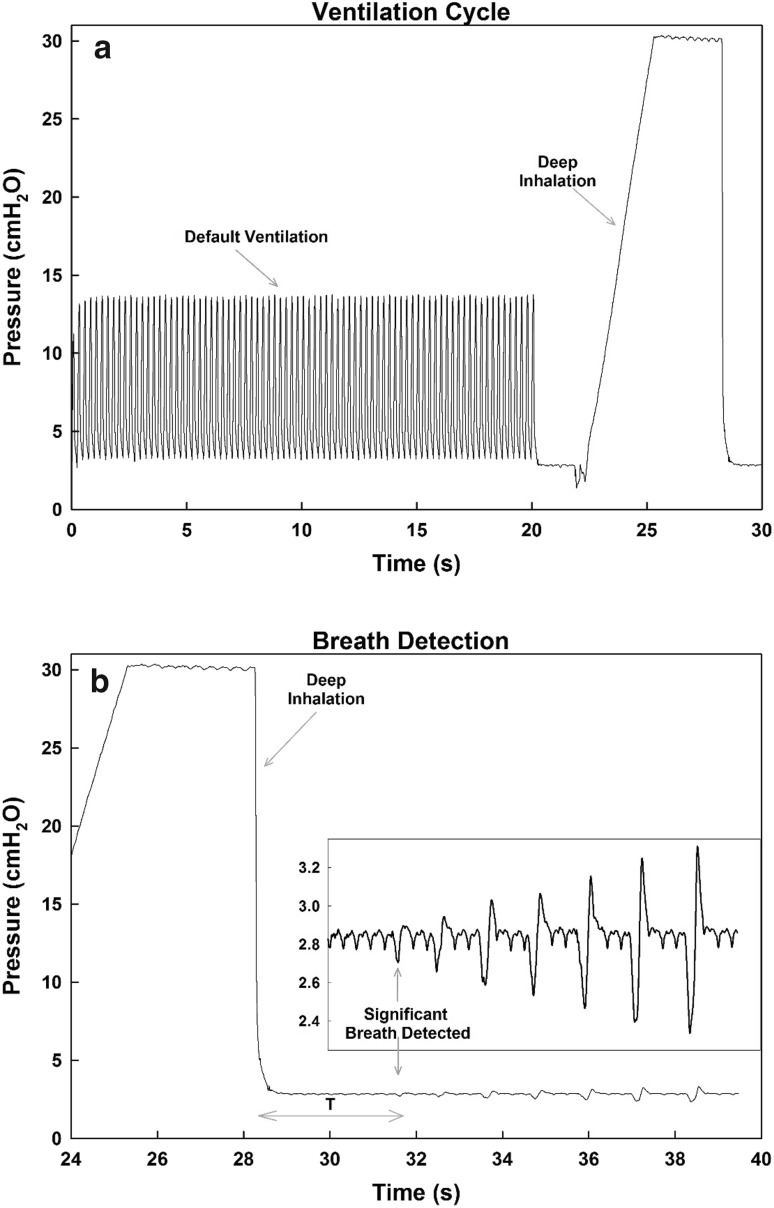
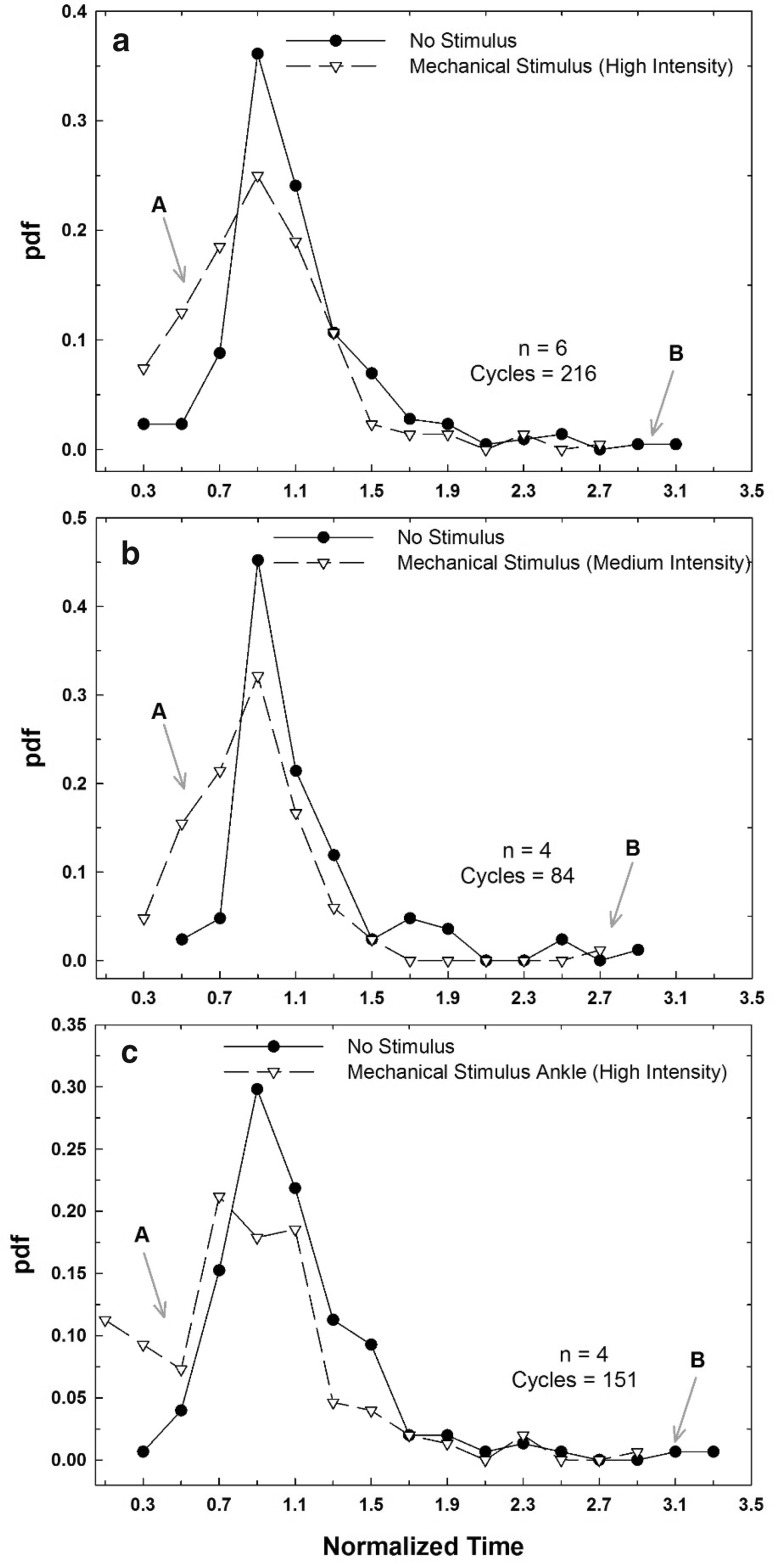
Premature birth is a leading cause of infant mortality which is often attributed to irregular breathing and apnea of prematurity. A common treatment for apnea is caffeine to stimulate the brain's respiratory center. However, caffeine's long term effect on infant development is not fully comprehended. We hypothesized that noninvasive localized body stimulation regularizes breathing pattern. We investigated the impact of electrical or mechanical stimulation on breathing in mice. After the mice were ventilated for 28 s to induce apnea, mice were taken off the ventilator while receiving mechanical, electrical, or no stimulation in a randomized order. Both stimuli targeted the diaphragm area through a custom-built belt with vibrating motors or adhesive electrodes. After each apnea cycle, the time to take the first breath (T) was recorded. The electrical stimulation given at 4.5, 8.3, 16.7 V (pulse rate = 3 Hz, pulse width = 120 μs) showed no reduction in T. Electrical stimulation at pulse rates of 10 or 20 Hz (16.7 V, pulse width 260 μs) showed a detrimental effect increasing T by ~ 7% compared to control values (p = 0.005, p = 0.038 respectively). High and medium intensity mechanical stimulations significantly reduced T by 11.74 (p < 10-13) and by 17.08% (p < 10-8), respectively. Further reducing the amplitude of vibrations did not affect T. When the probe was attached to the ankles, only the high intensity vibrations resulted in a decrease in T (p < 10-13). Mechanical vibrations, applied at various intensities and locations, could be used to treat irregular breathing and apnea in infants.
Keywords: Apnea of prematurity; Breathing regulation; Electrical stimulation; Mechanical vibrations; Noninvasive.
Conflict of interest statement
All authors declare that they have no conflict of interest.All applicable international, national, and/or institutional guidelines for the care and use of animals were followed. This article does not contain any studies with human participants performed by any of the authors.
Figures
Similar articles
-
Stabilizing breathing pattern using local mechanical vibrations: comparison of deterministic and stochastic stimulations in rodent models of apnea of prematurity.Biomed Eng Lett. 2021 Sep 1;11(4):383-392. doi: 10.1007/s13534-021-00203-x. eCollection 2021 Nov. Biomed Eng Lett. 2021. PMID: 34490067 Free PMC article.
-
The effect of caffeine citrate on neural breathing pattern in preterm infants.Early Hum Dev. 2015 Oct;91(10):565-8. doi: 10.1016/j.earlhumdev.2015.06.007. Epub 2015 Jul 25. Early Hum Dev. 2015. PMID: 26217936
-
The effect of vibrotactile stimulation on hypoxia-induced irregular breathing and apnea in preterm rabbits.Pediatr Res. 2024 Jul;96(2):325-331. doi: 10.1038/s41390-024-03061-2. Epub 2024 Feb 14. Pediatr Res. 2024. PMID: 38356025
-
Current options in the management of apnea of prematurity.Clin Pediatr (Phila). 2000 Jun;39(6):327-36. doi: 10.1177/000992280003900602. Clin Pediatr (Phila). 2000. PMID: 10879934 Review.
-
The Role of Caffeine in Noninvasive Respiratory Support.Clin Perinatol. 2016 Dec;43(4):773-782. doi: 10.1016/j.clp.2016.07.011. Epub 2016 Sep 28. Clin Perinatol. 2016. PMID: 27837758 Free PMC article. Review.
Cited by
-
Apnea of prematurity: when is the right time to stimulate?Pediatr Res. 2024 Jul;96(2):285-286. doi: 10.1038/s41390-024-03173-9. Epub 2024 Apr 4. Pediatr Res. 2024. PMID: 38575693 No abstract available.
-
Caregivers' response to cardiorespiratory events in preterm infants in the NICU - A quantitative overview.Acta Paediatr. 2025 Jan;114(1):92-99. doi: 10.1111/apa.17407. Epub 2024 Aug 31. Acta Paediatr. 2025. PMID: 39215764 Free PMC article.
-
Stabilizing breathing pattern using local mechanical vibrations: comparison of deterministic and stochastic stimulations in rodent models of apnea of prematurity.Biomed Eng Lett. 2021 Sep 1;11(4):383-392. doi: 10.1007/s13534-021-00203-x. eCollection 2021 Nov. Biomed Eng Lett. 2021. PMID: 34490067 Free PMC article.
References
-
- Frey U, Silverman M, Barabási AL, Suki B. Irregularities and power law distributions in the breathing pattern in preterm and term infants. J Appl Physiol (Bethesda, MD) 1985;1998(85):789–797. - PubMed
-
- Eichenwald EC. Newborn C on FA. Apnea of prematurity. Pediatrics. 2015
LinkOut - more resources
Full Text Sources