. 2015 Aug 23;7(2):173-180.
doi: 10.1007/s13340-015-0234-y. eCollection 2016 Jun.

Red wine enhances glucose-dependent insulinotropic peptide (GIP) and insulin responses in type 2 diabetes during an oral glucose tolerance test

Affiliations

Red wine enhances glucose-dependent insulinotropic peptide (GIP) and insulin responses in type 2 diabetes during an oral glucose tolerance test

Kirk A Abraham et al. Diabetol Int. .

Abstract

Background: Ingestion of ethanol before a glucose challenge enhances the insulin response by an unknown mechanism. In addition, epidemiological studies consistently indicate that moderate alcohol consumption reduces the risk of developing type 2 diabetes (T2D). The purposes of this study were to evaluate the potential involvement of glucose-dependent insulinotropic peptide (GIP) and glucagon-like peptide 1 (GLP-1) in alcohol-induced augmentation of the insulin response and to determine if red wine acutely improves glucose tolerance during an oral glucose tolerance test (OGTT).

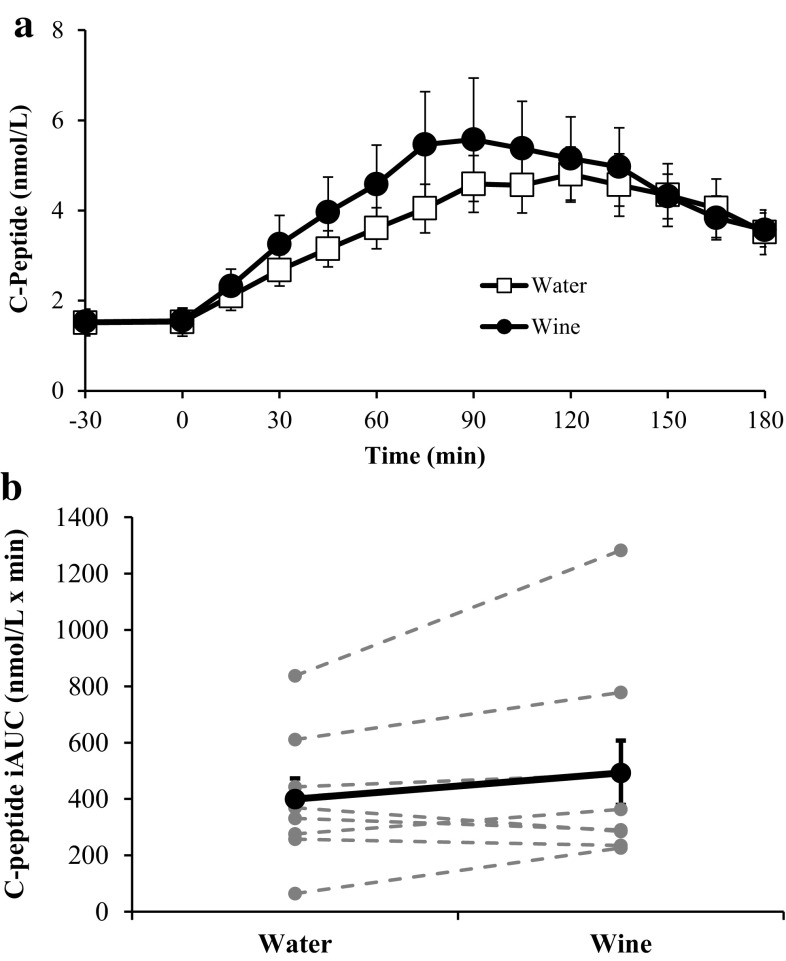
Methods: Nine subjects (eight T2D and one pre-diabetes) completed two OGTT 30 min after consumption of 263 ml water or red wine (28 g ethanol). Blood samples were obtained for 3 h and analyzed for glucose, insulin, C-peptide, GIP, and GLP-1.

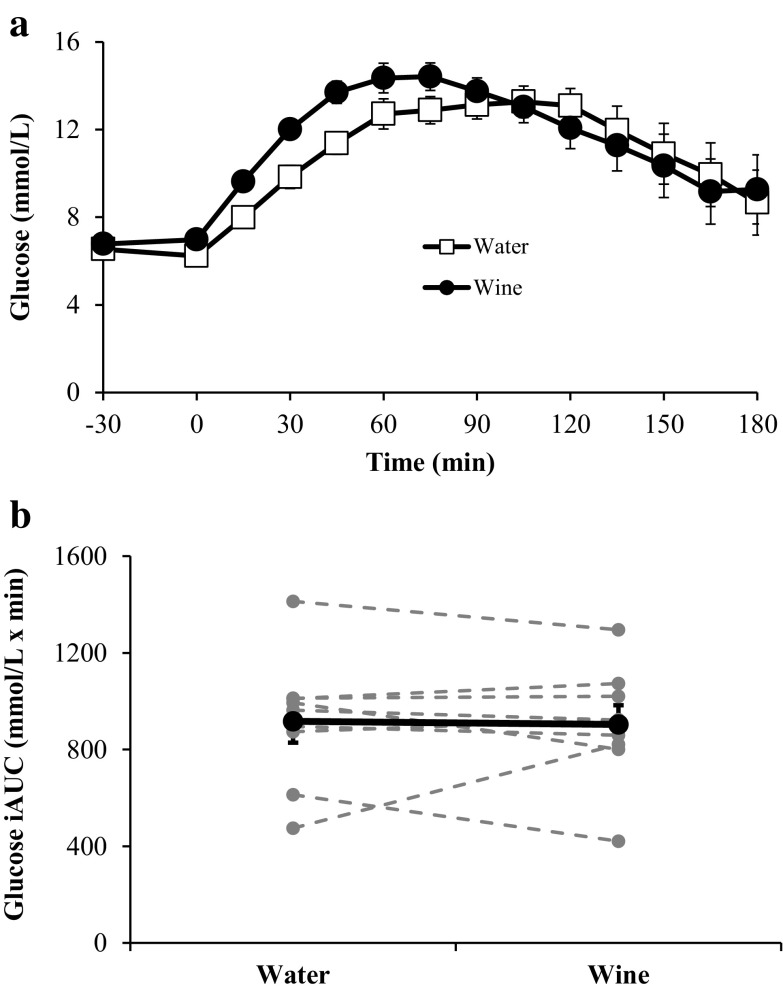
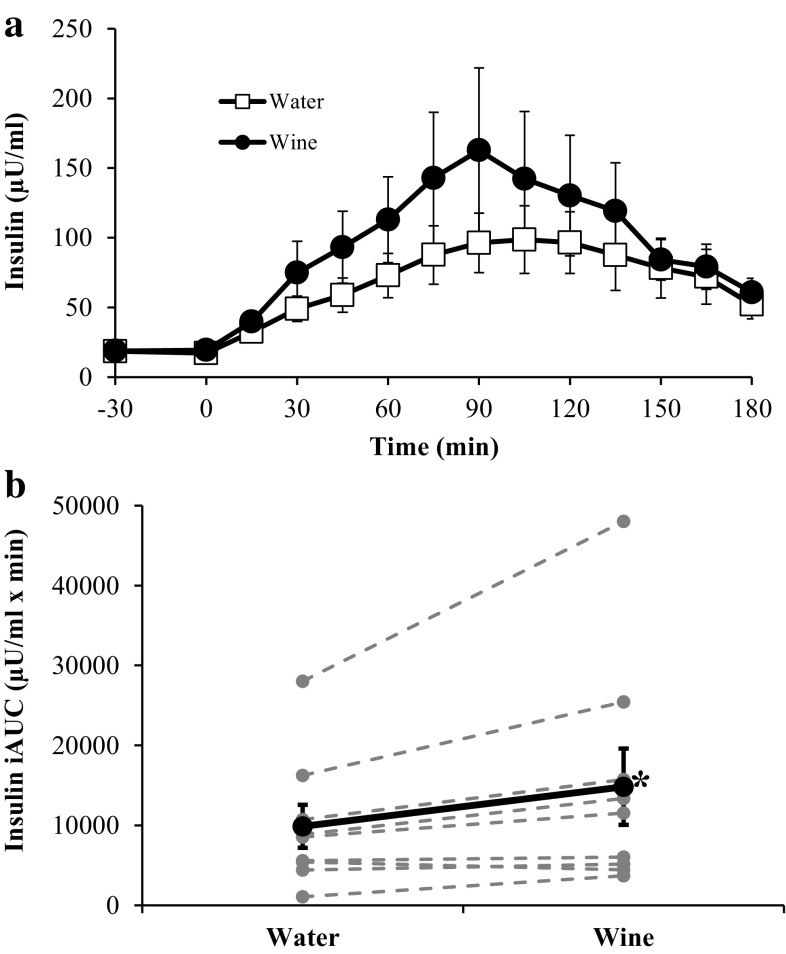
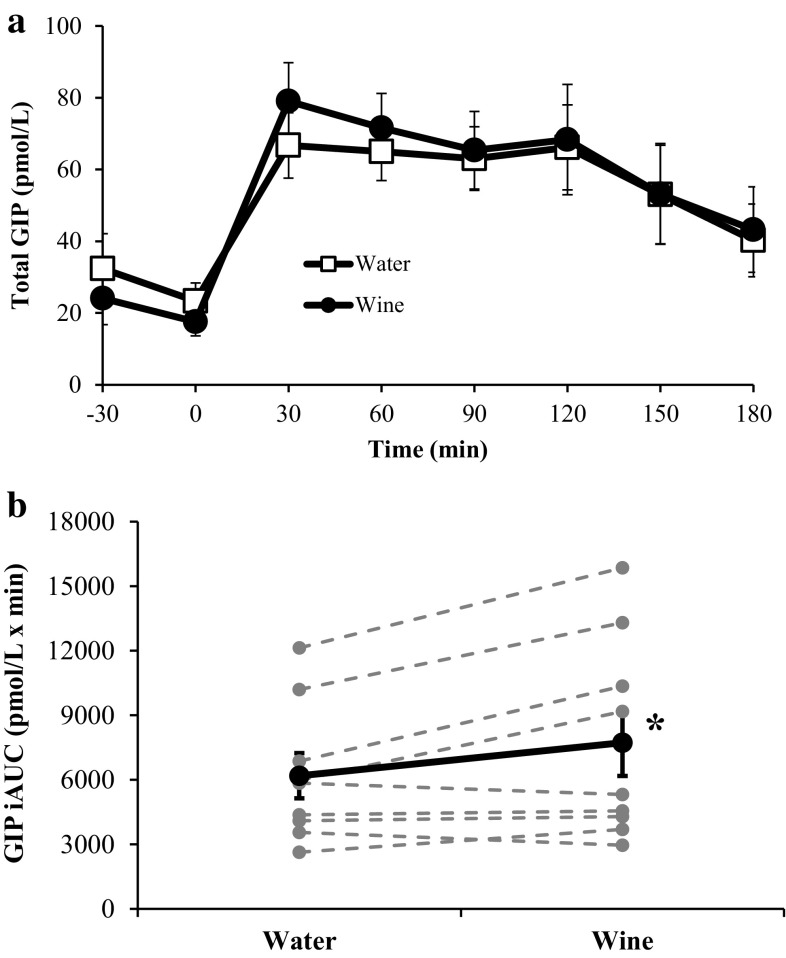
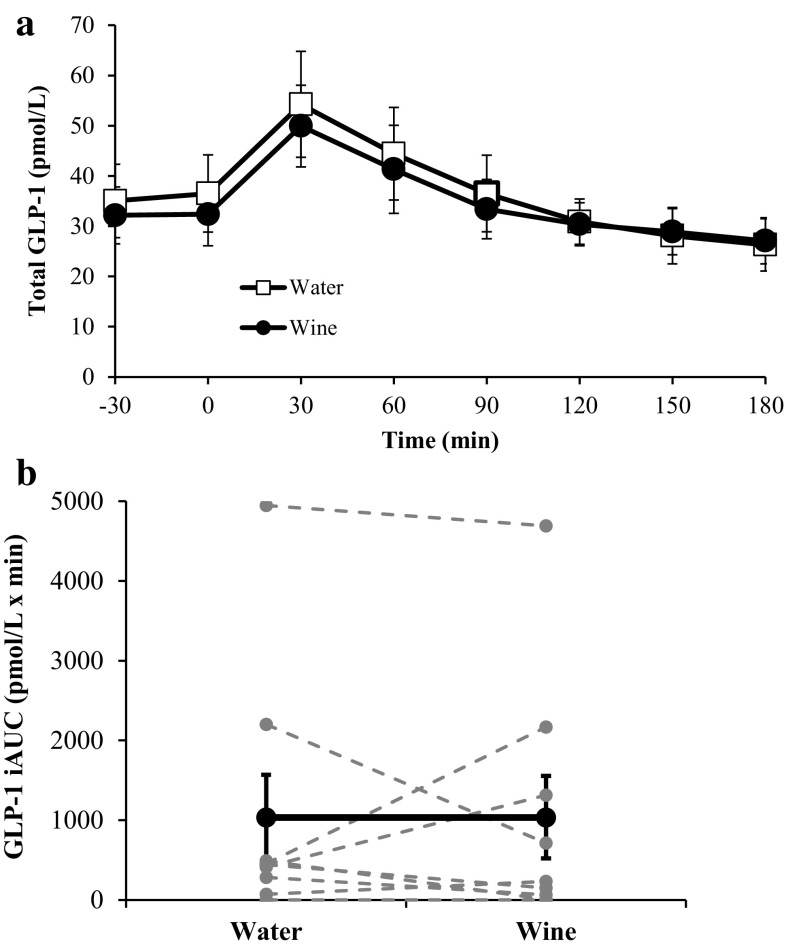
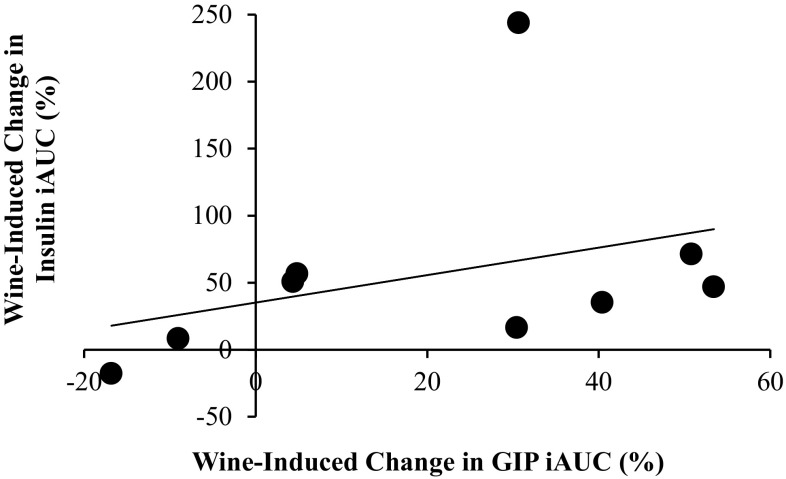
Results: Compared with water, consumption of red wine increased the incremental area under the curve (iAUC) for insulin by 50 % (14,837 ± 4759 vs. 9885 ± 2686 µU/ml × min; p < 0.05) and for GIP by 25 % (7729 ± 1548 vs. 6191 ± 1049 pmol/l × min; p < 0.05). Glucose and GLP-1 responses were not affected by red wine.

Conclusion: Wine consumption before an OGTT augments the insulin response, which may be partially driven by a greater GIP response. Because glucose levels were not reduced, acute wine consumption may not be effective treatment for enhancing glycemic control or may need to be combined with therapy that improves insulin sensitivity.

Keywords: Alcohol; Glucagon-like peptide 1; Glucose-dependent insulinotropic peptide; Incretins; Insulin; Type 2 diabetes.


Conflict of interest statement

The authors declare that they have no conflict of interest.All procedures followed were in accordance with the ethical standards of the responsible committee on human experimentation (institutional and national) and with the Helsinki Declaration of 1964 and later versions. Informed consent or a substitute for it was obtained from all patients before inclusion in the study.

Figures

Fig. 1
Fig. 1
Serum glucose concentrations before and during each OGTT (a) and the corresponding glucose iAUC values (b). In b, bold markers represent the mean values whereas gray markers represent individual responses. The rate of increase in glucose concentration is significantly greater after treatment with red wine at time points 15–45 min (p < 0.01). Data are expressed as mean ± SE
Fig. 2
Fig. 2
Serum insulin concentrations before and during each OGTT (a) and the corresponding insulin iAUC values (b). In b, bold markers represent the mean values whereas gray markers represent individual responses. *Insulin iAUC is significantly greater after treatment with red wine (p < 0.05). Data are expressed as mean ± SE
Fig. 3
Fig. 3
Serum C-peptide concentrations before and during each OGTT (a) and the corresponding C-peptide iAUC values (b). In b, bold markers represent the mean values whereas gray markers represent individual responses. Data are expressed as mean ± SE
Fig. 4
Fig. 4
Plasma GIP concentrations before and during each OGTT (a) and the corresponding GIP iAUC values (b). In b, bold markers represent the mean values whereas gray markers represent individual responses. *GIP iAUC is significantly greater after treatment with red wine (p < 0.05). Data are expressed as mean ± SE
Fig. 5
Fig. 5
Plasma GLP-1 concentrations before and during each OGTT (a) and the corresponding GLP-1 iAUC values (b). In b, bold markers represent the mean values whereas gray markers represent individual responses. Data are expressed as mean ± SE
Fig. 6
Fig. 6
Relationship between wine-induced changes in GIP iAUC and insulin iAUC, expressed as percentage increase. As drawn, the correlation coefficient (r) is 0.35 and r 2 = 0.12. If the outlier is removed from the calculation, r = 0.62 and r 2 = 0.38

References

    1. Ohtsubo K, Chen MZ, Olefsky JM, et al. Pathway to diabetes through attenuation of pancreatic beta cell glycosylation and glucose transport. Nat Med. 2011;17:1067–1075. doi: 10.1038/nm.2414. - DOI - PMC - PubMed
    1. Holst JJ, Knop FK, Vilsbøll T, et al. Loss of incretin effect is a specific, important, and early characteristic of type 2 diabetes. Diabetes Care. 2011;34:S251–S257. doi: 10.2337/dc11-s227. - DOI - PMC - PubMed
    1. Mikus CR, Oberlin DJ, Libla J, et al. Glycaemic control is improved by 7 days of aerobic exercise training in patients with type 2 diabetes. Diabetologia. 2012;55:1417–1423. doi: 10.1007/s00125-012-2490-8. - DOI - PMC - PubMed
    1. Buelens JWJ, Stolk RP, van der Schouw YT, et al. Alcohol consumption and risk of type 2 diabetes among older women. Diabetes Care. 2005;28:2933–2938. doi: 10.2337/diacare.28.12.2933. - DOI - PubMed
    1. Conigrave KM, Hu BF, Camargo CA, Jr, et al. A prospective study of drinking patterns in relation to risk of type 2 diabetes among men. Diabetes. 2001;50:2390–2395. doi: 10.2337/diabetes.50.10.2390. - DOI - PubMed

LinkOut - more resources