. 2018 Dec 27;4(12):e01073.
doi: 10.1016/j.heliyon.2018.e01073. eCollection 2018 Dec.

Various salts employed as precipitant in combination with polyethylene glycol in protein/detergent particle association

Affiliations

Various salts employed as precipitant in combination with polyethylene glycol in protein/detergent particle association

Takayuki Odahara et al. Heliyon. .

Abstract

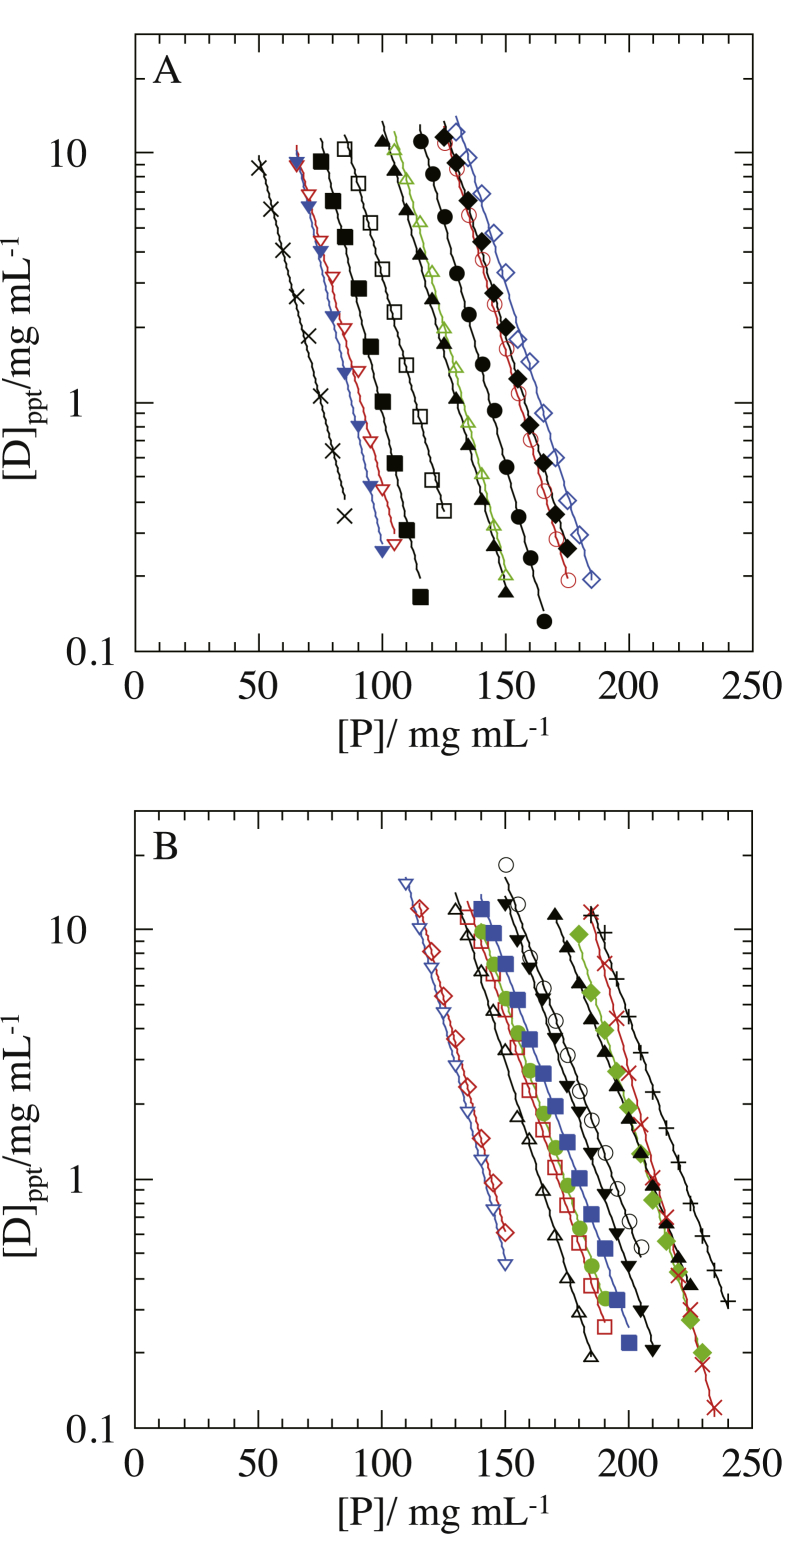
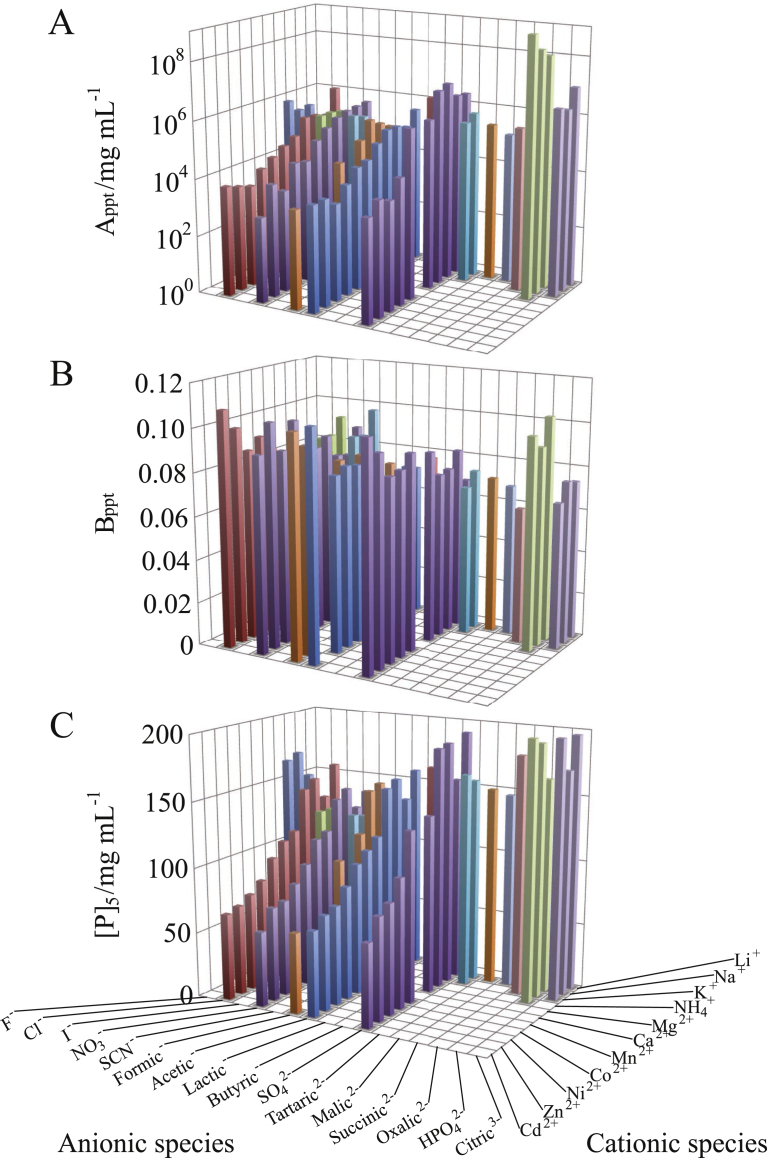
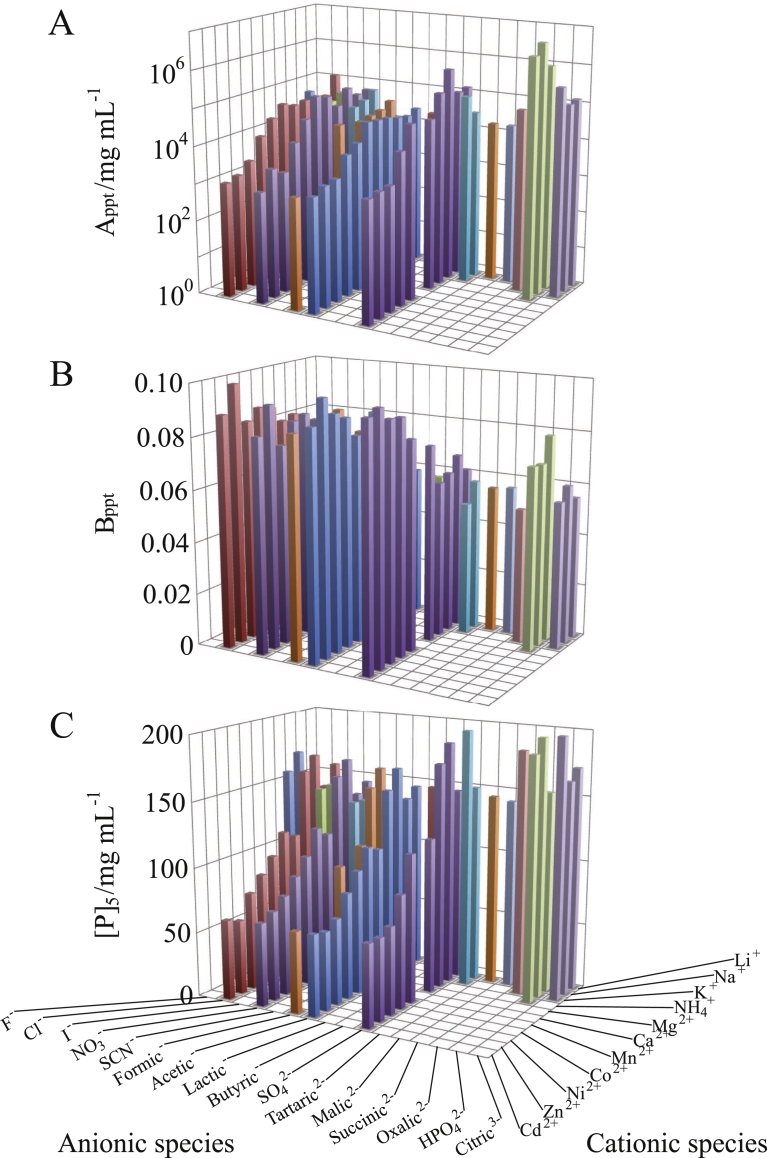
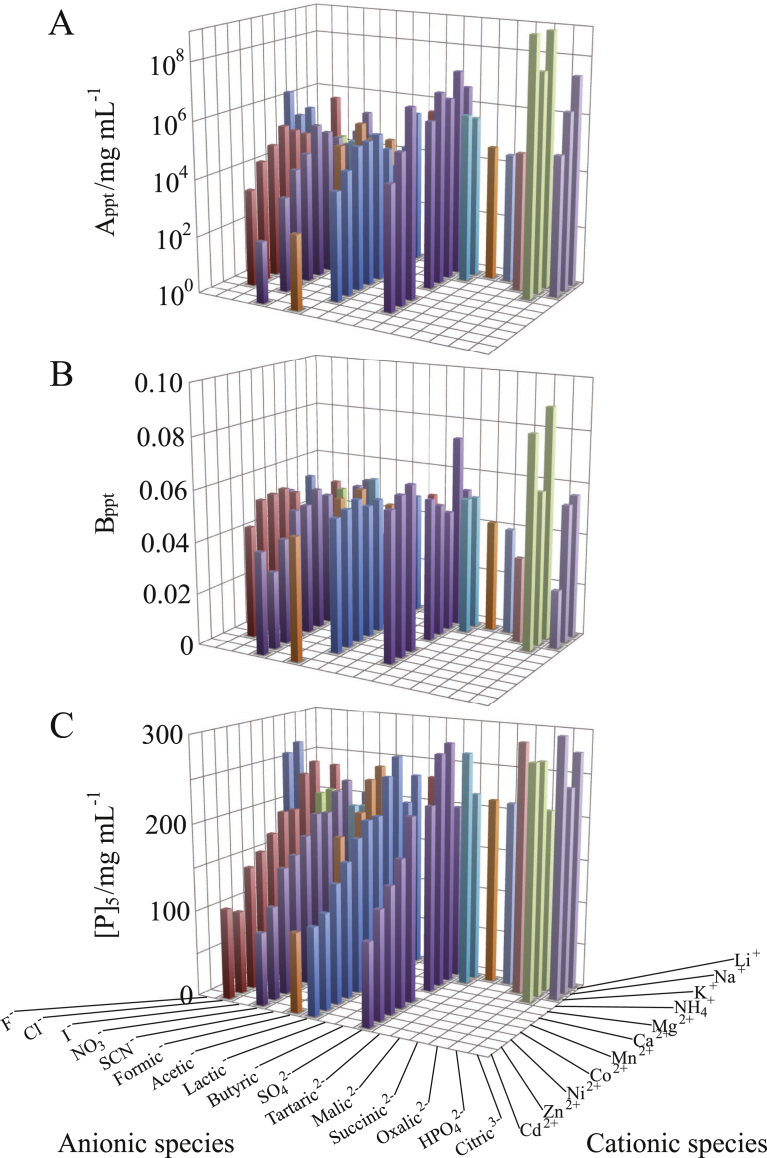
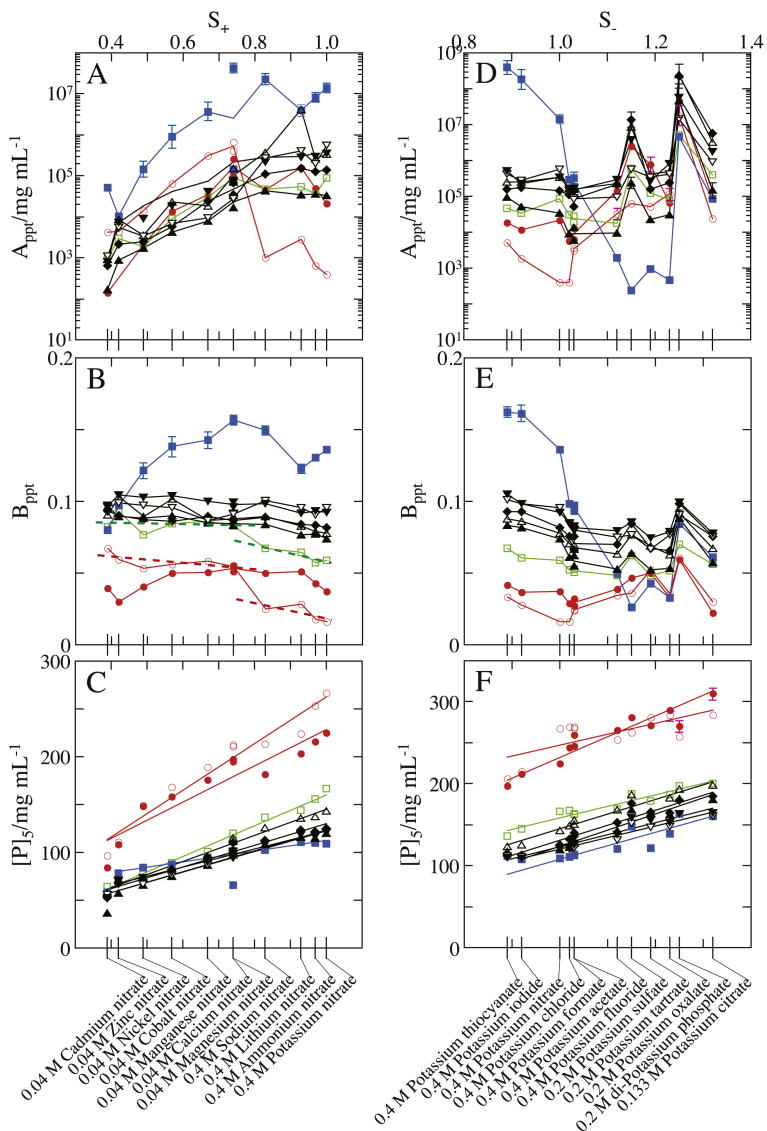
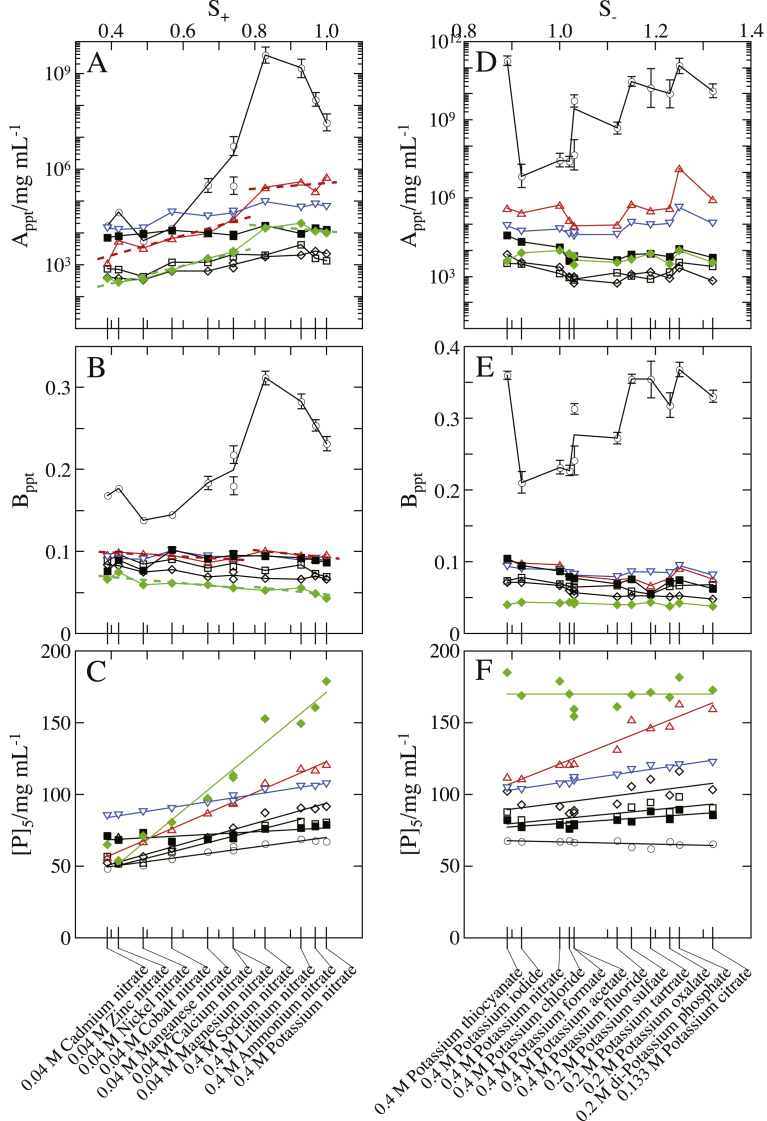
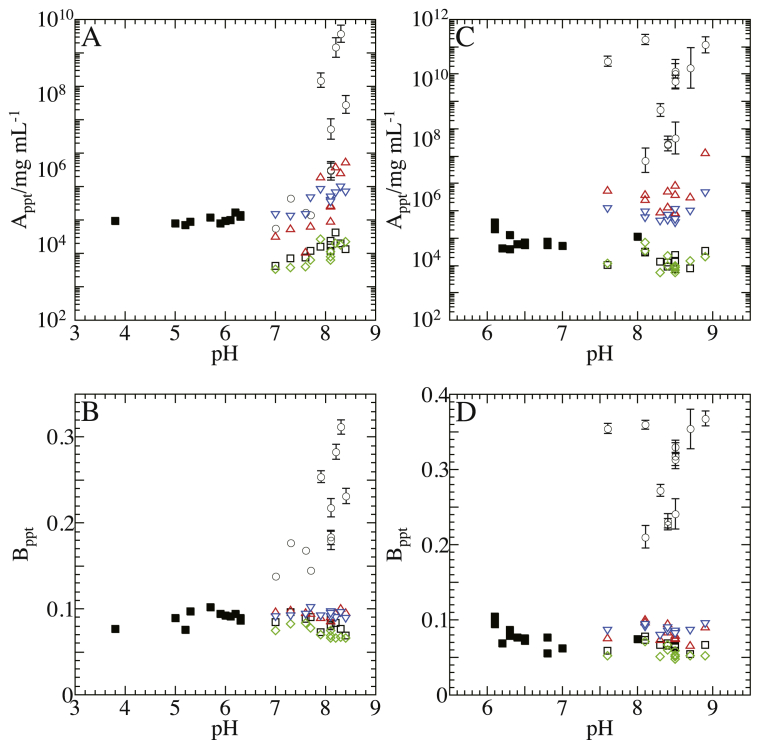
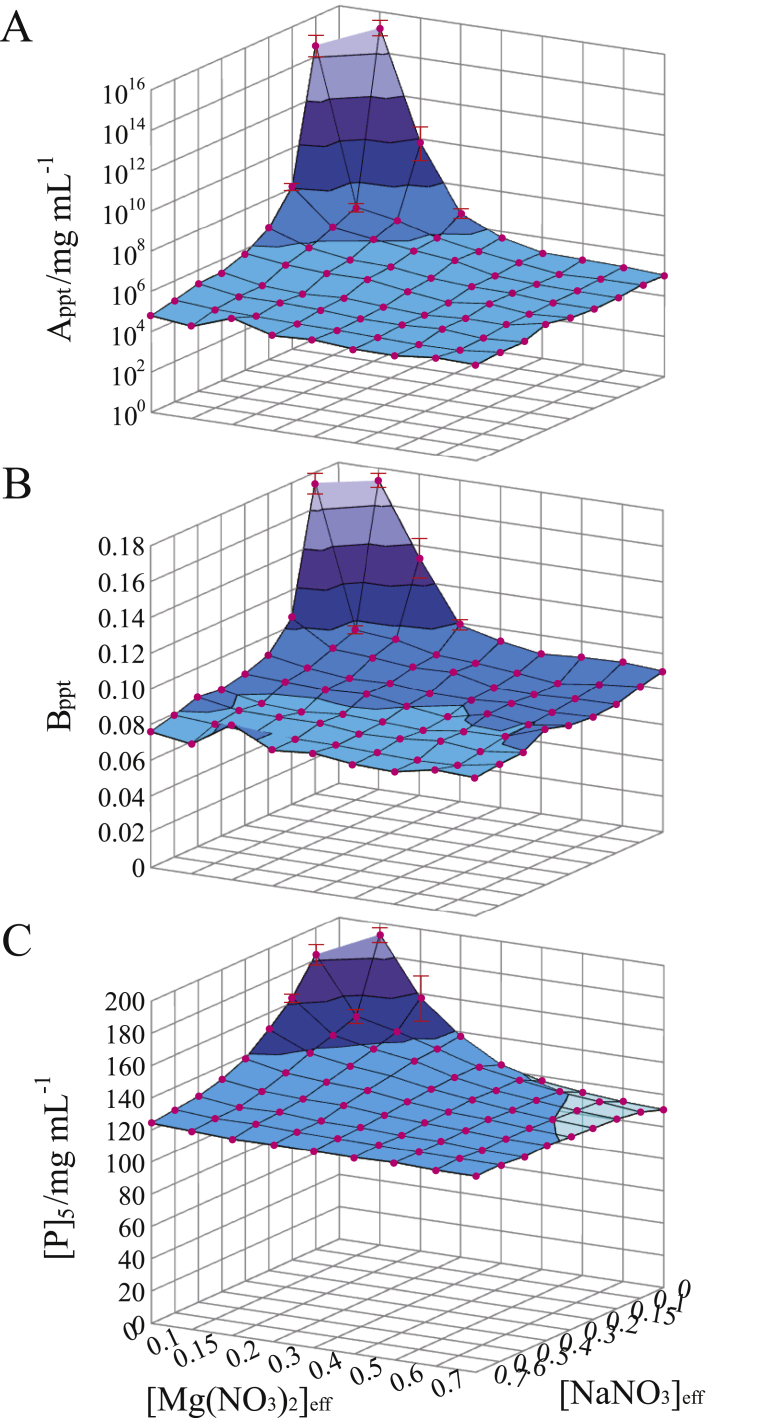
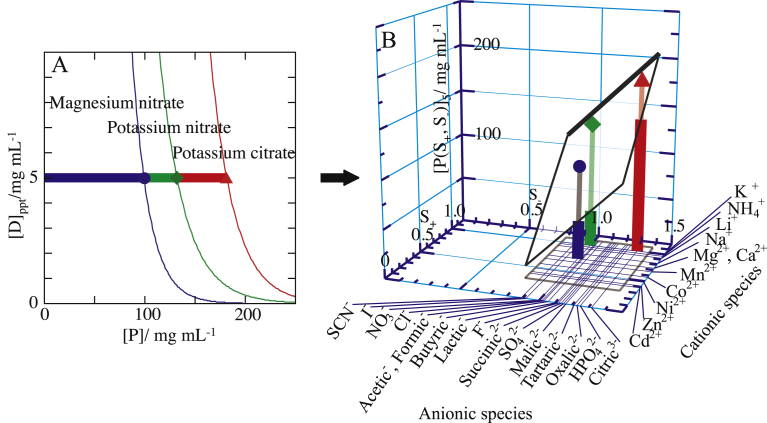
Salt/polyethylene glycol (PEG) mixtures are employed as precipitants for biological macromolecules. The dependence of precipitation curves (PCs) on salt species was investigated for integral membrane protein/detergent particles. By relating this dependence to properties of ions dissociated from added salts, the following roles and effects of various ions were clarified. In the presence of ions whose interaction with water is stronger than water-water interaction, the coordination of solvent molecules is rearranged so as to strengthen short-range steric repulsion and hydrophobic attraction. Ions whose interaction with water is weaker than water-water interaction can be a hindrance to hydrophobic-hydrophobic contact. Moreover, strong electric fields of divalent cations can cause an attractive effect between electronegative or polar groups of neighboring particles. The variations of particle-particle and particle-PEG interactions depending on the state of particles and surrounding solvents were correlative. Due to this, the relationship between the horizontal positions of PC and the species of salts added could be formulated as a binary linear function of cationic and anionic species composing the salts.

Keywords: Biochemistry; Inorganic chemistry; Physical chemistry.


Figures

Fig. 1
Fig. 1
Precipitation curves (PCs) of Rb. sphaeroides LH2 solubilized by OG against polyethylene glycol (PEG) concentration for various salt species. The PCs were obtained by least-square fitting of Eq. (1) to the supernatant protein concentrations [D]ppt against PEG concentration [P]. A; the added nitrates and their concentrations were 0.4 M LiNO3 (◯), 0.4 M NaNO3 (●), 0.4 M KNO3 (◇), 0.4 M NH4NO3 (◆), 0.04 M Mg(NO3)2 (▵), 0.04 M Ca(NO3)2 (▲), 0.04 M Mn(NO3)2 (□), 0.04 M Co(NO3)2 (■), 0.04 M Ni(NO3)2 (▿), 0.04 M Zn(NO3)2 (▼), and 0.04 M Cd(NO3)2 (×). B; the added potassium salts and their concentrations were 0.4 M KF (◯), 0.4 M KCl (□), 0.4 M KI (◇), 0.4 M KNO3 (▵), 0.4 M KSCN (▿), 0.4 M potassium formate (●), 0.4 M potassium acetate (■), 0.2 M K2SO4 (◆), 0.2 M potassium oxalate (▲), 0.2 M potassium tartrate (▼), 0.2 M K2HPO4 (×), and 0.133 M potassium citrate (+). The other solution ingredients were 25 mM Tris–HCl (pH 8.0), 0.2 mg/mL NaN3, and 8 mg/mL OG.
Fig. 2
Fig. 2
Dependence of PC of Rb. sphaeroides LH2/OG on constituent cationic and anionic species of the salts added. The values of (A) intercept Appt, (B) slope Bppt and (C) horizontal position [P]5 (PEG concentration at which the protein concentration [D]ppt in supernatant was 5 mg/mL) were based on the best-fitted PCs. The concentrations of added salts were 0.4 M for 1:1 salts, 0.2 M for 1:2 ones, 0.133 M for 1:3 ones, and 0.04 M for 2:1 and 2:2 salts. The other solution ingredients were 25 mM Tris–HCl (pH 8.0), 0.2 mg/mL NaN3, and 8 mg/mL OG.
Fig. 3
Fig. 3
Dependence of PC of Rb. sphaeroides LH2/LDAO on constituent cationic and anionic species of the salts added. The values of (A) intercept Appt, (B) slope Bppt and (C) horizontal position [P]5 were based on the best-fitted PCs. The concentrations of added salts were 0.4 M for 1:1 salts, 0.2 M for 1:2 ones, 0.133 M for 1:3 ones, and 0.04 M for 2:1 and 2:2 salts. The other solution ingredients were 25 mM Tris–HCl (pH 8.0), 0.2 mg/mL NaN3, and 1 mg/mL LDAO.
Fig. 4
Fig. 4
Dependence of PC of Rb. sphaeroides LH2/C12E8 on constituent cationic and anionic species of the salts added. The values of (A) intercept Appt, (B) slope Bppt and (C) horizontal position [P]5 were based on the best-fitted PCs. The concentrations of added salts were 0.4 M for 1:1 salts, 0.2 M for 1:2 ones, 0.133 M for 1:3 ones, and 0.04 M for 2:1 and 2:2 salts. The other solution ingredients were 25 mM Tris–HCl (pH 8.0), 0.2 mg/mL NaN3, and 1 mg/mL C12E8. Since the supernatant protein concentrations in the presence of ZnCl2, Zn(CH3COO)2, ZnSO4, CdCl2, Cd(CH3COO)2, or CdSO4 followed the equation [D]ppt = Appt - Bppt [P], the Bppt values for the salts are not shown. Hence, further investigations are awaited to elucidate the molecular mechanism concerning the linear variation between [D]ppt and [P].
Fig. 5
Fig. 5
Variation of PC for ionic species observed with Rb. sphaeroides LH2 separately solubilized by nine species of detergents. A – C; the added salts were nitrates of various cations, and the salt concentrations were 0.4 M for 1:1 salts and 0.04 M for 2:1 and 2:2 ones. D – F; the added salts were potassium salts of various anions, and the salt concentrations were 0.4 M for 1:1 salts, 0.2 M for 1:2 ones, 0.133 M for 1:3 salt to equalize the concentration of potassium ion. The values of (A and D) intercept Appt, (B and E) slope Bppt and (C and F) horizontal position [P]5 of the best-fitted PCs are plotted against the S± values allotted to the constituent ionic species. The solubilization detergents and their concentrations were 1 mg/ml TX100 (◯), 1 mg/ml C12E8 (●), 1 mg/ml LDAO (□), 9 mg/ml MEGA9 (■), 8 mg/ml OG (▵), 1 mg/ml LM (▿), 1 mg/ml SM1200 (◆), 3 mg/ml OTG (▲), and 2 mg/ml NTM (▼). The other solution ingredients were 25 mM Tris–HCl (pH 8.0) and 0.2 mg/mL NaN3. The straight lines were obtained by the least-squares fitting of a linear function to the value of [P]5 against the value of S± to show the mean variation of PC depending on ionic species. The error bars attached to symbols represent standard errors calculated by the least-square fitting; no error bar is shown for the standard errors that are similar to or smaller than the size of symbols. Besides, it is noted that the maximal standard errors shown in Table 1 are similar to or smaller than the size of symbols.
Fig. 6
Fig. 6
Variation of PC for ionic species observed with particles of different proteins. A – C; the added salts were nitrates of various cations, and the salt concentrations were 0.4 M for 1:1 salts and 0.04 M for 2:1 and 2:2 ones. D – F; the added salts were potassium salts of various anions, and the salt concentrations were 0.4 M 1:1 salts, 0.2 M 1:2 ones, 0.133 M 1:3 salt to equalize the concentration of potassium ion. The values of (A and D) intercept Appt, (B and E) slope Bppt and (C and F) horizontal position [P]5 of the best-fitted PCs are plotted against the S± values allotted to the constituent ionic species. The protein/detergent particles and solution ingredients were as follows: Rp. viridis PRU/LM (◯), Rp. viridis RC/LM (□), Rb. sphaeroides RC/LM (◇), Rb. sphaeroides RC/LDAO (◆), Rb. sphaeroides LH2/LM (▵) and Rb. capsulatus LH2/LM (▿) in a Tris buffer solution (25 mM Tris–HCl, and 0.2 mg/mL NaN3; pH 8.0), and Rp. viridis RC/LM (■) in a BisTris buffer solution (25 mM BisTris–HCl, and 0.2 mg/mL NaN3; pH 6.0). The concentrations of LDAO and LM were 1 mg/mL. The straight lines were obtained by the least-squares fitting of a linear function to the value of [P]5 against the value of S± to show the mean shift of PC depending on ionic species. The error bars attached to symbols represent standard errors calculated by the least-square fitting; no error bar is shown for the standard errors that are similar to or smaller than the size of symbols.
Fig. 7
Fig. 7
Variations of intercept and slope of PC with solution pH observed with particles of different proteins. The values of (A and C) intercept Appt and (B and D) slope Bppt are plotted against pH values of solution to which various salts are separately added. The protein/detergent particles and solution ingredients were as follows: Rp. viridis PRU/LM (◯), Rp. viridis RC/LM (□), Rb. sphaeroides RC/LM (◇), Rb. sphaeroides LH2/LM (▵) and Rb. capsulatus LH2/LM (▿) in a Tris buffer solution (25 mM Tris–HCl, and 0.2 mg/mL NaN3; pH 8.0), and Rp. viridis RC/LM (■) in a BisTris buffer solution (25 mM BisTris–HCl, and 0.2 mg/mL NaN3; pH 6.0). The concentrations of LDAO and LM were 1 mg/mL. The error bars attached to symbols represent standard errors calculated by the least-square fitting; no error bar is shown for the standard errors that are similar to or smaller than the size of symbols.
Fig. 8
Fig. 8
PC of Rb. sphaeroides LH2/OG for mixtures of NaNO3 and Mg(NO3)2 of various ‘effective concentrations’. The values of (A) intercept Appt, (B) slope Bppt and (C) horizontal position [P]5 were based on the best-fitted PCs. The coordinates of red circles against the ‘effective concentrations’ represent the experimental values of the three parameters. The other solution ingredients were 25 mM Tris–HCl (pH 8.0) and 0.2 mg/mL NaN3, and 8 mg/mL OG. The error bars attached to the red circles represent standard errors calculated by the least-square fitting; no error bar is shown for the standard errors that are similar to or smaller than the size of red circles.
Fig. 9
Fig. 9
Schematic representation of the relationship between horizontal position of PC and ionic species dissociated from salts added. A; PCs of a target protein/detergent particle experimentally obtained for three salt species at the same ‘effective concentration’—0.4 M potassium nitrate, 0.133 M potassium citrate, and 0.04 M magnesium nitrate, for example. For electric field around the particle to be sufficiently screened without salt–PEG phase separation, the concentrations of individual salts to add are empirically 0.3 to 0.4 in terms of ‘effective salt concentration’. B; the three parameters F, G and H in Eq. (2) are evaluated by using the [P]5 values (PEG concentration at which the protein concentration [D]ppt in supernatant is 5 mg/mL) of the three PCs experimentally obtained and the S± values (shown in Table 1) of ionic species that constitute the three salt species added. By substituting the evaluated values of the three parameters and the S± values of ionic species that constitute a desired salt species into Eq. (2), the value of [P]5 is calculated for the desired salt. Likewise, the values of [P]20 and [P]1 were evaluated for the sample and reservoir solutions in the initial crystallization screening of Rs. Rubrum PRU/DM, respectively.

Similar articles

References

    1. Juckes I.R.M. Fraction of proteins and viruses with polyethylene glycol. Biochim. Biophys. Acta. 1971;229:535–546. - PubMed
    1. McPherson A. The growth and preliminary investigation of protein and nucleic acid crystals for X-ray diffraction analysis. Methods Biochem. Anal. 1976;23:249–345. - PubMed
    1. Ingham K.C. Precipitation of proteins with polyethylene glycol: characterization of albumin. Arch. Biochem. Biophys. 1978;186:106–113. - PubMed
    1. Arakawa T., Timasheff S.N. Theory of protein solubility. Methods Enzymol. 1985;114:49–77. - PubMed
    1. Kühlbrandt W. Three–dimensional crystallization of membrane proteins. Q. Rev. Biophys. 1988;21:429–477. - PubMed

LinkOut - more resources