

Guidance and selection history in hybrid foraging visual search
- PMID: 30603990
- PMCID: PMC6408307
- DOI: 10.3758/s13414-018-01649-5
Guidance and selection history in hybrid foraging visual search
Abstract
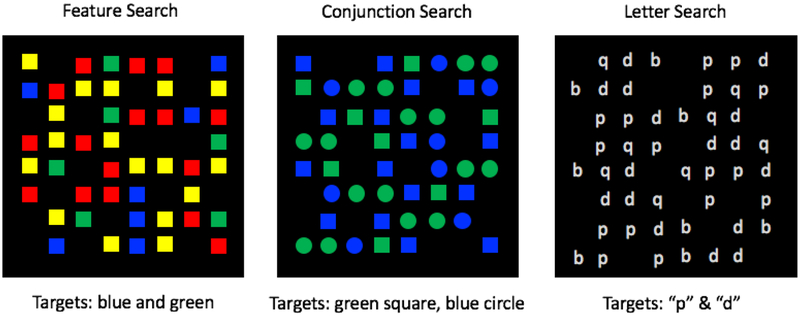
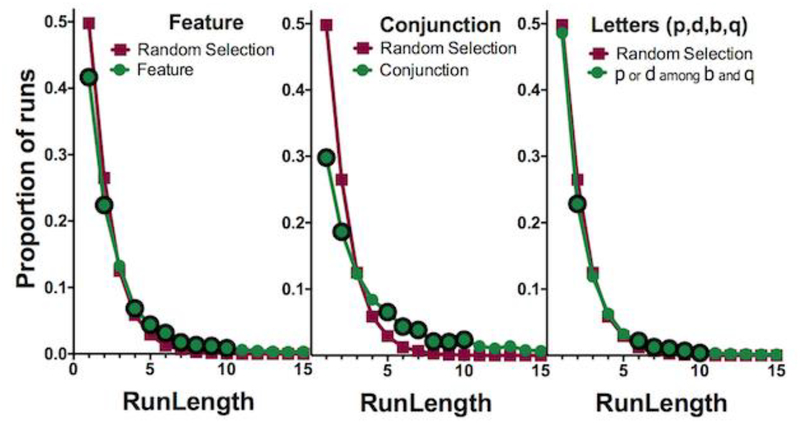
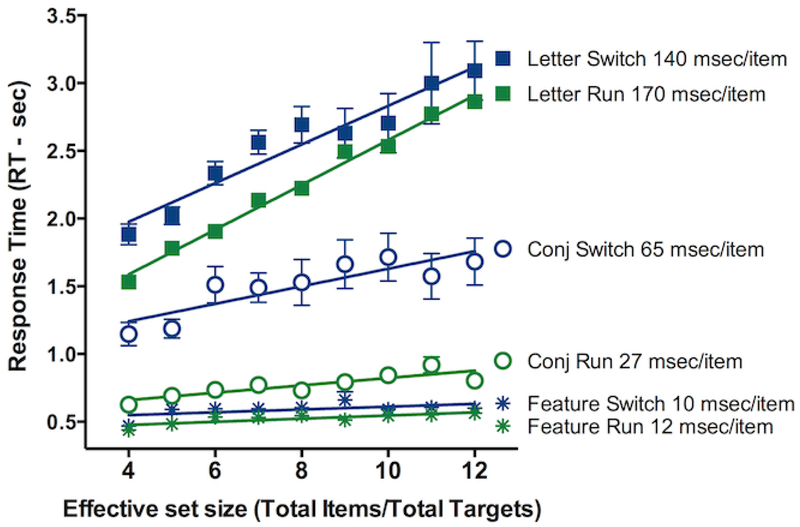
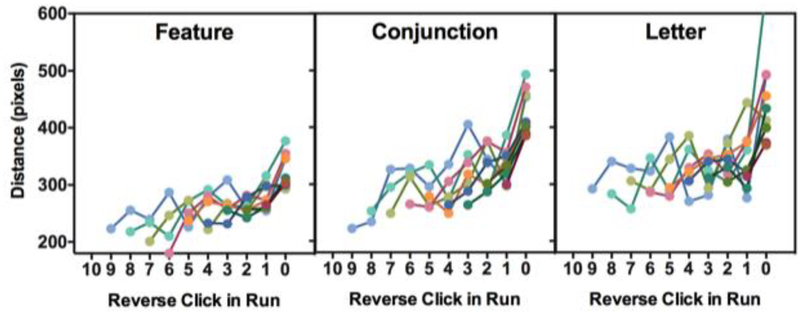
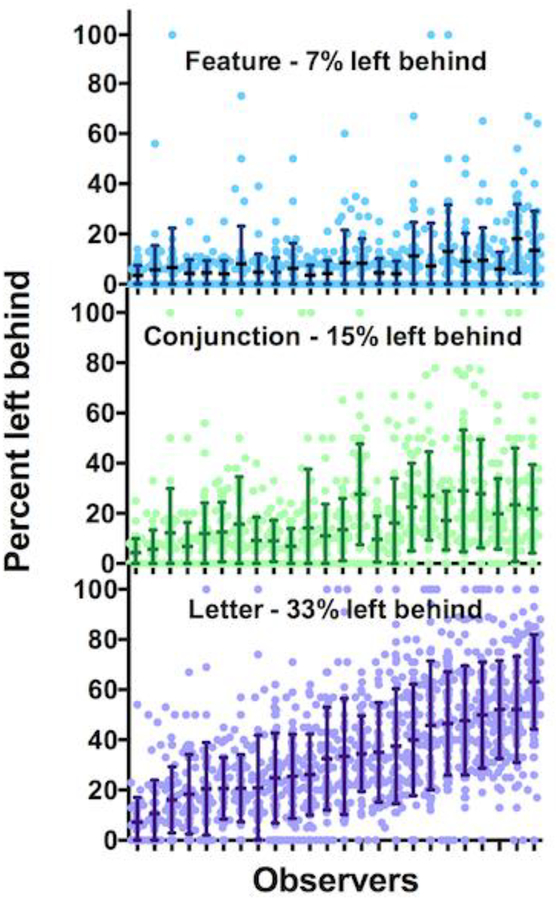
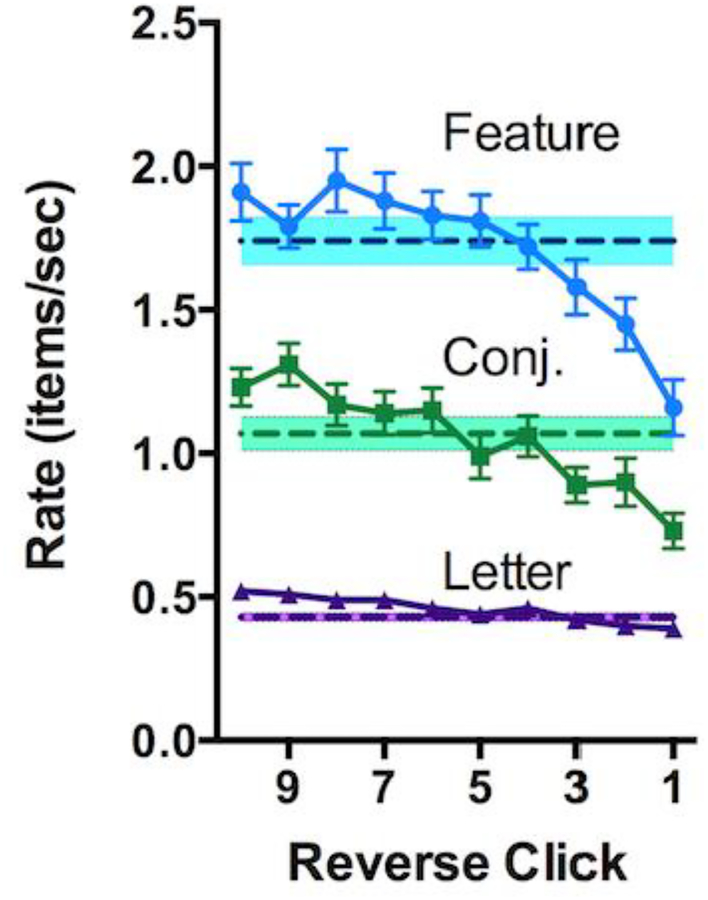
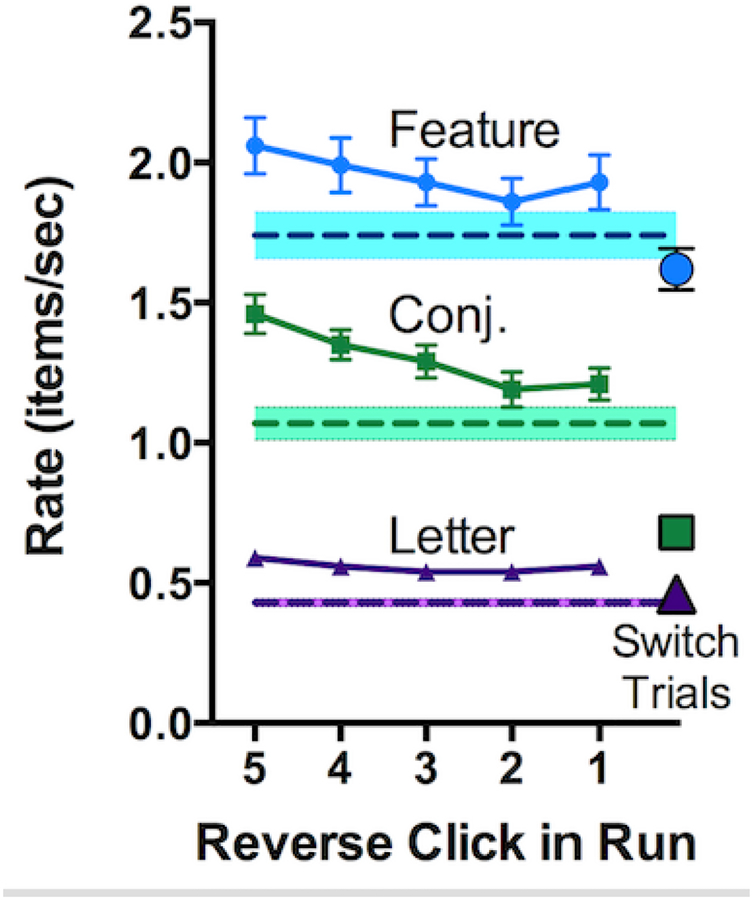
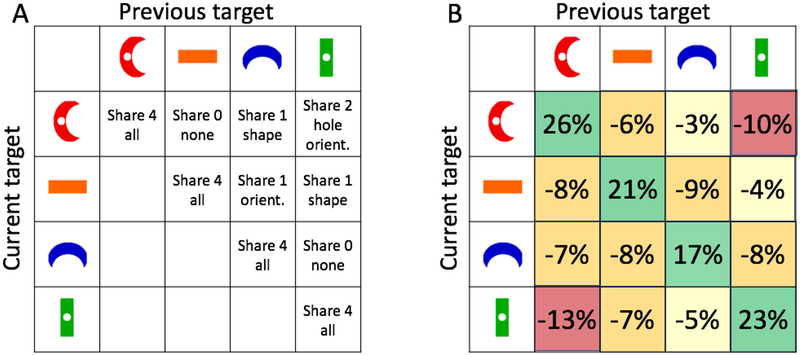
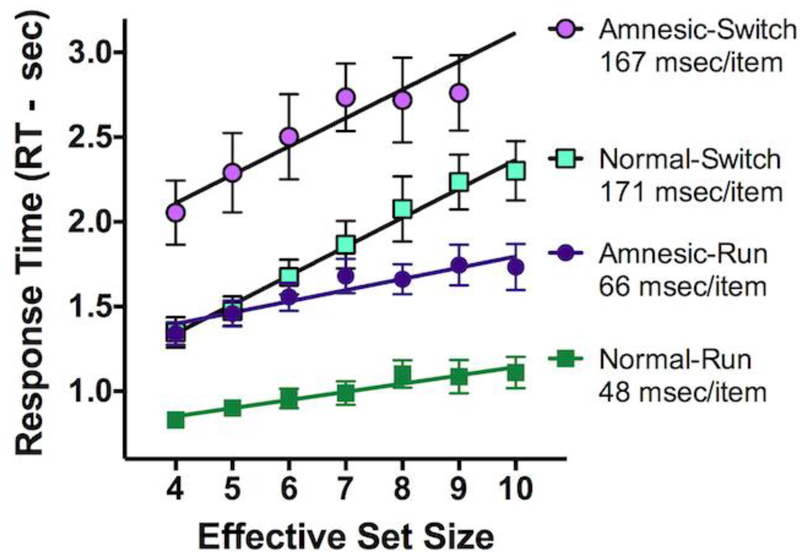
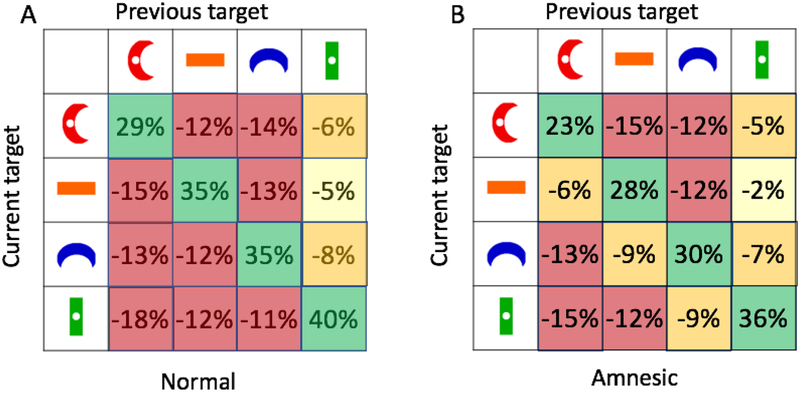
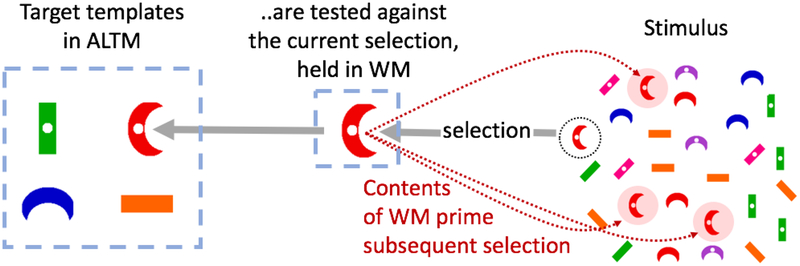
In Hybrid Foraging tasks, observers search for multiple instances of several types of target. Collecting all the dirty laundry and kitchenware out of a child's room would be a real-world example. How are such foraging episodes structured? A series of four experiments shows that selection of one item from the display makes it more likely that the next item will be of the same type. This pattern holds if the targets are defined by basic features like color and shape but not if they are defined by their identity (e.g., the letters p & d). Additionally, switching between target types during search is expensive in time, with longer response times between successive selections if the target type changes than if they are the same. Finally, the decision to leave a screen/patch for the next screen in these foraging tasks is imperfectly consistent with the predictions of optimal foraging theory. The results of these hybrid foraging studies cast new light on the ways in which prior selection history guides subsequent visual search in general.
Keywords: Priming; Visual search; Working memory.
Figures
Similar articles
-
Hybrid foraging search: Searching for multiple instances of multiple types of target.Vision Res. 2016 Feb;119:50-9. doi: 10.1016/j.visres.2015.12.006. Epub 2016 Jan 20. Vision Res. 2016. PMID: 26731644 Free PMC article.
-
Hybrid foraging search in younger and older age.Psychol Aging. 2019 Sep;34(6):805-820. doi: 10.1037/pag0000387. Epub 2019 Aug 15. Psychol Aging. 2019. PMID: 31414857 Free PMC article.
-
Hybrid value foraging: How the value of targets shapes human foraging behavior.Atten Percept Psychophys. 2018 Apr;80(3):609-621. doi: 10.3758/s13414-017-1471-x. Atten Percept Psychophys. 2018. PMID: 29270798
-
Guided Search 6.0: An updated model of visual search.Psychon Bull Rev. 2021 Aug;28(4):1060-1092. doi: 10.3758/s13423-020-01859-9. Epub 2021 Feb 5. Psychon Bull Rev. 2021. PMID: 33547630 Free PMC article. Review.
-
Foraging behavior in visual search: A review of theoretical and mathematical models in humans and animals.Psychol Res. 2022 Mar;86(2):331-349. doi: 10.1007/s00426-021-01499-1. Epub 2021 Mar 21. Psychol Res. 2022. PMID: 33745028 Review.
Cited by
-
Searching Through Alternating Sequences: Working Memory and Inhibitory Tagging Mechanisms Revealed Using the MILO Task.Iperception. 2020 Oct 15;11(5):2041669520958018. doi: 10.1177/2041669520958018. eCollection 2020 Sep-Oct. Iperception. 2020. PMID: 33149874 Free PMC article.
-
Foraging through emotions: emotional stimuli and participants' trait anxiety shape visual foraging.R Soc Open Sci. 2025 May 21;12(5):242175. doi: 10.1098/rsos.242175. eCollection 2025 May. R Soc Open Sci. 2025. PMID: 40400528 Free PMC article.
-
The effect of target scarcity on visual foraging.R Soc Open Sci. 2024 Dec 4;11(12):240060. doi: 10.1098/rsos.240060. eCollection 2024 Dec. R Soc Open Sci. 2024. PMID: 39635148 Free PMC article.
-
No matter what you do, travel is travel in visual foraging.Vision Res. 2024 Nov;224:108491. doi: 10.1016/j.visres.2024.108491. Epub 2024 Sep 27. Vision Res. 2024. PMID: 39340958
-
The Predation Game: Does dividing attention affect patterns of human foraging?Cogn Res Princ Implic. 2021 May 6;6(1):35. doi: 10.1186/s41235-021-00299-w. Cogn Res Princ Implic. 2021. PMID: 33956238 Free PMC article.
References
-
- Bond A (1982). The Bead Game: Response Strategies in Free Assortment. Human Factors [0018–7208] yr:1982 vol:24 iss:1 pg:101 24(2), 101–110.
-
- Bond AB (1983). Visual search and selection of natural stimuli in the pigeon: the attention threshold hypothesis. J Exp Psychol Anim Behav Process, 9(3), 292–306. - PubMed
MeSH terms
Grants and funding
LinkOut - more resources
Full Text Sources
Miscellaneous
