. 2019 Jan 3;10(1):37.
doi: 10.1038/s41467-018-07770-1.

Single cell RNA analysis identifies cellular heterogeneity and adaptive responses of the lung at birth

Affiliations

Single cell RNA analysis identifies cellular heterogeneity and adaptive responses of the lung at birth

Minzhe Guo et al. Nat Commun. .

Abstract

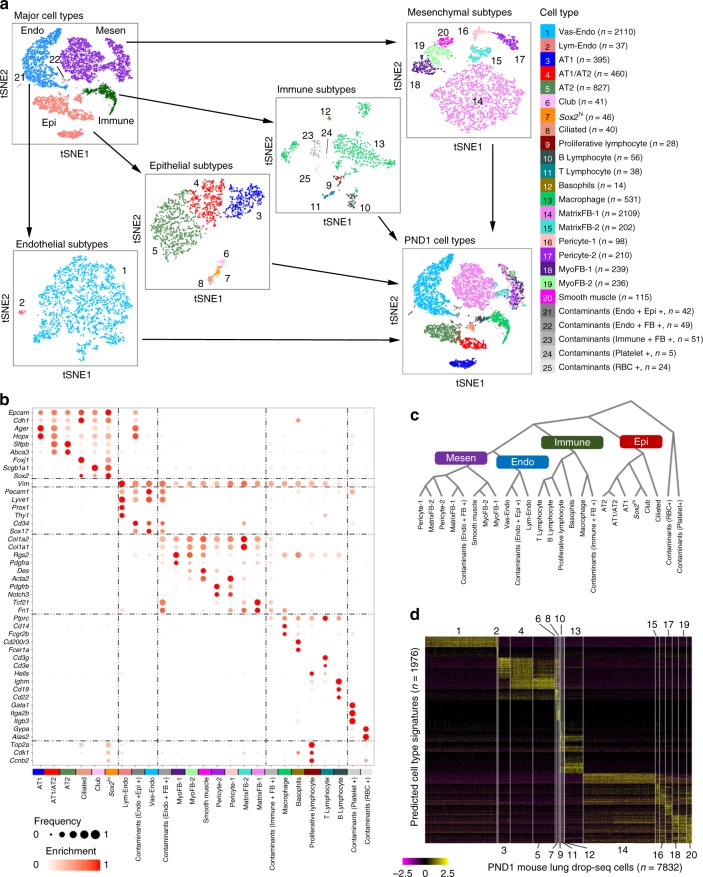
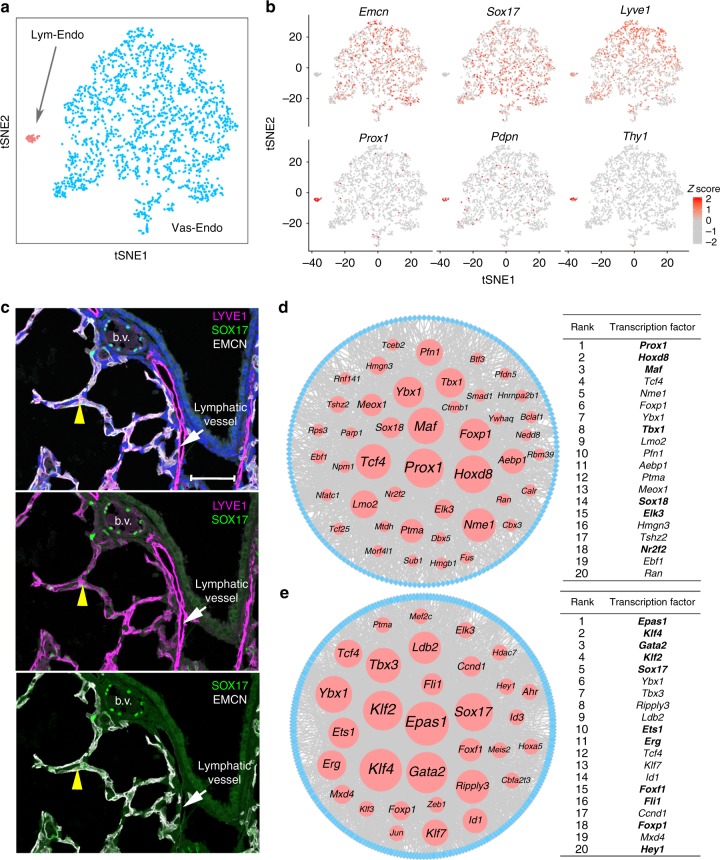
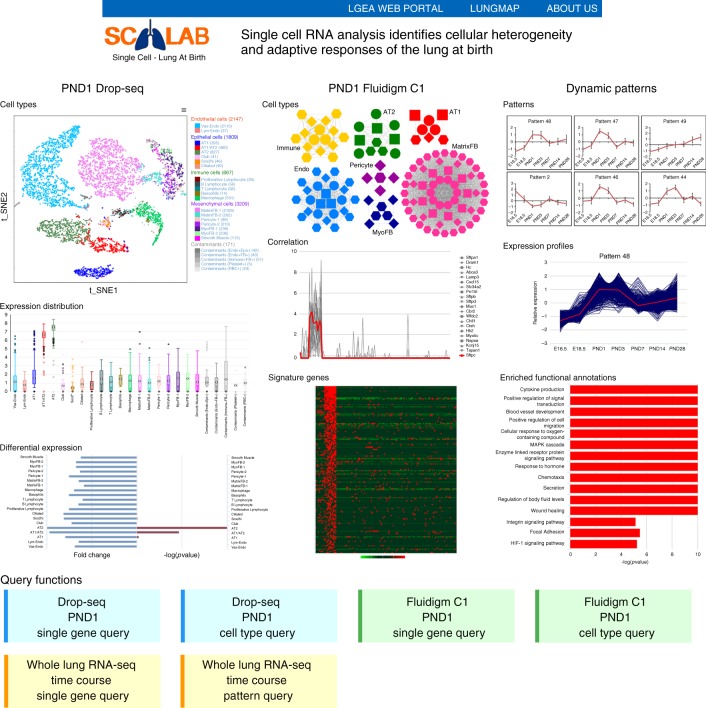
The respiratory system undergoes a diversity of structural, biochemical, and functional changes necessary for adaptation to air breathing at birth. To identify the heterogeneity of pulmonary cell types and dynamic changes in gene expression mediating adaptation to respiration, here we perform single cell RNA analyses of mouse lung on postnatal day 1. Using an iterative cell type identification strategy we unbiasedly identify the heterogeneity of murine pulmonary cell types. We identify distinct populations of epithelial, endothelial, mesenchymal, and immune cells, each containing distinct subpopulations. Furthermore we compare temporal changes in RNA expression patterns before and after birth to identify signaling pathways selectively activated in specific pulmonary cell types, including activation of cell stress and the unfolded protein response during perinatal adaptation of the lung. The present data provide a single cell view of the adaptation to air breathing after birth.


Conflict of interest statement

The authors declare no competing interests.

Figures

Fig. 1
Fig. 1
Drop-seq analysis identifies a diversity of cell types in mouse lung after birth. a Cell types were identified using an iterative unbiased clustering strategy. Endo endothelial cells, Mesen mesenchymal cells, Immune immune cells, Epi epithelial cells. Cells (n = 8003) were from two individual mice at postnatal day 1 (PND1). Source data are provided as Source Data file. b Expression of known cell type markers was used to validate the cell type assignments. Node size is proportional to the gene’s expression frequency in a cell type. Node color is proportional to the gene’s sensitivity-based enrichment score in the cluster; red represents high enrichment score; enrichment scores were per gene max normalized for visualization. c Hierarchical clustering of cell types was used to reconstruct major lung cell types. Expression of a gene in a cell type was represented by its average expression in all the cells of this type. Pearson’s correlation based on distance and Ward linkage were used. d Selective expression of predicted gene signatures in corresponding cell types is shown in the heatmap. The predicted contaminated (doublet) cells (n = 171) were not included
Fig. 2
Fig. 2
Distinct pulmonary epithelial cells and their differentiation states. a Predicted subpopulations of epithelial cells in mouse lung at PND1. b Expression of Notch pathway genes (Hes1, Notch1, and Rbpj) and selective markers is shown. The expression is z-score normalized. c Single cell entropy was used to predict differentiation states of epithelial subpopulations. Entropy of a single cell is calculated using SLICE. Higher entropy represents less differentiated cell states. Boxplots represent 25th (bottom), 50th (centerline), and 75th (top) percentiles. d Enrichment of gene expression in epithelial subpopulations. Node size is proportional to the sensitivity-based enrichment score. The scores are per gene max normalized. Node color is proportional to the gene expression frequency in the cluster; red represents high expression frequency. e Predicted differentiation lineage model among AT1, AT1/AT2, and AT2 cells. f Predicted differentiation lineage model among Sox2hi, club, and ciliated cells. In e and f, top panels show cells in reduced dimensional space calculated using the DDRTree method in Monocle 2 and bottom panels show the cell states/clusters and lineage models predicted by SLICE
Fig. 3
Fig. 3
Prediction of key transcription factors for the two endothelial subtypes. a Predicted subpopulations of endothelial cells in mouse lung at PND1. b Expression of selective lymphatic and vascular endothelial markers is shown. The expression is z-score normalized. c Immunostaining for LYVE1, SOX17, and EMCN in mouse lung at PND1. LYVE1 is expressed at higher levels in lymphatic vessels (white arrows), and expressed at lower levels in a subset of cells co-expressing SOX17 and/or EMCN. Arrowheads are triple positive cells. Blood vessels (b.v.) are lined with SOX17+ cells. Sections from at least three independent animals were evaluated. Scale bar is 50 μm. d Prediction of key TFs for the lymphatic endothelial (Lym-Endo) subtype. Left panel shows the predicted TRN for Lym-Endo cells. Right panel shows 20 top-ranked TFs predicted to regulate Lym-Endo subtypes. TFs in bold are known to play important roles in the development of Lym-Endo. e Prediction of key transcription factors for the vascular endothelial (Vas-Endo) subtype. Left panel shows the predicted transcriptional regulatory network (TRN) for Vas-Endo cells. Right panel shows 20 top-ranked transcription factors or cofactors (TFs) predicted to regulate the Vas-Endo subtype. TFs in bold are known to play important roles in the development of Vas-Endo. In d and e, red nodes represent TFs, blue nodes represent target genes (TGs), edges represent the predicted regulatory interactions between TFs and TGs, and node size is proportional to their predicted importance in the reconstructed TRN
Fig. 4
Fig. 4
Diverse pulmonary mesenchymal cells and expression of signaling pathway genes. a Visualization of the expression of cell type signature genes, T-box transcription factors, and WNT, FGF, and IGF signaling pathway genes are shown in a t-distributed stochastic neighbor embedding (tSNE) plot of the seven mesenchymal subtypes. Left panel shows the reference map of seven mesenchymal subtypes in tSNE plot. Right panel shows the expression of signature and signaling pathway genes. b Differential expression of T-box transcription factors, WNT, FGF, and IGF pathway genes in the two MatrixFB subtypes is shown. Violet bars: −log10 transformed p-value of binomial differential expression test of genes in MatrixFB-1 cells; blue bars: −log10 transformed p-value of binomial differential expression test of genes in MatrixFB-2 cells. Minimum p-value was set to 1E−30. c Immunofluorescence staining shows co-location of SFRP2 and IGFBP5 in a subset of mesenchymal cells, representing a subset of the MatrixFB-2 cell type. Sections from at least three independent animals were evaluated. Scale bar is 50 μm
Fig. 5
Fig. 5
Dynamic regulation of genes and bioprocesses at birth. a RNA-seq samples were collected from seven time points of mouse lung development. b Top panel: six representative temporal gene expression patterns were identified; red dashed lines indicate PND1. Bottom panel: the significance (p-value), gene counts, and transcription factors in the six representative gene expression patterns. c Functional annotations uniquely or commonly enriched by the temporal gene expression patterns “Pattern 46” and “Pattern 47”. d, e The dynamic patterns of representative genes in four biological processes during mouse lung development. Red lines represent the data from mouse lung at PND1. The four biological processes and representative genes include surfactant synthesis (Sftpb, Sftpc, Abca3, Sftpd, Lpcat1), fluid transport and clearance (Scnn1a, Scnn1b, Scnn1g, Cftr, Slc6a14), cell proliferation (Ccna2, Ccnb1, Cdk1, Cdk2, Mki67), and response to oxidative stress (Cat, Fos, Gclc, Mapk14, Nfe2l2). d Gene expression patterns derived from RNA-seq data of mouse lung at E16.5-PND28. e Gene expression patterns derived from published RNA microarray data of mouse lung development from E9.5 to PND56. Gray dots represent individual data points. Black lines represent fitted locally weighted scatterplot smoothing profiles; gray regions are the confidence intervals around smoothing
Fig. 6
Fig. 6
UPR activity in the mouse lung at birth. a Associations of unfolded protein response (UPR) gene expression and specific cell types based on the single cell Drop-seq data. Associations (nodes) with Fisher’s exact test p-value < 0.05 and enrichment score ≥ 1.5 are shown. Node size is proportional to –log2-transformed Fisher’s exact test p-value. Node color gradient is proportional to the enrichment score. Sensor stress sensors, TF transcription factors, ERAD endoplasmic reticulum-associated degradation, Lipid lipid biosynthesis. b Whole lung lysates from three mice at each age of E18.5, PND1, and PND7 were immunoblotted for ATF6, SYVN1, CHOP, and β-actin. c Quantification of immunoblotting after normalization to β-actin. d Whole lung RNA was used to quantitate Scap, Cebpd, and Srebf2 RNA from three mice at each age of E18.5, PND1, and PND7. e ATF6 staining was increased in airway of PND1 compared to E18.5 and E16.5 tissue. Scale bar is 50 μm. Images are representative of at least three embryos/animals for each time point. Boxed regions are zoomed in. In c and d, *p-value < 0.05 from E18.5 determined by one-way ANOVA with Dunnett’s multiple comparison, mean ± S.E.M. Source data are provided as a Source Data file
Fig. 7
Fig. 7
PDIA3 staining in perinatal mouse lung epithelial cells. Mouse lungs were immunostained for PDIA3 and indicated markers of airway and alveolar epithelial cells at E16.5, E18.5, and PND1. PDIA3 co-expressed with NKX2-1 (ac), ABCA3 (df), and SCGB1A1 (jl). PDIA3 did not co-stain with AGER1 (gi). Boxed regions are zoomed in to show individual and merged channels to highlight co-localization of markers at each age. Images are representative of at least three embryos or pups at each age. Scale bar is 50 and 10 μm for the zoomed in box
Fig. 8
Fig. 8
Snapshots of outputs of the scLAB web application. Single cells of Lung At Birth, scLAB (https://research.cchmc.org/pbge/lunggens/SCLAB.html), provides easy accesses and visualizations of the data and results of the present work, including PND1 Drop-seq and Fluidigm C1 single cell RNA-seq data analysis, as well as the dynamic patterns of whole-lung time-course RNA-seq data analysis

References

    1. Hillman NH, Kallapur SG, Jobe AH. Physiology of transition from intrauterine to extrauterine life. Clin. Perinatol. 2012;39:769–783. doi: 10.1016/j.clp.2012.09.009. - DOI - PMC - PubMed
    1. Graves BW, Haley MM. Newborn transition. J. Midwifery Women’s Health. 2013;58:662–670. doi: 10.1111/jmwh.12097. - DOI - PubMed
    1. Morton SU, Brodsky D. Fetal physiology and the transition to extrauterine life. Clin. Perinatol. 2016;43:395–407. doi: 10.1016/j.clp.2016.04.001. - DOI - PMC - PubMed
    1. Desai TJ, Brownfield DG, Krasnow MA. Alveolar progenitor and stem cells in lung development, renewal and cancer. Nature. 2014;507:190–194. doi: 10.1038/nature12930. - DOI - PMC - PubMed
    1. Whitsett JA, Wert SE, Weaver TE. Alveolar surfactant homeostasis and the pathogenesis of pulmonary disease. Annu. Rev. Med. 2010;61:105–119. doi: 10.1146/annurev.med.60.041807.123500. - DOI - PMC - PubMed

Publication types

MeSH terms