. 2019 Jan 3;10(1):38.
doi: 10.1038/s41467-018-07841-3.

Ulcerative colitis mucosal transcriptomes reveal mitochondriopathy and personalized mechanisms underlying disease severity and treatment response

Affiliations

Ulcerative colitis mucosal transcriptomes reveal mitochondriopathy and personalized mechanisms underlying disease severity and treatment response

Yael Haberman et al. Nat Commun. .

Abstract

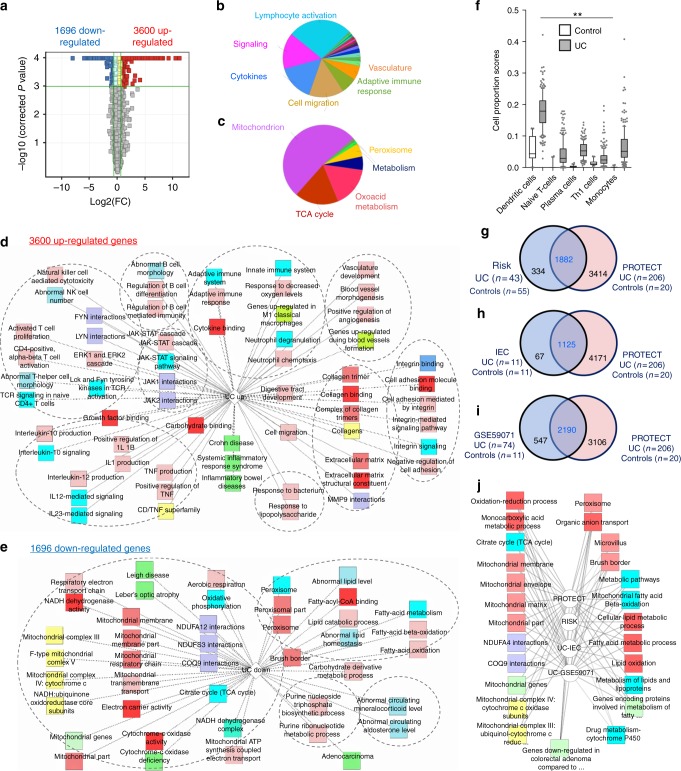
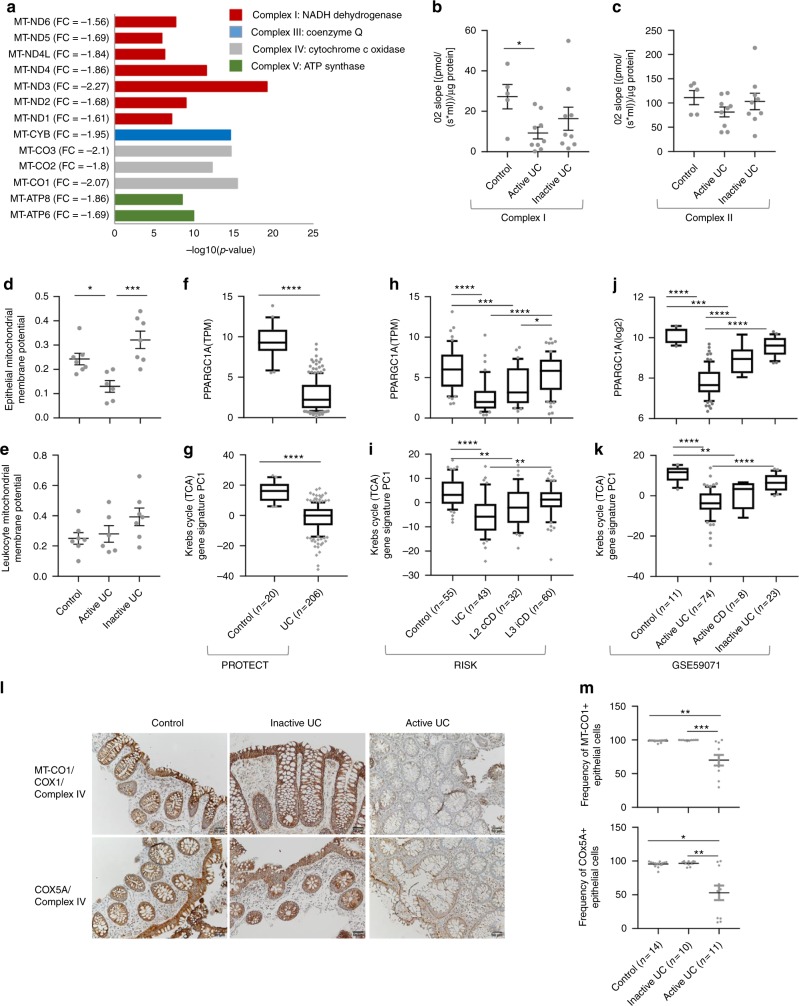
Molecular mechanisms driving disease course and response to therapy in ulcerative colitis (UC) are not well understood. Here, we use RNAseq to define pre-treatment rectal gene expression, and fecal microbiota profiles, in 206 pediatric UC patients receiving standardised therapy. We validate our key findings in adult and paediatric UC cohorts of 408 participants. We observe a marked suppression of mitochondrial genes and function across cohorts in active UC, and that increasing disease severity is notable for enrichment of adenoma/adenocarcinoma and innate immune genes. A subset of severity genes improves prediction of corticosteroid-induced remission in the discovery cohort; this gene signature is also associated with response to anti-TNFα and anti-α4β7 integrin in adults. The severity and therapeutic response gene signatures were in turn associated with shifts in microbes previously implicated in mucosal homeostasis. Our data provide insights into UC pathogenesis, and may prioritise future therapies for nonresponders to current approaches.


Conflict of interest statement

The authors declare no competing interest associated specifically with this work. However, the following authors report the following disclosures: Sonia Davis Thomas, independent data monitoring committee, Lycera Corporation; Margaret H. Collins, research support, Shire, Regeneron; Consultant, Allakos; Michael J. Rosen, advisory board, Celgene; David R. Mack, Shares in Biotagenics; RobertN. Baldassano, Advisory Board, Janssen, Consultant, Abbvie, Lilly, Receptors, Pfizer; Neal S. Leleiko: Consultant, Abbvie; Ashish S. Patel, Speakers Bureau Abbvie, Janssen; James Markowitz, Consultant, Janssen, UCB, Lilly; Anne M. Griffiths: Research support Abbvie, Consultant Abbvie, Janssen, Merck, Takeda, Speaker Abbvie, Janssen; Joel R. Rosh: Consultant, Abbvie, Janssen, Luitpold, UCB, Grant Funding Janssen, Abbive; Paul A. Rufo: Consultant, Shire, Leutpold, Speaker, Abbvie, Research support, TechLab; Cary G. Sauer, Consultant, Abbvie; Subra Kugathasan, Consultant, Janssen, UCB; Jennifer Strople, Consultant and speaker, Abbvie; Melvin B. Heyman, Research grants Genentech, Abbvie, Sucampo, Janssen. Jeffrey S. Hyams Advisory Board, Janssen, Consultant, Abbvie, Takeda, Lilly, Boerhinger-Ingelheim, Allergan, Astra Zeneca, Receptors, Pfizer; Lee A. Denson: Grant Support, Janssen. The following authors have nothing to disclose: Yael Haberman, Rebekah Karns, Phillip J. Dexheimer, Melanie Schirmer, Judith Somekh, Ingrid Jurickova, Tzipi Braun, Elizabeth Novak, Angela Mo, Bruce J. Aronow, Thomas D. Walters, Greg Gibson, Laura Bauman, Erin Bonkowski, Alison Marquis, Nathan Gotman, Mason Nistel, Marian D. Pfefferkorn, Susan S. Baker, Brendan M. Boyle, Sapana Shah, Joshua D. Noe, Kevin Mollen, Shai Shen-Orr, Curtis Huttenhower, Ramnik J. Xavier.

Figures

Fig. 1
Fig. 1
The core genes and pathways of newly diagnosed treatment-naive pediatric Ulcerative colitis emphasize lymphocyte activation and mitochondrial dysfunction. a Volcano plot of the 5296 differentially expressed genes between 206 UC and 20 Ctl samples (FC ≥ 1.5 and FDR < 0.001). Functional annotation enrichment analyses of the b 3600 upregulated and c 1696 downregulated UC core genes using CluGO charts. Detailed functional annotation enrichment analyses of the d 3600 upregulated and e 1696 downregulated UC core genes using ToppGene, ToppCluster, and Cytoscape are shown. GO Biological Process, Cellular Component, and Molecular Function (pink), pathways (light blue), mouse phenotype (blue), gene family (yellow), coexpression (light green), disease (dark green), interactions (purple). The full list of gene set enrichment results and P values are in Supplementary Dataset 1. f Computational deconvolution of cell subset proportions in 206 UC and 20 controls. Differences (Wilcoxon test with FDR < 0.01 (**)) are shown for cell types with at least 80% non-zero values. Overlap of differentially expressed genes between UC and Ctl in g RISK, h isolated colon epithelial cells (IEC), and i a microarray study of adult cases (GSE59071 ). j Detailed functional annotation enrichment analyses of the shared downregulated functions of the above studies. Box and whisker plot with central line indicating median, box ends representing upper and lower quartile, and whisker represent 10–90 percentile. UC ulcerative colitis
Fig. 2
Fig. 2
Colonic mitochondriopathy with a robust gene signature for reduced rectal mitochondrial energy functions in UC. a Thirteen mitochondrial-encoded genes are downregulated in UC vs. control with their fold change, FDR corrected P value, and associated mitochondrial complex as indicated. High-Resolution Respirometry was performed on fresh colon biopsies (5 control, 9 with active UC, and 9 with inactive UC) using the Oroboros O2k modular system to evaluate the activity of Complex I (b) and Complex II (c) of the electron transport chain. JC1 staining and FACS analysis were used to define the mitochondrial membrane potential of d EpCAM + epithelial cells and e CD45 + leukocytes isolated from colon biopsies (7 controls, 6 active UC, and 7 with inactive UC, 85–99% viability). Colon PPARGC1A (PGC-1α) expression for f PROTECT cohort, h RISK cohort in (transcripts per million (TPM) values), and for j adult UC cohort (GSE59071) in normalized values was plotted after stratifying the samples as indicated. g, i, k Krebs cycle TCA gene signature PCA PC1 for the above cohorts is plotted, samples are stratified as indicated. l Representative rectal MT-CO1 and COX5A immunohistochemistry (complex IV) for Ctl (n = 14), inactive (n = 10), and active UC (n = 11) with moderate Mayo endoscopic subscore and moderate PUCAI. Scale bar represents 50 μm. m Frequency of MT-CO1-positive and COX5A-positive epithelial cells out of the total epithelial cells for controls, inactive UC, and active UC. Lines in the scatter dot plots represent mean and SEM. Kruskal−Wallis with Dunn’s Multiple Comparison or ANOVA with false discovery rate (FDR) was used. *All two-sided P < 0.05, **P < 0.01, ***P < 0.001, ****P < 0.0001. UC ulcerative colitis, L2 cCD colon-only Crohn’s disease L3 iCD ileo-colonic Crohn’s disease
Fig. 3
Fig. 3
Disease severity is linked to adenoma/adenocarcinoma and innate immune pathways. a Venn diagram shows the 712 UC severity genes overlapping the 5296 core UC signature with the 916 clinical severity and 1038 endoscopic severity genes differentially expressed between severe and mild cases (FC ≥ 1.5, FDR < 0.001). b Functional annotation enrichment analyses of the 712 UC severity genes. The full list of gene set enrichment results and P values are in Supplementary Dataset 2. Node colors are as in Fig. 1. c Computational deconvolution of cell subset proportions in controls and UC patients stratified by endoscopic severity Mayo subscore. Differences (ANOVA with FDR < 0.05 (*)) between Mayo 3 (severe, n = 71) and 1 (mild, n = 27) are shown for those cell types in Fig. 1. d Hematoxylin and eosin (H&E, 100×) staining of control (left) and UC (right) case with acute cryptitis (arrows), crypts that do not rest on the muscularis mucosa (bar), and marked surface villiform change (concave arrows). e Venn diagram shows the 187 villiform changes genes overlapping with severity genes. f H&E staining of UC case with acute cryptitis (arrow) and numerous eosinophils in the lamina propria (arrowheads). g Three genes that are associated with presence of >32 eosinophils/HPF in UC. h Frequency (percent of patient of the total per group) of mild (n = 54) and moderate-severe (n = 152) patients across histology severity scores (defined in Supplementary Table 2). **Chi squares p < 0.01. i Distribution of moderate-severe patients who did or did not achieve week 4 (WK4) remission across histology severity scores. UC ulcerative colitis. Box and whisker plot with central line indicating median, box ends representing upper and lower quartile, and whisker represent 10–90 percentile. Scale bar represents 50 μm
Fig. 4
Fig. 4
A rectal gene signature is associated with response to UC induction therapy and microbial shifts. Samples loading PC1 (Z score) values of the corticosteroid response gene signature are shown for controls and the discovery cohort of 152 moderate-severe UC patients stratified by a WK4 clinical remission (R) and b mucosal healing (fecal calprotectin < 250 mcg/gm). Samples loading PC1 values derived from an independent 3′UTR Lexogen mRNASeq platform are shown for the discovery cohort and an independent validation cohort stratified by c WK4 clinical remission (R), or by d mucosal healing as in (b) for the validation cohort. Samples loading PC1 values including controls and e the GSE16879 data set of UC treated with anti-TNF and f GSE73661 of UC treated with anti-integrin α4β7. R: mucosal healing defined by colonoscopy. g Functional annotation enrichment analyses of the corticosteroid response gene signature and the top 50 genes that were differentially expressed in pretreatment colon biopsies of anti-TNF refractory vs. responsive UC patients. The full list of enriched functions and P values are in Supplementary Dataset 4. Genes are in blue and biologic functions in pink; connections to each signature are as shown. h Heat map summarizing Spearman similarity measures between microbial abundances and gene expression using hierarchical all-against-all association. *False discovery rate < 0.2. Blue and red indicate negative and positive associations, respectively. i Graphical summary of the cohort and main findings. Box and whisker plot with central line indicating median, box ends representing upper and lower quartile, and whisker represent 10–90 percentile. Mann−Whitney and ANOVA FDR as applicable, *P < 0.05, **P < 0.01, ***P < 0.001, ****<0.0001

References

    1. Kaplan GG, Ng SC. Understanding and preventing the global increase of inflammatory bowel disease. Gastroenterology. 2017;152:313–321, e312. doi: 10.1053/j.gastro.2016.10.020. - DOI - PubMed
    1. Peery AF, et al. Burden of gastrointestinal disease in the United States: 2012 update. Gastroenterology. 2012;143:1179–1187, e1171-e1173. doi: 10.1053/j.gastro.2012.08.002. - DOI - PMC - PubMed
    1. Hyams JS, et al. Factors associated with early outcomes following standardised therapy in children with ulcerative colitis (PROTECT): a multicentre inception cohort study. Lancet Gastroenterol Hepatol. 2017;2:855–868. doi: 10.1016/S2468-1253(17)30252-2. - DOI - PMC - PubMed
    1. Hyams JS, et al. Clinical outcome of ulcerative colitis in children. J. Pediatr. 1996;129:81–88. doi: 10.1016/S0022-3476(96)70193-2. - DOI - PubMed
    1. Boyle B, et al. Histologic correlates of clinical and endoscopic severity in children newly diagnosed with ulcerative colitis. Am. J. Surg. Pathol. 2017;41:1491–1498. doi: 10.1097/PAS.0000000000000939. - DOI - PMC - PubMed

Publication types

MeSH terms

Supplementary concepts