. 2019 May 1;126(5):1292-1314.
doi: 10.1152/japplphysiol.00035.2018. Epub 2019 Jan 3.

Exploring the underlying biology of intrinsic cardiorespiratory fitness through integrative analysis of genomic variants and muscle gene expression profiling

Affiliations

Exploring the underlying biology of intrinsic cardiorespiratory fitness through integrative analysis of genomic variants and muscle gene expression profiling

Sujoy Ghosh et al. J Appl Physiol (1985). .

Abstract

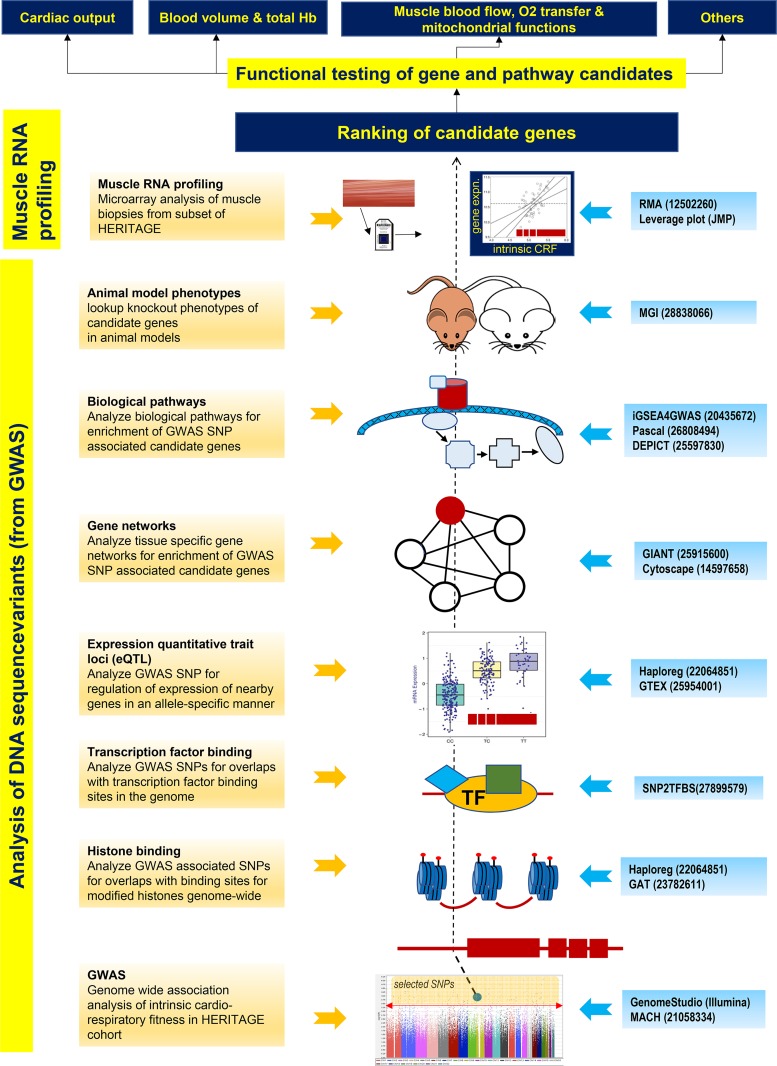
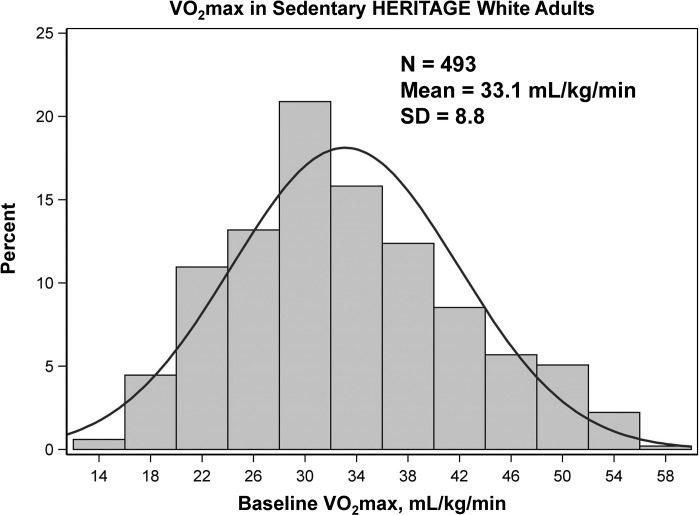
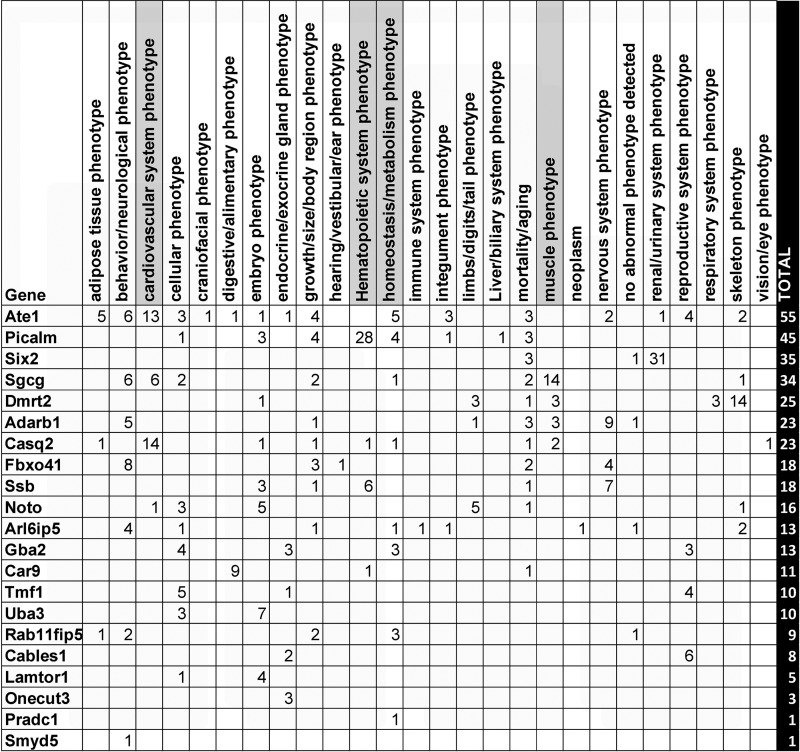
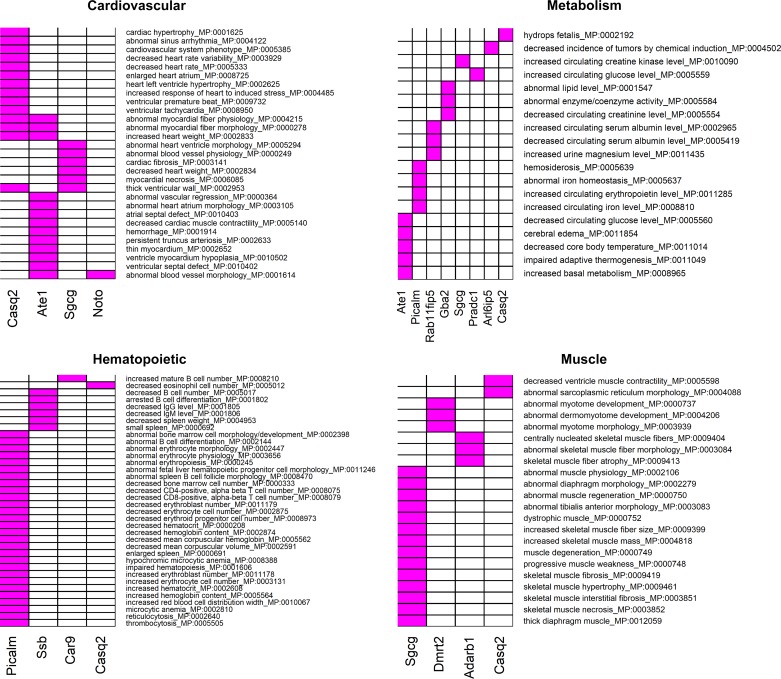
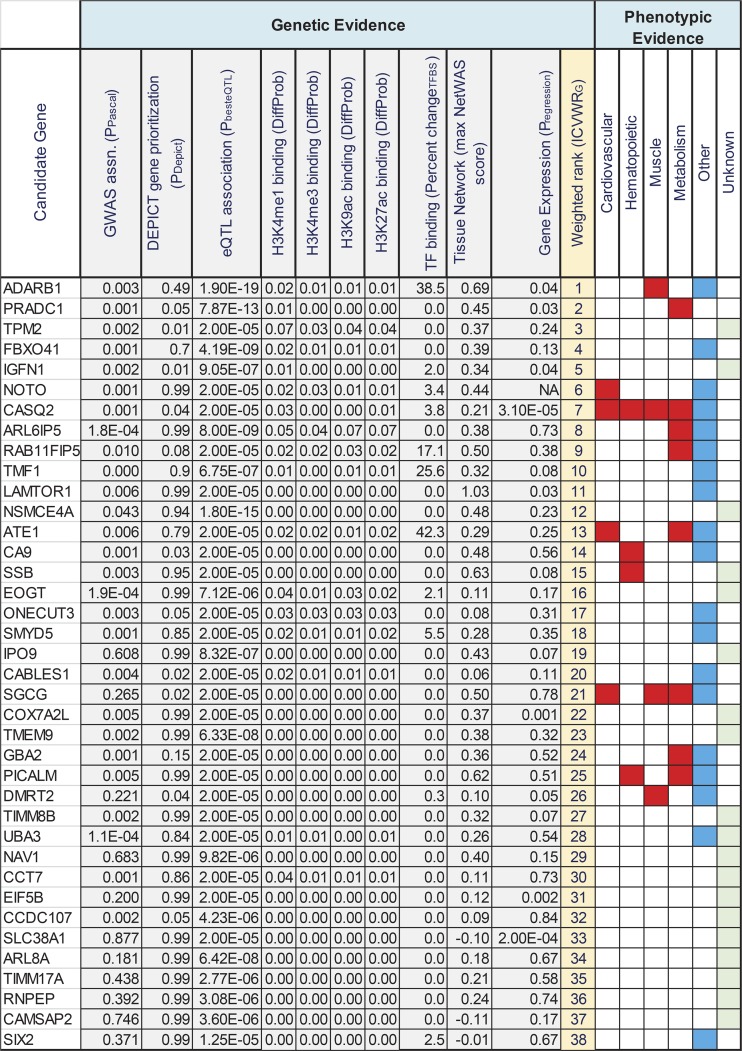
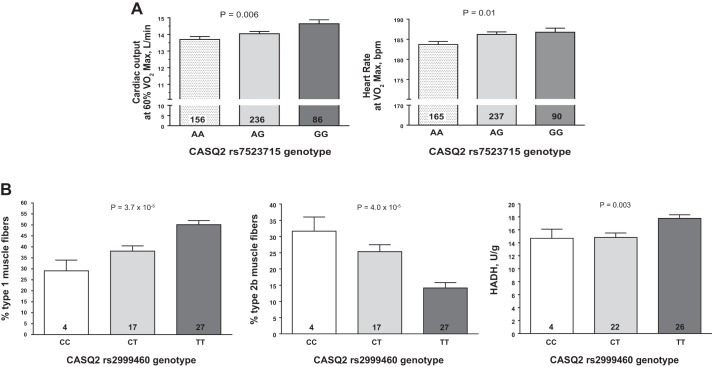
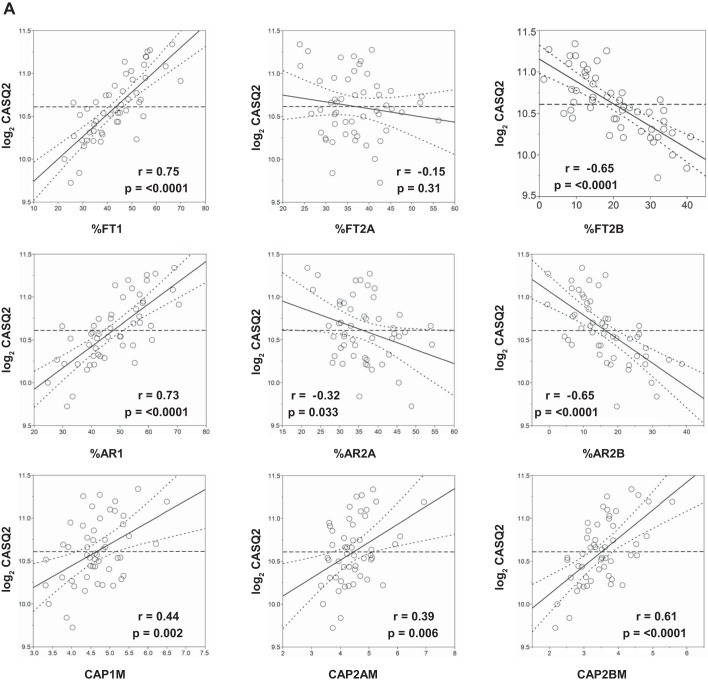
Intrinsic cardiorespiratory fitness (CRF) is defined as the level of CRF in the sedentary state. There are large individual differences in intrinsic CRF among sedentary adults. The physiology of variability in CRF has received much attention, but little is known about the genetic and molecular mechanisms that impact intrinsic CRF. These issues were explored in the present study by interrogating intrinsic CRF-associated DNA sequence variation and skeletal muscle gene expression data from the HERITAGE Family Study through an integrative bioinformatics guided approach. A combined analytic strategy involving genetic association, pathway enrichment, tissue-specific network structure, cis-regulatory genome effects, and expression quantitative trait loci was used to select and rank genes through a variation-adjusted weighted ranking scheme. Prioritized genes were further interrogated for corroborative evidence from knockout mouse phenotypes and relevant physiological traits from the HERITAGE cohort. The mean intrinsic V̇o2max was 33.1 ml O2·kg-1·min-1 (SD = 8.8) for the sample of 493 sedentary adults. Suggestive evidence was found for gene loci related to cardiovascular physiology (ATE1, CASQ2, NOTO, and SGCG), hematopoiesis (PICALM, SSB, CA9, and CASQ2), skeletal muscle phenotypes (SGCG, DMRT2, ADARB1, and CASQ2), and metabolism (ATE1, PICALM, RAB11FIP5, GBA2, SGCG, PRADC1, ARL6IP5, and CASQ2). Supportive evidence for a role of several of these loci was uncovered via association between DNA variants and muscle gene expression levels with exercise cardiovascular and muscle physiological traits. This initial effort to define the underlying molecular substrates of intrinsic CRF warrants further studies based on appropriate cohorts and study designs, complemented by functional investigations. NEW & NOTEWORTHY Intrinsic cardiorespiratory fitness (CRF) is measured in the sedentary state and is highly variable among sedentary adults. The physiology of variability in intrinsic cardiorespiratory fitness has received much attention, but little is known about the genetic and molecular mechanisms that impact intrinsic CRF. These issues were explored computationally in the present study, with further corroborative evidence obtained from analysis of phenotype data from knockout mouse models and human cardiovascular and skeletal muscle measurements.

Keywords: bioinformatics; cardiovascular physiology; in silico exploration of the biology of cardiorespiratory fitness; intrinsic cardiorespiratory fitness; skeletal muscle biology.


Conflict of interest statement

M.A. Sarzynski is a consultant for Genetic Direction. The other authors have no conflicts of interest to declare.

Figures

Fig. 1.
Fig. 1.
Overall scheme for integrative bioinformatics. Diagram summarizes the integrative bioinformatics approach employed in this study. It consists of applying specific tools to examine the possible consequences of genetic association study results on genome regulation (DNA) or gene expression (RNA) (highlighted in yellow on the left). The boxes 1–8 at the left summarize the various analytic approaches with brief descriptions. The middle shows a visual model of the analysis referred to. The blue boxes to the right list the various bioinformatic tools employed to perform the corresponding analyses. The numbers in the blue boxes to the right of the bioinformatic tools refer to the Pubmed IDs (PMIDs) of the publications describing the respective software tools. Beginning with genome-wide association study (GWAS) summary data (bottom, box 1), single-nucleotide polymorphisms (SNPs) are selected at a user-defined threshold (above the red line in the Manhattan plot) and queried, via several high-content online databases (e.g., ENCODE, Roadmap, GTEx, etc.), for their effects on genome cis-regulation [e.g., histone and transcription factor (TF) binding and expression of nearby genes] and their enrichment in functional interaction networks (boxes 2–5). Additional queries investigate the enrichment of SNP-associated genes in biological pathways (box 6). These combined analyses help generate a short list of candidate genes potentially linked to the trait of interest. Further validation of these gene candidates is sought by interrogating their effects in knockout animal models (box 7) and by correlating gene expression to molecular and physiologic end points relevant to the trait (box 8). The refined list of candidate genes is then ranked, via some appropriate metric, to select genes for functional validation against trait-relevant phenotypes such as those listed at the top of the diagram. For illustration purposes, a gene is indicated schematically in red as a line with 4 boxes to represent the exon-intron structure. A selected SNP, shown to reside in the gene promoter that overlaps with histone and transcription factor binding, functions as an expression quantitative trait loci (eQTL). The SNP-associated gene belongs to a gene network and biological pathway, shows a phenotype in mouse models and is transcriptionally correlated to intrinsic cardiorespiratory fitness levels (ascending order of analyses in the schematic, dashed line).
Fig. 2.
Fig. 2.
Distribution of intrinsic V̇o2max expressed by kg of body weight in 493 sedentary adults of both sexes of European ancestry. Maximal O2 uptake was measured on a cycle ergometer on two different days. See text materials and methods.
Fig. 3.
Fig. 3.
Effects of noncoding single-nucleotide polymorphisms (SNPs) on histone and transcription factor occupancy and cis-gene expression. A: enhancer-enrichment analysis across selected tissues, based on the overlap of intrinsic cardiorespiratory fitness (CRF)-associated SNPs with enhancer regions identified in Haploreg; the significance of enhancer enrichment is indicated by the negative logarithm of the binomial P value on the y-axis. B: distribution of the overlap of intrinsic CRF-associated SNPs (plus SNPs in linkage disequilibrium, r2 > 0.8) with regions of active promoters and enhancers identified by modified histone binding across selected tissues. The four histone marks representing active promoter and enhancer elements are shown in columns and selected tissues in rows. Data are column normalized and color coded from blue (low overlap) to red (high overlap). Gray cells indicate absence of data from ENCODE. C: analysis of enrichment for intrinsic CRF-associated SNPs with genomic features via permutation testing in Genomic Association Tester software (GAT). The genomic features and tissues tested for feature overlap (where applicable) are represented on the y-axis. The x-axis displays the negative logarithm of the empirical P value observed from association testing based on 1,000 simulations. Points in the scatterplot are colored by the type of feature tested and sized by the fold change of observed vs. expected overlaps. D: top scoring expression quantitative trait loci (eQTL) across tissue categories. Genes with allele-dependent expression patterns are shown for 6 tissue categories which are aggregated over 16 different tissues. For each gene, the negative logarithm of the most significant regression P values obtained from its eQTL SNPs are plotted with deeper shades of red indicating greater significance. E: SNPs displaying joint eQTL and histone-mark overlap properties. SNPs with joint behavior in at least 1 tissue were selected. eQTL and histone-site overlap results are shown side-by-side for each tissue in columns. A positive association is indicated in gray. F: overlap of SNPs with transcription factor binding sites (TFBS) predicted by SNP2TFBS tool. The %change in position weight matrix scores relative to the reference allele is shown on the x-axis, and SNPs, along with their nearest genes and their genomic annotation, are indicated on the y-axis. Plot is restricted to SNPs that 1) overlap a predicted TFBS with a high binding score (P < 3 × 10−06) in at least 1 of the two alleles, and 2) overlap a modified histone binding site and/or function as an eQTL.
Fig. 3.
Fig. 3.
Continued
Fig. 3.
Fig. 3.
Continued
Fig. 4.
Fig. 4.
Analysis of genetic associations on genome-scale tissue networks. A: distribution of network connectivity to intrinsic cardiorespiratory fitness (CRF)-associated genes in tissue-specific gene networks. A NetWAS analysis was conducted to estimate the extent of connectivity of all genes to intrinsic CRF-associated genes (Pascal P < 0.01) in tissue-specific interactomes obtained from Genome-scale Integrated Analysis of gene Networks in Tissues (GIANT; giant.princeton.edu). The distribution of the connectivity scores (NetWAS score) for all genes across 44 selected tissues are shown as boxplots. Tissues with greater connectivities involving intrinsic CRF-associated genes tend to have higher median scores. B: analysis of a skeletal muscle sub-network centered on intrinsic CRF-associated genes. The top connected genes from the skeletal muscle NetWAS analysis (NetWAS score ≥ 0.3) were extracted, and the network structure around the intrinsic CRF-associated genes were visualized. The genome-wide association study (GWAS)-associated genes are shown as boxes, whereas genes interacting with them (but not nominally GWAS-associated, P > 0.01) are shown as circles. Genes are color coded by the negative logarithm of their GWAS-association P values, with deeper shades of green indicating stronger associations. Additionally, the node size is proportional to the gene NetWAS score, and edge width is proportional to the posterior probability of network connectivity as determined in GIANT. C: pathway overrepresentation analysis among the skeletal muscle gene subnetworks shown in B. The sets of genes interacting with each GWAS-associated hub gene (EED, SSB, PICALM, and TIMM8B) were separately queried for enrichment of biological function via DAVID. The top 5 enriched Gene Ontology pathways among each hub gene neighbors are depicted as a heatmap. Tissue-specific hub gene subnetworks are indicated in columns and significant pathways in rows. Heatmap is color coded according to the negative logarithm of the significance of pathway enrichment (deeper red indicates greater significance).
Fig. 4.
Fig. 4.
Continued
Fig. 5.
Fig. 5.
Pathway enrichment analysis of intrinsic cardiorespiratory fitness (CRF)-associated genes. A: hierarchical clustering of common pathways found to be significantly enriched for intrinsic CRF-associated genes by iGSEA and Pascal. Pathways were clustered based on the shared number of significantly associated genes among pathways. Pathway significance levels from each tool (empirical P values) are indicated to the right. Pathways are color coded based on their similarities after cutting the dendrogram at 10 clusters. B: quantile-quantile plots for a subset of the significant pathways. For each pathway, the expected distribution of gene association P values are plotted on the x-axis and the observed distributions shown on the y-axis. Deviations from the diagonal indicate enrichment of significantly associated genes in a pathway.
Fig. 6.
Fig. 6.
Column 1, gene symbol; columns 2–27, different root phenotypes; column 28, total number of root phenotypes observed for each gene. For any root phenotype, number of observed subphenotypes is indicated in individual cells. Cardiovascular, hematopoietic, metabolic, and muscle-related root phenotypes are highlighted in gray.
Fig. 7.
Fig. 7.
Effect of candidate gene knockouts on phenotypes potentially relevant to cardiorespiratory fitness. Candidate intrinsic CRF-associated genes were used to query the Mouse Genome Informatics (MGI) database for phenotypes arising from targeted gene knockouts or gene trap models. Heatmaps show the reported individual phenotypes under four root phenotype categories (cardiovascular, hematopoietic, metabolic, and muscle) in gene knockouts. Phenotypes are indicated in rows and genes in columns. In each heatmap, genes displaying at least one knockout phenotype are considered. The presence of an association between a gene and a phenotype is indicated in magenta.
Fig. 8.
Fig. 8.
Association of gene expression with intrinsic cardiorespiratory fitness (CRF) levels in vastus lateralis muscle biopsies in a subset of the HERITAGE cohort. Partial regression residual leverage plots based on partial correlations of gene expression (y-axis) to intrinsic CRF levels (x-axis) after adjustments for age, sex, body mass index, and scan date are shown for four genes (CASQ2, EIF5B, PRADC1, and SLC38A1). Both gene expression and intrinsic CRF are plotted in the log2 scale for ease of interpretation. The dashed horizontal line corresponds to a gene expression partial residual = 0 and represents the model where the hypothesized value of gene expression is constrained to 0. The least squares line through the plotted points and its 95% confidence curves are shown. Significant effects are indicated when the confidence curve crosses the horizontal line.
Fig. 9.
Fig. 9.
Summary of bioinformatic and phenotypic analysis of intrinsic cardiorespiratory fitness (CRF) associated candidate genes. Genes are listed in rows and the various genetic and phenotypic evidence categories are listed in columns. Values in each column are derived from genetic or bioinformatic analysis. Column 1, gene name; column 2, gene-level genome-wide association study (GWAS) association P value from Pascal analysis; column 3, Data-driven Expression Prioritized Integration for Complex Traits (DEPICT)-predicted gene prioritization P value; column 4, best expression quantitative trait loci (eQTL) association P value observed for gene in any tissue tested; columns 5–8, DeepSea predicted difference in probabilities for major modified-histone binding (H3K4me1, H3K4me3, H3K9ac, and H3K27ac) between reference and alternate alleles; column 9, transcription factor binding sites (TFBS) predicted max. percent change in allele-dependent position weight matrix scores for any transcription factor; column 10, max. observed NetWAS score for gene across tissues; column 11, regression P value for muscle gene expression changes with intrinsic CRF for a subset of HERITAGE cohort (no Affymetrix probe mapped to NOTO gene); Column 12, relative ranking of genes based on ICVWRG method described in the text; and columns 13–18, presence of a root phenotype effect for gene knockout in mouse models. CRF relevant root phenotypes are shown in red, other phenotypes in blue, and absence of mouse phenotype data is shown in green.
Fig. 10.
Fig. 10.
A: association of CASQ2 single-nucleotide polymorphism (SNP) rs7523715 genotype with cardiovascular traits measured during submaximal (left) and maximal (right) exercise. B: association of CASQ2 SNP rs2999460 genotype with muscle-related traits measured in a subset of the HERITAGE cohort. Adjusted mean trait values shown for each genotype after adjustment for age, sex, and body mass index. P value for the main effect of genotype on each trait is shown at the top of each graph. Number of subjects with each genotype is indicated inside each histogram bar.
Fig. 11.
Fig. 11.
Association of skeletal muscle CASQ2 gene expression to selected muscle-related traits in a subset of the HERITAGE cohort. Partial regression residual leverage plots were constructed for selected muscle trait values (x-axis) against CASQ2 gene expression from muscle biopsies (log2 transformed, y-axis), after adjustments for age, sex, body mass index, and scan date. In all plots, the least squares line through the plotted points and its 95% confidence curves are shown. Significant effects are indicated when the confidence curve crosses the horizontal line. A: regression of CASQ2 expression to muscle fiber-related phenotypes: %FT1, %type 1 fibers; %FT2A, %type 2A fibers; %FT2B, %type 2B fibers; %AR1, type 1 percentage area; %AR2A, type 2A percentage area; %AR2B, type 2B percentage area; CAP1M, capillary per fiber type 1 mean; CAP2AM, capillary per fiber type 2A mean; CAP2BM, capillary per fiber type 2B mean. B: regression of CASQ2 expression on muscle enzyme activities (all reported as units/g): COX, cytochrome oxidase; CS, citrate synthase; HADH, hydroxyacyl-CoA dehydrogenase; PFK, phosphofructokinase.
Fig. 11.
Fig. 11.
Continued

Similar articles

Cited by

References

    1. Albert FW, Kruglyak L. The role of regulatory variation in complex traits and disease. Nat Rev Genet 16: 197–212, 2015. doi:10.1038/nrg3891. - DOI - PubMed
    1. Bassett DR Jr, Howley ET. Limiting factors for maximum oxygen uptake and determinants of endurance performance. Med Sci Sports Exerc 32: 70–84, 2000. doi:10.1097/00005768-200001000-00012. - DOI - PubMed
    1. Bernstein BE, Stamatoyannopoulos JA, Costello JF, Ren B, Milosavljevic A, Meissner A, Kellis M, Marra MA, Beaudet AL, Ecker JR, Farnham PJ, Hirst M, Lander ES, Mikkelsen TS, Thomson JA. The NIH Roadmap Epigenomics Mapping Consortium. Nat Biotechnol 28: 1045–1048, 2010. doi:10.1038/nbt1010-1045. - DOI - PMC - PubMed
    1. Blair SN, Kampert JB, Kohl HW 3rd, Barlow CE, Macera CA, Paffenbarger RS Jr, Gibbons LW. Influences of cardiorespiratory fitness and other precursors on cardiovascular disease and all-cause mortality in men and women. JAMA 276: 205–210, 1996. doi:10.1001/jama.1996.03540030039029. - DOI - PubMed
    1. Bolstad BM, Irizarry RA, Astrand M, Speed TP. A comparison of normalization methods for high density oligonucleotide array data based on variance and bias. Bioinformatics 19: 185–193, 2003. doi:10.1093/bioinformatics/19.2.185. - DOI - PubMed

Publication types

LinkOut - more resources