. 2019 Jan 3;15(1):e1007427.
doi: 10.1371/journal.ppat.1007427. eCollection 2019 Jan.

IgA tetramerization improves target breadth but not peak potency of functionality of anti-influenza virus broadly neutralizing antibody

Affiliations

IgA tetramerization improves target breadth but not peak potency of functionality of anti-influenza virus broadly neutralizing antibody

Shinji Saito et al. PLoS Pathog. .

Abstract

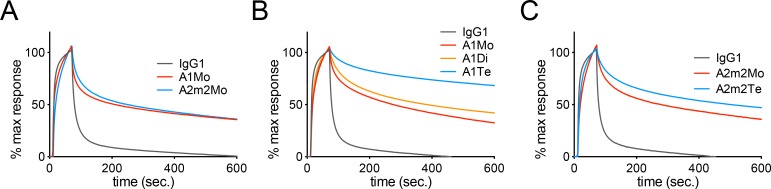
Mucosal immunoglobulins comprise mainly secretory IgA antibodies (SIgAs), which are the major contributor to pathogen-specific immune responses in mucosal tissues. These SIgAs are highly heterogeneous in terms of their quaternary structure. A recent report shows that the polymerization status of SIgA defines their functionality in the human upper respiratory mucosa. Higher order polymerization of SIgA (i.e., tetramers) leads to a marked increase in neutralizing activity against influenza viruses. However, the precise molecular mechanisms underlying the effects of SIgA polymerization remain elusive. Here, we developed a method for generating recombinant tetrameric monoclonal SIgAs. We then compared the anti-viral activities of these tetrameric SIgAs, which possessed variable regions identical to that of a broadly neutralizing anti-influenza antibody F045-092 against influenza A viruses, with that of monomeric IgG or IgA. The tetrameric SIgA showed anti-viral inhibitory activity superior to that of other forms only when the antibody exhibits low-affinity binding to the target. By contrast, SIgA tetramerization did not substantially modify anti-viral activity against targets with high-affinity binding. Taken together, the data suggest that tetramerization of SIgA improved target breadth, but not peak potency of antiviral functions of the broadly neutralizing anti-influenza antibody. This phenomenon presumably represents one of the mechanisms by which SIgAs present in human respiratory mucosa prevent infection by antigen-drifted influenza viruses. Understanding the mechanisms involved in cross neutralization of viruses by SIgAs might facilitate the development of vaccine strategies against viral infection of mucosal tissues.


Conflict of interest statement

National Institute of Infectious Diseases and Nippi, Inc. have filed patents regarding construction and use of tetrameric SIgA (application no. PCT/JP2015/070742). SS, TS, AA, YT, TU, KOG and HH are named as inventors on the application. YT, TU, and KOG are employees of Nippi, Inc.

Figures

Fig 1
Fig 1. Production of recombinant tetrameric monoclonal SIgAs.
(A) Recombinant monoclonal IgA antibodies purified from the culture supernatant of cells co-transfected with A1+L (left upper), A1+L+J (left lower), A1+L+J+SC (right upper), or A2m2+L+J+SC (right lower), were subjected to size exclusion chromatography (SEC) analysis. A chromatogram showing absorbance at 280 nm revealed three major peaks: peak A (retention volume around 10.4 ml), peak B (retention volume around 9.3 ml), and peak C (retention volume around 8.4 ml). Data are representative of three independent experiments. (B) SDS-PAGE and BN-PAGE analysis of IgG and IgA1/IgA2m2 in each peak fraction (peak A, B, and C) purified from cells co-expressing SC (A1+L+J+SC or A2m2+L+J+SC). (C, D, E) High-mass MALDI-TOF MS analysis of the each peak fraction containing recombinant IgA1 purified from the culture supernatant of cells transfected with A1, L, J, and SC. (C) One main peak (arrow) corresponding to monomer (Mo) was detected in the peak A fraction. (D) Two main peaks (arrows) corresponding to a dimer (Di) and a di-cation dimer (Di2+) were detected in the peak B fraction. (E) Three main peaks (arrows) corresponding to a tetramer (Te), trimer (Tr), and di-cation tetramer (Te2+) were detected in the peak C fraction. (F, G) High-mass MALDI-TOF MS analysis of the each peak fraction of recombinant IgA2m2 purified from the culture supernatant from cells transfected with A2m2, L, J, and SC. (F) One main peak (arrow) corresponding to a monomer (Mo) was detected in the peak A fraction. (G) Three main peaks (arrows) corresponding to a tetramer (Te), a trimer (Tr), and a di-cation tetramer (Te2+) were detected in the peak C fraction. (H) Quantification of the amount of each subunit within the peak B or C fraction of recombinant SIgA1 or SIgA2m2 antibodies purified from the culture supernatant of cells transfected with A1/L/J,/SC or A2m2/L/J/SC using LC-MS with stable isotope-labeled standard peptides. The abundance of each subunit to that of J chain is expressed as a ratio. Data are expressed as box-and-whisker plot with minimum, maximum, median, upper and lower quartiles (n = 6–7). (I) HS-AFM image of peak C derived from a recombinant SIgA1 (A1Te) or SIgA2m2 (A2m2Te) antibody purified from the culture supernatant of cells transfected with A1/L/J/SC or A2m2/L/J/SC. Scale bar, 20 nm.
Fig 2
Fig 2. Reactivity of F045-092 bnAb against influenza A viruses on IgA backbones with or without polymerization.
(A) Reactivity of monomeric (red, A1Mo), dimeric (orange, A1Di), and tetrameric (blue, A1Te) F045-092 IgA1 antibodies against recombinant HA proteins from A/Sydney/05/97 (H3N2; Syd05), A/New York/55/2004 (H3N2; NY55), A/New York/39/2012 (H3N2; NY39), A/Victoria/210/2009 (H3N2; Vic210), A/Victoria/361/2011 (H3N2; Vic361), A/New Caledonia/20/99 (H1N1; NC20), A/Japan/305/2957 (H2N2, JP305), and A/Indonesia/5/2005 (H5N1, Ind05) viruses. Data are expressed as the mean ± SD of three technical replicates. (B) Area under the reactivity curve (AUC) for each IgA1 antibody (A1Mo, A1Di, and A1Te) tested against each HA. The AUC was calculated from the plots in (A). Data are expressed as the mean ± SD of three technical replicates. (C) Reactivity of monomeric (red, A2m2Mo) and tetrameric (blue, A2m2Te) F045-092 IgA2m2 antibodies against recombinant HA proteins from Syd05, NY55, NY39, Vic210, Vic361, NC20, JP305, and Ind05 viruses. Data are expressed as the mean ± SD of three technical replicates. (D) AUC for the IgA2m2 antibody (A2m2Mo, and A2m2Te) tested against each HA. The AUC was calculated from the plots in (C). Data are expressed as the mean ± SD of three technical replicates. *p<0.05, **p<0.01, ***p<0.001, and ****p<0.0001 (unpaired Student t-test or one-way ANOVA followed by Tukey’s multiple comparison test).
Fig 3
Fig 3. Binding dynamics analysis of IgG and IgA antibodies by surface plasmon resonance (SPR) analysis.
(A) F045-092 IgG1 (black), monomeric IgA1 (red, A1Mo), and monomeric IgA2m2 (blue, A2m2Mo) antibodies were subjected to SPR analysis of their binding dynamics to the recombinant trimeric HA proteins from JP305 virus (H2N2). (B) Binding dynamics of F045-092 IgG1 (black), monomeric IgA1 (red, A1Mo), dimeric SIgA1 (orange, A1Di), and tetrameric SIgA1 (blue, A1Te) antibodies to the recombinant trimeric HA proteins from JP305 virus (H2N2) were examined. (C) Binding dynamics of F045-092 IgG1 (black), monomeric IgA2m2 (red, A2m2Mo), and tetrameric SIgA2m2 (blue, A2m2Te) antibodies to the recombinant trimeric HA proteins from JP305 virus (H2N2) were examined. Sensorgrams were x and y-axis adjusted (x = 0, y = 0: baseline, y = 100:binding) to allow comparisons between different antibody forms in terms of the dissociation rate of IgA from HA.
Fig 4
Fig 4. Hemagglutinin inhibition and neutralizing activities of F045-092 on IgG and IgA, with or without polymerization.
(A–H) HI activity of F045-092 IgG1, monomeric (Mo) IgA1, dimeric (Di) SIgA1, tetrameric (Te) SIgA1, monomeric (Mo) IgA2m2, tetrameric (Te) SIgA2m2 against Syd05 (A), NY55 (B), NY39 (C), Vic210 (D), Vic361 (E), NC20 (F), JP305 (G), or Ind05 (H) viruses. HI activity is shown on scatter plots as the geometric mean (with 95% confidence intervals) of the reciprocal of the lowest concentration (μg/ml) of antibody that inhibited hemagglutination of the virus (n = 4 for H3 viruses, n = 6 for JP305 and Ind05 viruses, and n = 9 for NC20 virus). (I–P) NT activity of F045-092 IgG1, monomeric (Mo) IgA1, dimeric (Di) SIgA1, tetrameric (Te) SIgA1, monomeric (Mo) IgA2m2, and tetrameric (Te) SIgA2m2 against Syd05 (I), NY55 (J), NY39 (K), Vic210 (L), Vic361 (M), NC20 (N), JP305 (O), or Ind05 (P) viruses. NT activity is expressed on scatter plots as the geometric mean (with 95% confidence intervals) of the reciprocal of the lowest concentration (μg/ml) of antibody that neutralized the virus (n = 4 for H3 viruses, n = 6 for JP305 and Ind05 viruses, and n = 9 for NC20 virus). The dotted line in the graph represents the detection limit (DL) of each experiment. Half of the detection limit value was applied to samples with titers below the detection limit for statistical analyses. *p<0.05, **p<0.01, ***p<0.001, and ****p<0.0001 (compared with IgG; Kruskal-Wallis test followed by Dunn’s multiple comparison test).
Fig 5
Fig 5. Relationship between increased functionality and reactivity of polymerized SIgA.
(A–F) Line graphs depict the relationship between hemagglutinin inhibition (A–C) or neutralizing (D–F) activity of IgG1 (gray dotted line in A–F), monomeric IgA1 (A1Mo; red line in A, B, D and E), dimeric SIgA1 (A1Di; orange line in A and D), tetrameric SIgA1 (A1Te; blue line in B and E), monomeric IgA2m2 (A2m2Mo; red line in C and F), and tetrameric SIgA2m2 (A2m2Te; blue line in C and F) and reactivity against each virus HA. The HI and NT activity against Syd05, NY55, NY39, Vic210, Vic361, and NC20 viruses, against which F045-092 possessed both HI and NT activity at IgG1 state as shown in Fig 4, are integrated into the graphs. The Y-axis shows HI or NT activity and the X-axis shows the reactivity value, expressed as the geometric mean of the reciprocal of the lowest concentration (μg/ml) of F045-092 IgG1 that binds to each viral HA. Vertical dotted lines denote the reactivity value against the virus indicated below the X-axis. The each symbol on the vertical dotted line represents the geometric mean (with 95% confidence intervals) of the HI or NT activity against the virus indicated below the X-axis. *p<0.05, **p<0.01, ***p<0.001, and ****p<0.0001 (compared with monomeric IgA; Holm-Sidak t-test). (G–I) The line graphs depict the relationship between reactivity (determined by the IgG1 backbone) against each viral HA protein and the ratio of reactivity (orange line), HI activity (red line), or NT (blue line) activity of A1Di (G), A1Te (H), or A2m2Te (I) to that of monomeric IgA (A1Di/A1Mo, A1Te/A1Mo, or A2m2Te/A2m2Mo). The X-axis shows the reactivity value, expressed as the geometric mean of the reciprocal of the lowest concentration (μg/ml) of F045-092 IgG1 that bound to each viral HA protein. Vertical dotted lines show reactivity against the virus indicated below the X-axis. Each symbol on the vertical dotted line represents the mean ± SEM. *p<0.05, **p<0.01, ***p<0.001, and ****p<0.0001 (functional activity of antibodies against each virus compared with that against the Syd05 virus; two-way ANOVA followed by Dunnett's multiple comparison test). (J) Increase of reactivity, HI, and NT activity against NC20 virus induced by SIgA1 dimerization, SIgA1 tetramerization, and SIgA2m2 tetramerization. Data are expressed as the mean ± SD. ****p<0.0001 (two-way ANOVA followed by Tukey's multiple comparisons test). (K) A hypothesis-explanatory drawing illustrating the effect of SIgA polymerization on antibody function. Polymerization of both IgA subclasses increased anti-viral activity against influenza A viruses. Increased the anti-viral activity emerged strikingly to the viruses with low-affinity binding resulting in increased breadth, but not peak potency, of the anti-viral activity of antibody.

Similar articles

Cited by

References

    1. Pabst O. New concepts in the generation and functions of IgA. Nat Rev Immunol. 2012;12(12):821–32. 10.1038/nri3322 - DOI - PubMed
    1. Macpherson AJ, McCoy KD, Johansen F-E, Brandtzaeg P. The immune geography of IgA induction and function. Mucosal Immunol. 2008;1(1):11–22. 10.1038/mi.2007.6 - DOI - PubMed
    1. Suzuki T, Ainai A, Hasegawa H. Functional and structural characteristics of secretory IgA antibodies elicited by mucosal vaccines against influenza virus. Vaccine. 2017;35(39):5297–302. 10.1016/j.vaccine.2017.07.093 - DOI - PubMed
    1. Sano K, Ainai A, Suzuki T, Hasegawa H. The road to a more effective influenza vaccine: Up to date studies and future prospects. Vaccine. 2017;35(40):5388–95. 10.1016/j.vaccine.2017.08.034 - DOI - PubMed
    1. Woof JM, Russell MW. Structure and function relationships in IgA. Mucosal Immunol. 2011;4(6):590–7. 10.1038/mi.2011.39 - DOI - PubMed

Publication types

MeSH terms