. 2019 Mar 18;47(5):2630-2640.
doi: 10.1093/nar/gky1293.

Bias-minimized quantification of microRNA reveals widespread alternative processing and 3' end modification

Affiliations

Bias-minimized quantification of microRNA reveals widespread alternative processing and 3' end modification

Haedong Kim et al. Nucleic Acids Res. .

Erratum in

Abstract

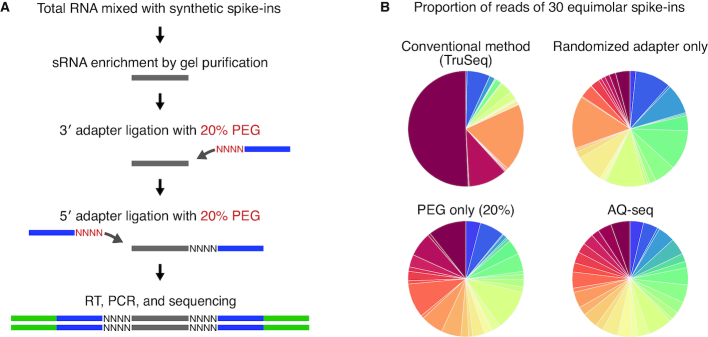
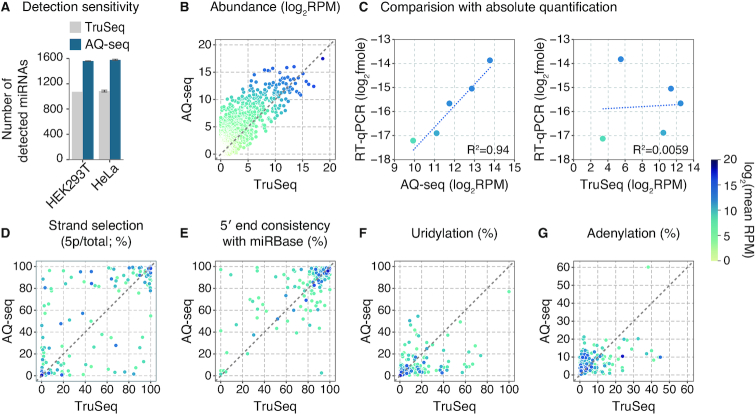
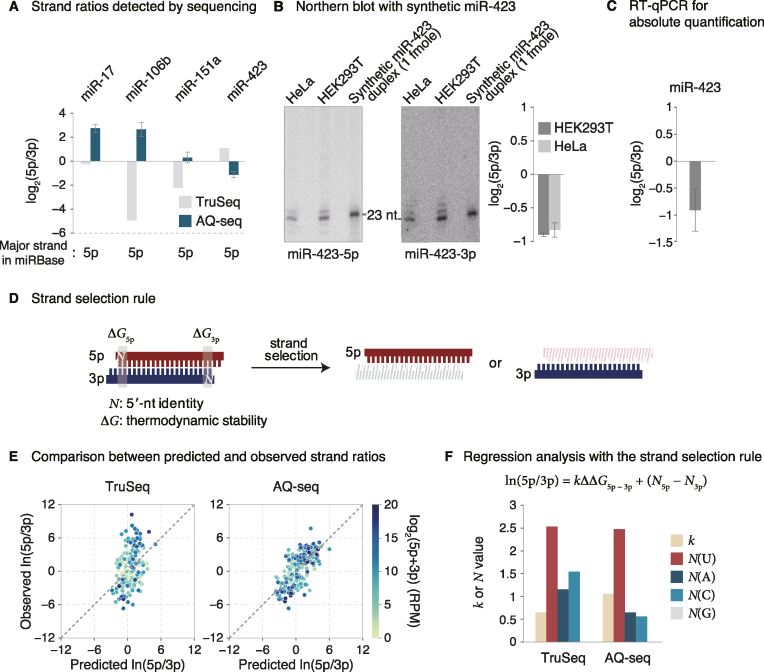
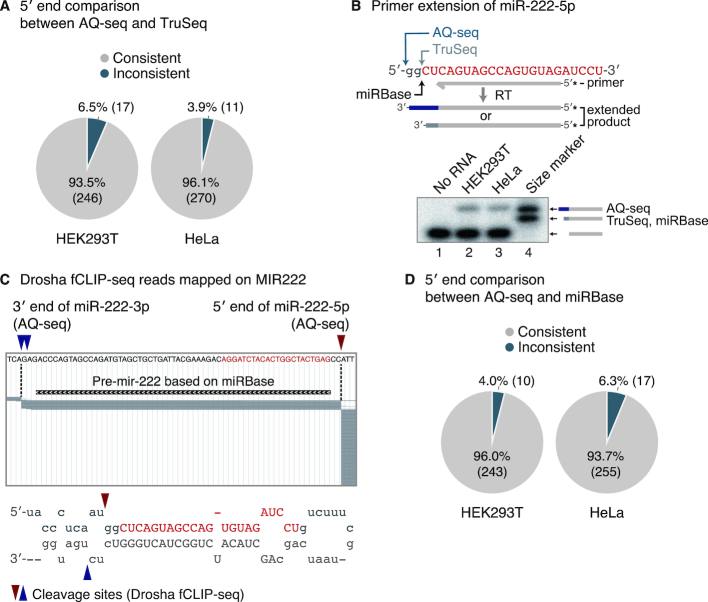
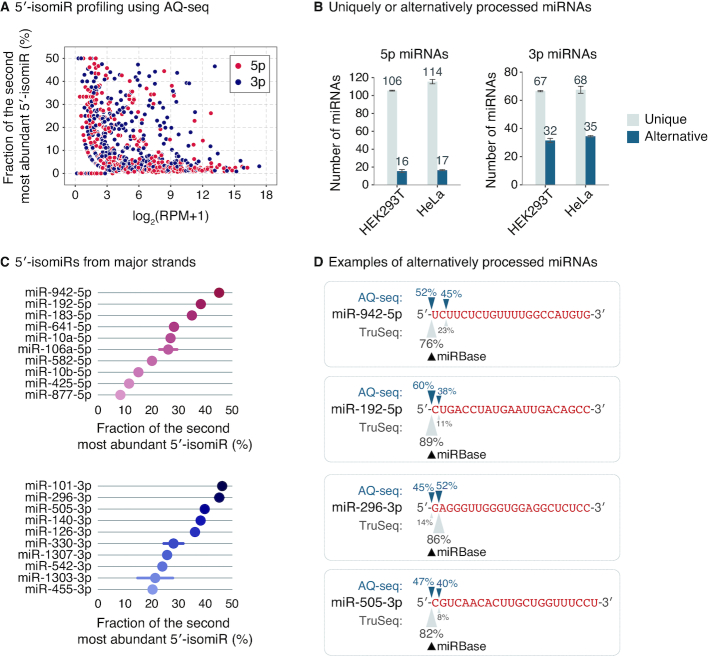
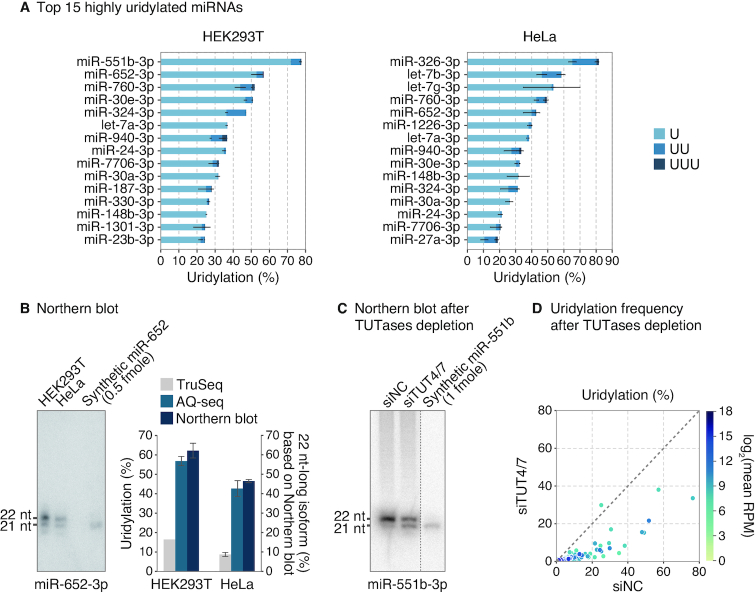
MicroRNAs (miRNAs) modulate diverse biological and pathological processes via post-transcriptional gene silencing. High-throughput small RNA sequencing (sRNA-seq) has been widely adopted to investigate the functions and regulatory mechanisms of miRNAs. However, accurate quantification of miRNAs has been limited owing to the severe ligation bias in conventional sRNA-seq methods. Here, we quantify miRNAs and their variants (known as isomiRs) by an improved sRNA-seq protocol, termed AQ-seq (accurate quantification by sequencing), that utilizes adapters with terminal degenerate sequences and a high concentration of polyethylene glycol (PEG), which minimize the ligation bias during library preparation. Measurement using AQ-seq allows us to correct the previously misannotated 5' end usage and strand preference in public databases. Importantly, the analysis of 5' terminal heterogeneity reveals widespread alternative processing events which have been underestimated. We also identify highly uridylated miRNAs originating from the 3p strands, indicating regulations mediated by terminal uridylyl transferases at the pre-miRNA stage. Taken together, our study reveals the complexity of the miRNA isoform landscape, allowing us to refine miRNA annotation and to advance our understanding of miRNA regulation. Furthermore, AQ-seq can be adopted to improve other ligation-based sequencing methods including crosslinking-immunoprecipitation-sequencing (CLIP-seq) and ribosome profiling (Ribo-seq).


Figures

Figure 1.
Figure 1.
Small RNA sequencing optimization using spike-ins. (A) Schematic outline of AQ-seq library preparation method. (B) Proportion of 30 spike-ins detected by the indicated protocols.
Figure 2.
Figure 2.
miRNA and isomiR profiles uncovered by AQ-seq. (A–G) Comparison of miRNA and isomiR profiles between AQ-seq and TruSeq in HEK293T cells. Abundant miRNAs (>100 RPM in AQ-seq or TruSeq) were included in each analysis, unless otherwise indicated. RPM, reads per million. (A) The number of detected miRNAs in the indicated methods. No abundance filter was applied. Bars indicate mean ± standard deviations (s.d.) (n = 2). (B) Expression profiles. No abundance filter was applied. (C) Comparison between sequencing results and absolute quantities for five miRNAs. The absolute expression levels of the miRNAs were calculated based on the standard curves in Supplementary Figure S2B. (D) The proportion of the 5p strand for a given miRNA calculated by [5p]/([5p]+[3p]), where brackets mean read counts. (E) The proportion of reads whose 5′ end starts at the position as annotated in miRBase for a given miRNA (45). (F and G) Terminal modification frequencies by uridylation (F) or adenylation (G). All terminally modified reads were counted regardless of the tail length.
Figure 3.
Figure 3.
Re-assessment of strand preference. (A) Log2-transformed 5p/3p ratios obtained from TruSeq and AQ-seq in HEK293T cells. Dominant arms annotated in miRBase are denoted at the bottom. Bars indicate mean ± standard deviations (s.d.) (n = 2). (B) Northern blot of miR-423-5p and miR-423-3p. Left and middle: Total RNAs from HeLa and HEK293T cells were used for miRNA detection. Synthetic miR-423 duplex was loaded for normalization. Right: A bar plot representing log2-transformed 5p/3p ratio calculated from band intensities of Northern blot shows that the 3p is the major strand, consistent with AQ-seq data. Bars indicate mean ± standard deviations (s.d.) (n = 2). (C) Log2-transformed strand ratio of miR-423 obtained from RT-qPCR-based absolute quantification in HEK293T cells. (D) Two main end properties that determine which strand will be selected: 5′ end identity (N5p(3p)) and thermodynamic stability (ΔG5p(3p)). (E) Comparison of strand ratios between those predicted by the model and those obtained from TruSeq (left panel) or AQ-seq (right panel) in HEK293T cells. See Materials and Methods for details. RPM, reads per million. (F) Linear regression analysis with the indicated equation for strand selection of miRNAs. Bars represent values of the indicated parameters obtained from the model fitted to either TruSeq or AQ-seq data from HEK293T cells.
Figure 4.
Figure 4.
Correction of the 5′ end annotation. (A) Comparison of miRNA 5′ ends between AQ-seq and TruSeq. The predominant end for a given miRNA among abundant miRNAs (>100 RPM in AQ-seq or TruSeq) was analyzed. RPM, reads per million. (B) Primer extension of miR-222-5p. Identified 5′ ends of miR-222-5p from two sRNA-seq data (AQ-seq and TruSeq) and miRBase are indicated with arrows. The sequence of miR-222-5p deposited in miRBase is colored in red with uppercase. Synthesized oligonucleotides complementary to miR-222-5p with or without 2 nt-extended 5′ end were used as size references. Asterisks mark radiolabeled terminal phosphates. (C) Identification of Drosha cleavage sites of pri-mir-222 using Drosha fCLIP-seq. Top: ∼5.6% of reads mapped on the MIR222 locus were randomly sampled and are denoted as gray bars. The 5′ end of miR-222-5p and the 3′ end of miR-222-3p detected by AQ-seq are indicated with red and blue arrowheads, respectively. Pre-mir-222 is marked as a black bar according to the miRBase-annotated 5′ end of miR-222-5p and the 3′ end of miR-222-3p. Bottom: The stem-loop structure of pri-mir-222. The 5′ and 3′ cleavage sites are indicated with red and blue arrowheads, respectively. The genomic locus and the sequence of miR-222-5p registered in miRBase are colored in red. The uppercase letters represent the sequences of both miR-222-5p and miR-222-3p in miRBase. (D) Comparison of miRNA 5′ ends between AQ-seq and miRBase. Abundant miRNAs (>100 RPM in AQ-seq) with 5′ ends consistently identified in replicates were included in this analysis.
Figure 5.
Figure 5.
Widespread alternative processing. (A) The fraction of the second most abundant 5′-isomiR for a given miRNA calculated by AQ-seq in HEK293T cells. Since the 5′ ends of 5p and 3p strands are processed by Drosha and Dicer, respectively, they were separately analyzed. RPM, reads per million. (B) The number of miRNAs with unique or alternative 5′ ends. Abundant miRNAs (>100 RPM in AQ-seq) were included in this analysis. If more than two 5′ ends of a given miRNA were detected and each of them accounted for >10% of total reads, the miRNA was considered as an alternatively processed miRNA. Otherwise, the miRNA was considered as a uniquely processed miRNA. Bars indicate mean ± standard deviations (s.d.) (n = 2). (C) Top 10 alternatively processed major strands (>100 RPM in AQ-seq) in HEK293T cells. Bars indicate mean ± standard deviations (s.d.) (n = 2). (D) Illustration of 5′ end usage of four alternatively processed miRNAs. The proportion of sequencing reads with the indicated 5′ end from HEK293T cells is denoted. The sequences of each miRNA deposited in miRBase are colored in red with uppercase.
Figure 6.
Figure 6.
Highly uridylated miRNAs. (A) Top 15 highly uridylated miRNAs among abundant miRNAs (>100 RPM in AQ-seq) in HEK293T and HeLa cells. The type of U-tail is indicated with different color. Light blue, blue, and navy refer to mono-uridylation (U), di-uridylation (UU), and tri-uridylation (UUU), respectively. Bars indicate mean ± standard deviations (s.d.) (n = 2). RPM, reads per million. (B) Northern blot of miR-652-3p detected in the indicated cell lines (left panel). Synthetic miR-652 duplex was loaded as a control. The proportion of the elongated isoform was quantified and compared to uridylation frequencies from TruSeq and AQ-seq (right panel). Bars indicate mean ± standard deviations (s.d.) (n = 2). (C) Northern blot of miR-551b-3p. The miRNA was detected 96 h after transfection of indicated siRNAs in HEK293T cells. Synthetic miR-551b duplex was loaded as a control. (D) Uridylation frequencies calculated by AQ-seq after knockdown of TUT4 and TUT7 in HEK293T cells. Abundant miRNAs (>100 RPM) in the siNC-transfected sample were included in the analysis.

References

    1. Bartel D.P. Metazoan MicroRNAs. Cell. 2018; 173:20–51. - PMC - PubMed
    1. Ha M., Kim V.N.. Regulation of microRNA biogenesis. Nat. Rev. Mol. Cell Biol. 2014; 15:509–524. - PubMed
    1. Lee Y., Ahn C., Han J., Choi H., Kim J., Yim J., Lee J., Provost P., Radmark O., Kim S. et al. .. The nuclear RNase III Drosha initiates microRNA processing. Nature. 2003; 425:415–419. - PubMed
    1. Denli A.M., Tops B.B., Plasterk R.H., Ketting R.F., Hannon G.J.. Processing of primary microRNAs by the microprocessor complex. Nature. 2004; 432:231–235. - PubMed
    1. Gregory R.I., Yan K.P., Amuthan G., Chendrimada T., Doratotaj B., Cooch N., Shiekhattar R.. The Microprocessor complex mediates the genesis of microRNAs. Nature. 2004; 432:235–240. - PubMed

Publication types

MeSH terms