. 2019 Jan 2;26(1):159-167.e6.
doi: 10.1016/j.celrep.2018.12.040.

Topological Organization of Ventral Tegmental Area Connectivity Revealed by Viral-Genetic Dissection of Input-Output Relations

Affiliations

Topological Organization of Ventral Tegmental Area Connectivity Revealed by Viral-Genetic Dissection of Input-Output Relations

Kevin T Beier et al. Cell Rep. .

Abstract

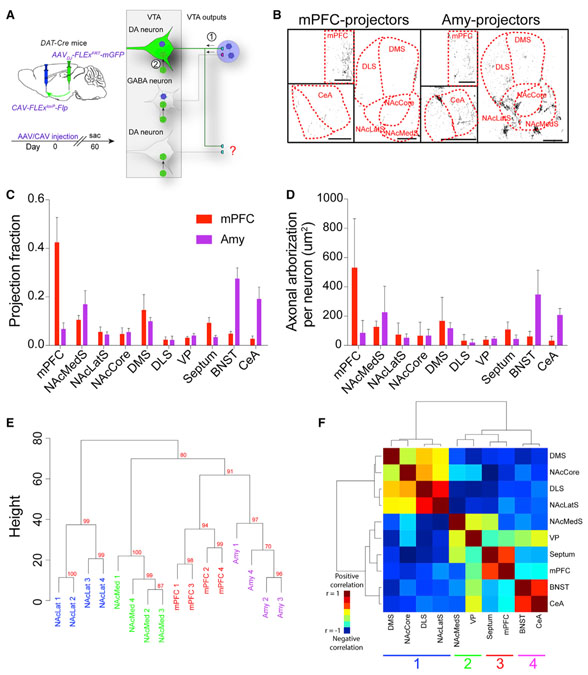
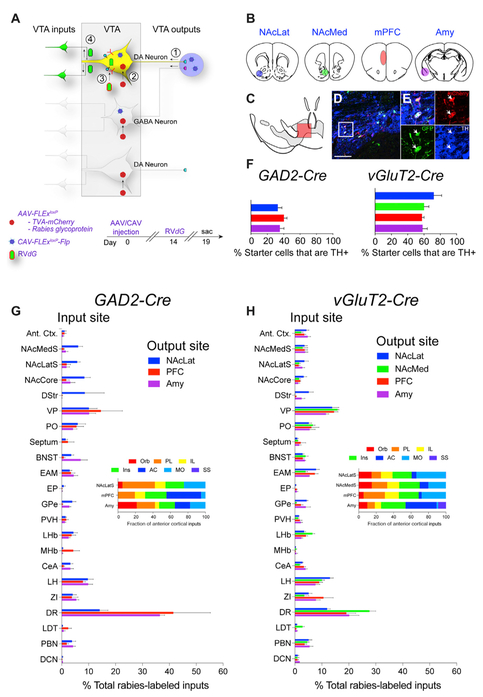
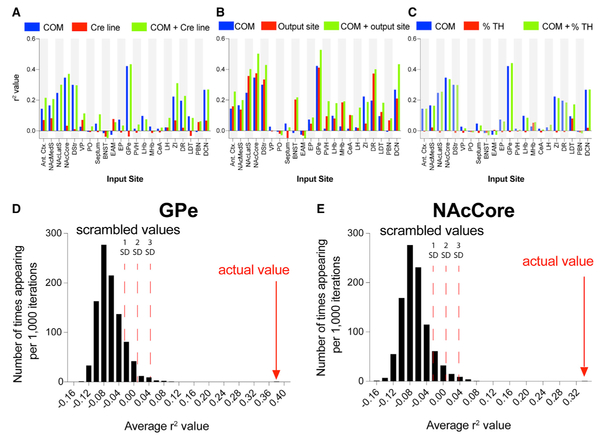
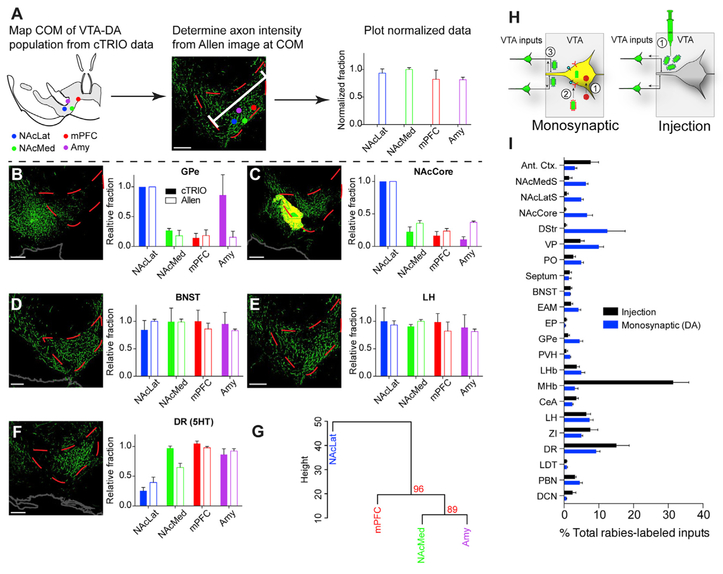
Viral-genetic tracing techniques have enabled mesoscale mapping of neuronal connectivity by teasing apart inputs to defined neuronal populations in regions with heterogeneous cell types. We previously observed input biases to output-defined ventral tegmental area dopamine (VTA-DA) neurons. Here, we further dissect connectivity in the VTA by defining input-output relations of neurochemically and output-defined neuronal populations. By expanding our analysis to include input patterns to subtypes of excitatory (vGluT2-expressing) or inhibitory (GAD2-expressing) populations, we find that the output site, rather than neurochemical phenotype, correlates with whole-brain inputs of each subpopulation. Lastly, we find that biases in input maps to different VTA neurons can be generated using publicly available whole-brain output mapping datasets. Our comprehensive dataset and detailed spatial analysis suggest that connection specificity in the VTA is largely a function of the spatial location of the cells within the VTA.

Keywords: cell-type specificity; circuit mapping; connectivity analysis; dopamine; input mapping; input-output relations; output mapping; rabies monosynaptic tracing; ventral tegmental area; viral-genetic methods.


Conflict of interest statement

DECLARATION OF INTERESTS

The authors declare no competing interests.

Figures

Figure 1.
Figure 1.. Axon Collateralization Patterns from VTA-DA Subpopulations
(A) Experimental schematic. CAV-FLExloxP-Flp was injected into either the mPFC or Amy, and an Flp-dependent AAV-expressing mGFP was injected into the VTA of DAT-Cre mice. Axons were imaged throughout the brain. (B) Sample images of projections from VTA-DA subpopulations targeted by mPFC and Amy injections. Scale bar, 500 mm. (C) Projection fraction of each subtype to ten different brain regions. (D) Average axonal arborization per labeled VTA-DA neuron in each brain region. (E) Hierarchical clustering and bootstrapping based on outputs. Each sample segregates by targeted output site. The approximately unbiased (AU) p value was calculated and is shown in red for each branch. An AU p value higher than 95% indicates that the cluster is highly supported by the data. (F) Covariance analysis of the ten quantified output sites using data from each of the four targeted VTA-DA subpopulations here and in Beier et al. (2015). There are four distinct clusters which correspond to the different VTA-DA subpopulations. mPFC n = 5; Amy n = 4. Error bars, SEM. See Figure S1 for related data.
Figure 2.
Figure 2.. Tracing Inputs to VTA-GABA and VTA-vGluT2 Neurons Defined by Output Site
(A) cTRIO schematic. CAV-FLExloxP-Flp was injected into an output site of VTA neurons, and Flp-dependent AAVs expressing TC and G were injected into the VTA, followed 2 weeks later by RVdG. (B) The four output sites targeted with CAVFLExloxP-Flp injection were NAcLat, NAcMed, mPFC, and Amy. (C) Schematic midbrain image showing location of cells shown in (D) and (E). (D and E) Sample image of TH co-localization at low (D) and high (E) magnification from a cTRIO experiment in a vGluT2-Cre animal; output site = NAcMedS. Scale bar, 150 μm. (F) Percentage of starter cells co-staining with TH for GAD2-Cre and vGluT2-Cre cTRIO experiments. (G and H) Whole-brain input patterns from GAD2-Cre (G) or vGluT2-Cre (H) cTRIO experiments are shown. n = 4 for each condition. Insets show the fraction of anterior cortical inputs from the seven quantified cortical subregions. n = 4 for all conditions. Error bars, SEM. See Figures S2, S3, and S4 for related data.
Figure 3.
Figure 3.. Statistical Analysis of Input Biases to VTA Neurons
(A) Linear regression between the percentage of total rabies-labeled inputs from each of the 22 input sites for each animal (n = 76) and the starter cell COM, the mouse Cre driver line, or both the COM and the Cre driver line. (B) Similar regressions were performed like in (A), but inputs were run against the COM, output site, or both. (C) Regressions were run against the COM, the percentage of starter cells immunostaining for TH, or both. (D and E) A linear regression model was trained on a subset of the 76 brains and tested on the remainder of the dataset. An r2 value was calculated over 500 randomized training/testing set divisions and compared to control sets where the link between COM and inputs was scrambled. The obtained r2 value for the GPe (D) was 0.38 and was 0.33 for the NAcCore (E). Each graph shows 1, 2, and 3 SD from the mean in the positive direction. See Table S1 for related data.
Figure 4.
Figure 4.. Relating VTA-DA Inputs to Whole-Brain Output Tracing Datasets
(A) Schematic of experimental flow. Three representative images from the Allen Mouse Brain Connectivity Atlas were taken in the VTA for each of the 20 input sites analyzed. Each image contained GFP-labeled fibers from an AAV injection into a targeted brain site that projects to the VTA. The axon intensity of GFP+ fibers in the VTA was measured as a function of the dorsomedial-ventrolateral distance from the midline to the medial lemniscus through the VTA. The axon intensity value was obtained at the COM of each VTA-DA subpopulation that was calculated from published DAT-Cre cTRIO data (Beier et al., 2015). These data were normalized as a fraction of the maximum value among the VTA-DA subpopulations. (B–F) Inputs from each VTA-DA subpopulation (cTRIO) were compared to data generated using the publicly available output dataset from the Allen Mouse Brain Connectivity Atlas (Allen). Data from two inputs showing a lateral bias onto NAcLat-projecting VTA-DA neurons (B and C), two inputs showing no spatial bias (D and E), and one input showing a medial bias (F) are shown. (G) When results from axonal projections from each of the 20 quantified input sites were averaged and hierarchically clustered/bootstrapped, we observed that axon projection patterns to the COM of NAcMed-, mPFC-, and Amy-projecting VTA-DA neurons were more similar to one another than to NAcLat-projecting VTADA neurons, recapitulating our observation using cTRIO from these populations (Beier et al., 2015). The AU p value was calculated and is shown in red for each branch. (H) Experimental schematics comparing monosynaptic input tracing from VTA-DA neurons to bulk injection of RVdG+G to label neurons projecting to the VTA. (I) The monosynaptic spread of rabies from VTA-DA neurons labeled a different pattern of input as compared to direct injection of RVdG+G. n = 3 (A–G) and n = 4 (I) for both conditions. Scale bar, 200 mm (all panels). Error bars, SEM. All images in this figure were taken from the Allen Mouse Brain Connectivity Atlas (Oh et al., 2014). Image credit: Allen Institute for Brain Science. See Tables S2 and S3 for related data.

References

    1. Alivisatos AP, Chun M, Church GM, Greenspan RJ, Roukes ML, and Yuste R (2012). The brain activity map project and the challenge of functional connectomics. Neuron 74, 970–974. - PMC - PubMed
    1. Bäckman CM, Malik N, Zhang Y, Shan L, Grinberg A, Hoffer BJ, West-phal H, and Tomac AC (2006). Characterization of a mouse strain expressing Cre recombinase from the 3′ untranslated region of the dopamine transporter locus. Genesis 44, 383–390. - PubMed
    1. Beier KT, Steinberg EE, DeLoach KE, Xie S, Miyamichi K, Schwarz L, Gao XJ, Kremer EJ, Malenka RC, and Luo L (2015). Circuit architecture of VTA dopamine neurons revealed by systematic input-output mapping. Cell 162, 622–634. - PMC - PubMed
    1. Beier KT, Kim CK, Hoerbelt P, Hung LW, Heifets BD, DeLoach KE, Mosca TJ, Neuner S, Deisseroth K, Luo L, and Malenka RC (2017). Rabies screen reveals GPe control of cocaine-triggered plasticity. Nature 549, 345–350. - PMC - PubMed
    1. Callaway EM, and Luo L (2015). Monosynaptic circuit tracing with glycoprotein-deleted rabies viruses. J. Neurosci 35, 8979–8985. - PMC - PubMed

Publication types