. 2019 Jan 2;26(1):182-191.e5.
doi: 10.1016/j.celrep.2018.12.039.

High-Frequency Microdomain Ca2+ Transients and Waves during Early Myelin Internode Remodeling

Affiliations

High-Frequency Microdomain Ca2+ Transients and Waves during Early Myelin Internode Remodeling

Arne Battefeld et al. Cell Rep. .

Abstract

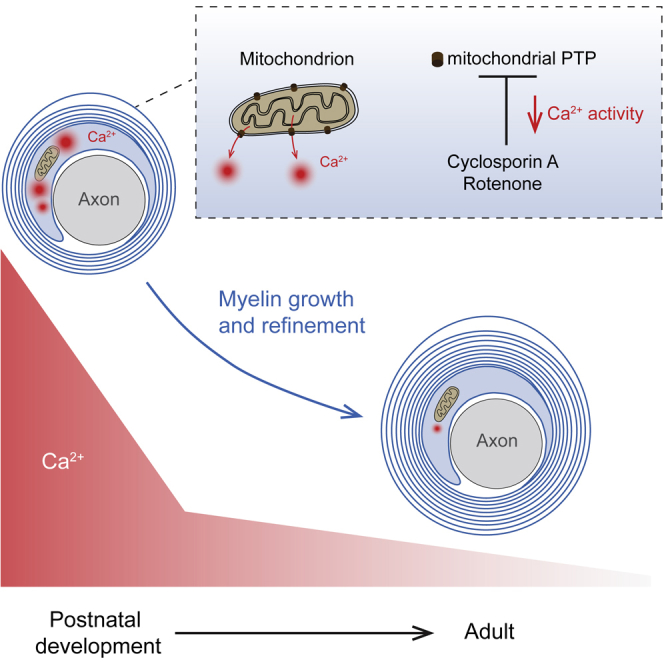
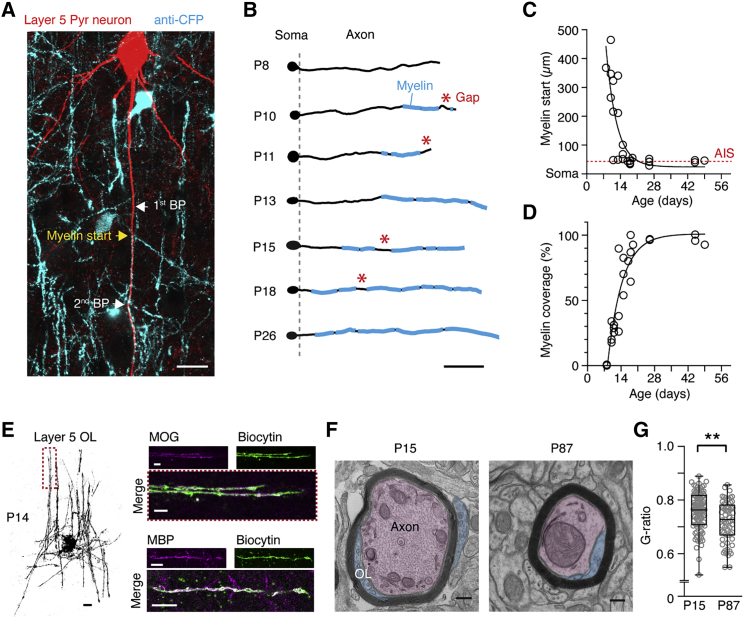
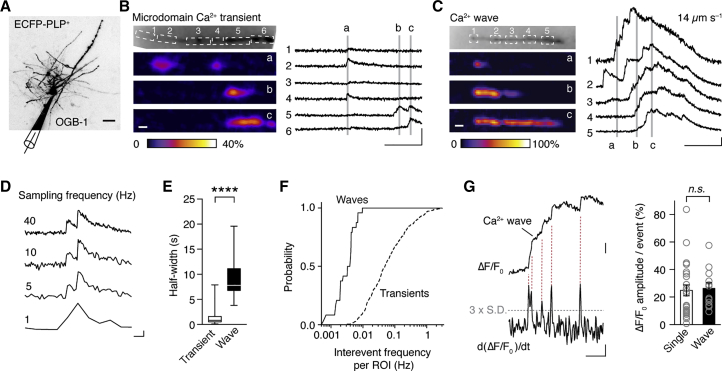
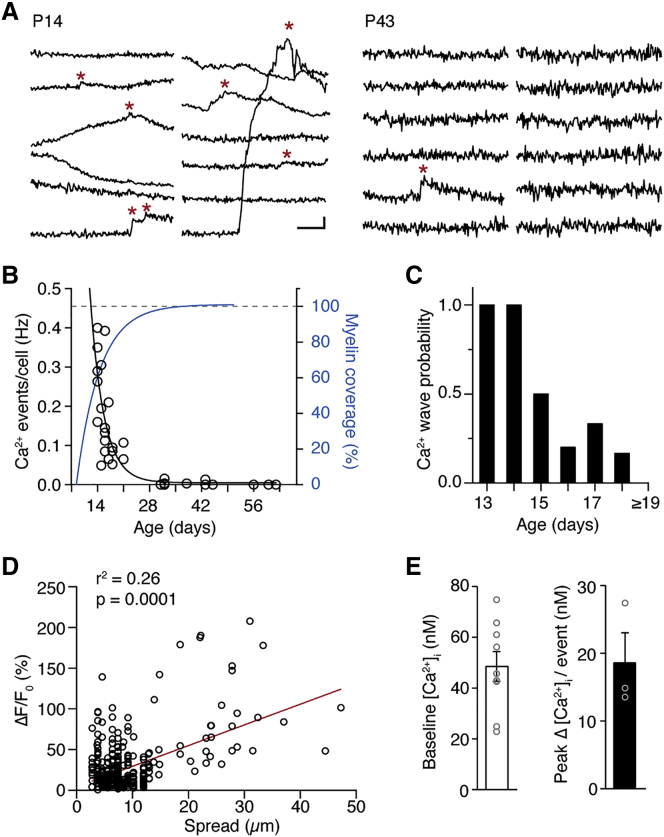
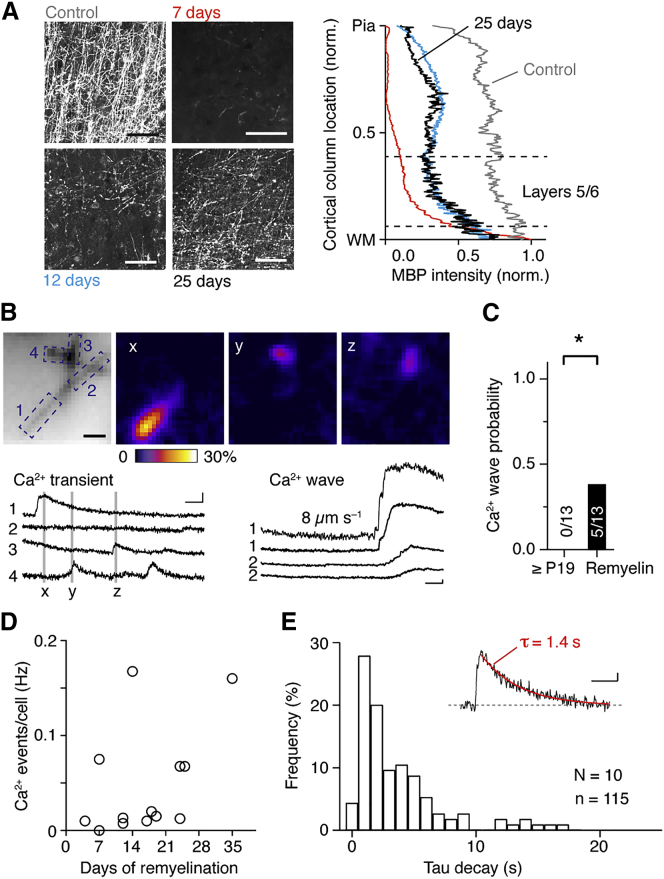
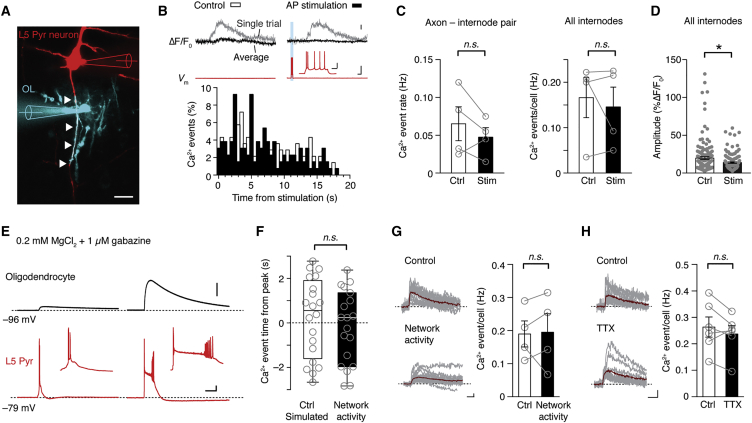
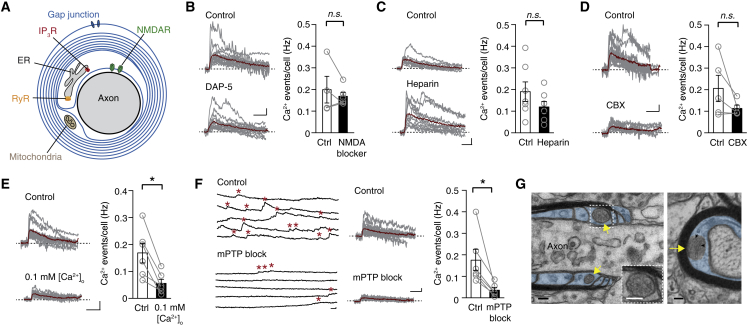
Ensheathment of axons by myelin is a highly complex and multi-cellular process. Cytosolic calcium (Ca2+) changes in the myelin sheath have been implicated in myelin synthesis, but the source of this Ca2+ and the role of neuronal activity is not well understood. Using one-photon Ca2+ imaging, we investigated myelin sheath formation in the mouse somatosensory cortex and found a high rate of spontaneous microdomain Ca2+ transients and large-amplitude Ca2+ waves propagating along the internode. The frequency of Ca2+ transients and waves rapidly declines with maturation and reactivates during remyelination. Unexpectedly, myelin microdomain Ca2+ transients occur independent of neuronal action potential generation or network activity but are nearly completely abolished when the mitochondrial permeability transition pores are blocked. These findings are supported by the discovery of mitochondria organelles in non-compacted myelin. Together, the results suggest that myelin microdomain Ca2+ signals are cell-autonomously driven by high activity of mitochondria during myelin remodeling.

Keywords: action potential; axon; calcium; development; mitochondria; mouse; myelin; permeability transition pore; pyramidal neuron; remyelination.


Figures

None
Graphical abstract
Figure 1
Figure 1
Radial and Longitudinal Myelin Development in the Somatosensory Cortex in the First Postnatal Weeks (A) Fluorescence image of a layer 5 neuron in the somatosensory cortex (P15) of a PLP-ECFP mouse. The neuron was filled with biocytin (red) and co-labeled for ECFP (cyan) to identify OLs and myelinated segments. Start of myelin and branchpoints (BPs) are indicated. Scale bar, 20 μm. (B) Examples of reconstructed primary axon (black) overlaid with myelin segments (cyan). Scale bar, 100 μm. Asterisks indicate gaps larger than nodes of Ranvier. (C) The start of the first myelinated segment moves closer to the axon initial segment (dotted line) within the third postnatal week. Data fit with a single exponential equation with a time constant of 4.4 days. (D) Layer 5 axon myelination develops rapidly and reaches completion near P21. Data points represent individual axons and are corrected for an unmyelinated proximal length of 45 μm that includes the AIS. Data fit with a single exponential equation with a time constant of 6 days. (E) Left: a P14 OL filled with biocytin. Right: post hoc staining of two OLs confirms that internodes are positive for MOG and MBP at P14. The dotted box (left) indicates the MOG-positive internode. Scale bars, 10 μm. (F) Electron microscopy (EM) images of large axons in the somatosensory cortex during development (P15) and adulthood (P87). OL cytoplasmic ridges (cyan) and neuron (red) are false colored. Scale bars, 200 nm. (G) G-ratio measurements (inner axon diameter/outer diameter including myelin) reveals an average of 0.76 ± 0.01 at P14 (n = 96 axons) and a smaller g ratio at P87 (n = 64 axons; p = 0.002, Mann-Whitney test). Horizontal bar in the 25th to 75th percentile boxplot indicates the median and the error bars the maximum and minimum. See also Figures S1 and S3.
Figure 2
Figure 2
High-Frequency Microdomain Ca2+ Transients and Ca2+ Waves during Early Myelin Remodeling (A) Confocal z projection of a live-scanned OL filled with 100 μM OGB-1. Scale bar, 20 μm. (B and C) Left: Ca2+ transients (B) and wave (C) from two different OLs (scale bar, 5 μm). Right: Ca2+ traces with corresponding ROI locations (numbers) and time points (letters) as indicated in epifluorescence images (scale bars, 5 s and 30% ΔF/F, B, and ΔF/F0, C). (D) Comparison of different optical sampling frequencies. Scale bars, 1 s and 10% ΔF/F. (E) Half-width duration of myelin Ca2+ events is longer in waves (n = 21) compared with transients (n = 421; p = 0.0001, Mann-Whitney test). Boxplot indicates 25th and 75th percentiles, the horizontal bar in the box indicates the median, and error bars show the maximum and minimum. (F) Cumulative probability plot of inter-event frequencies reveals that Ca2+ transients occur 50 times more often than Ca2+ waves (transients: n = 418 events, n = 11 OLs; waves: n = 24, n = 14 OLs; p < 0.0001, Kolmogorov-Smirnov test). (G) Left: Ca2+ wave with expanded timescale reveals a summation of brief Ca2+ transients. By using the first derivative of the fluorescence (lower trace − d[ΔF/F]/dt), peak detection could be performed when fluorescence change was fastest (peak). Several transients are indicated (vertical dotted lines) and the cut-off set as 3 × SD (horizontal dotted line). Scale bars, 10% ΔF/F0, 50% ΔF/F × s–1, and 1 s. Right: summary data comparing the predicted amplitude of Ca2+ events within a wave to individual Ca2+ transients (five first events of five control OLs; p = 0.42, Mann-Whitney test). Mean ± SEM. See also Figure S2.
Figure 3
Figure 3
Ca2+ Events Attenuate during Myelin Maturation (A) Example Ca2+ traces for two ages (P14 and P43). Note the large Ca2+ waves at P14. Scale bars, 10% ΔF/F and 1 s. Asterisks indicate Ca2+ events. (B) Scatterplot of myelin Ca2+ events per OL (open black circles) revealing a rapid decrease until the third postnatal week. Dotted blue line represents the fit to myelin coverage of layer 5 axons (same fit as in Figure 1D). (C) Probability of Ca2+ waves rapidly declines between P13 and P63. P13, 2 waves and 2 OLs; P14, 5 waves and 5 OLs; P15, 4 waves and 8 OLs; P16, 1 wave and 5 OLs; P17, 1 wave and 3 OLs; P18, 1 wave and 6 OLs; ≥P19, 0 waves and 13 OLs. (D) Scatterplot of ΔF/F0 changes versus spatial spread shows a positive correlation (n = 391 events, N = 22 cells). Data fit with a linear function (red line). (E) Left: bar plot for baseline intracellular internode Ca2+ concentration [Ca2+]i (n = 9 internodes). Right: bar plot for Ca2+ peak change during Ca2+ transients (n = 3 internodes from N = 3 animals) obtained with ratiometric Ca2+ imaging from internodes. Data are presented as mean ± SEM. See also Figure S3.
Figure 4
Figure 4
Remyelination Reactivates Ca2+ Microdomain Transients and Ca2+ Waves (A) Left: representative MBP immunostainings of layer 5 in control and after 7, 12, and 25 days of remyelination. Scale bars, 50 μm. Right: normalized MBP intensity for the four stages plotted versus the normalized cortical column length. WM, white matter. (B) Top: images of resting and frame subtracted fractional fluorescence change with time points indicated (x, y, z). Scale bar, 5 μm. Bottom: corresponding Ca2+ traces of the ROIs for transient Ca2+ events and Ca2+ waves from two different trials. The Ca2+ wave initiates at the end tip (ROI 1) and propagates toward the center of the sheath (ROI 2). Scale bars, 10% ΔF/F0 and 2 s. (C) Ca2+ wave probability increases during remyelination (p = 0.039, Fisher exact test). (D) Ca2+ event frequency is increased up to 35 days after remyelination onset. (E) Histogram of the decay time constant for Ca2+ events during remyelination. Inset shows a typical Ca2+ event; scale bars, 5% ΔF/F0 and 1 s. See also Figure S4.
Figure 5
Figure 5
Myelin Microdomain Ca2+ Transients Are Independent of Neuronal Activity (A) Confocal image of a simultaneous OL-neuron whole-cell recording (white arrowheads indicate shared axon). Scale bar, 20 μm. (B) Top: example traces of the neuronal membrane potential (Vm, red) and myelin Ca2+ signals (same ROI) for control and stimulation. Bottom: histogram of events relative to the action potential (AP) stimulus at 0 s. Ca2+ events in control were aligned to the AP onset. Scale bars, 5% ΔF/F, 30 mV, and 1 s. Inset: 30 mV and 0.1 s. (C) Left: Ca2+ event frequency of single axon-internode pairs before and after stimulation (p = 0.38, Wilcoxon signed rank test; n = 4 paired recordings, N = 3 animals). Right: Ca2+ event frequency for all internodes (p = 0.88, Wilcoxon signed rank test; n = 4 paired recordings, n = 20 internodes, 2–6 internodes/OL). (D) Ca2+ event amplitude (ΔF/F0) was reduced following AP stimulation (p = 0.018, Mann-Whitney test). Mean ± SEM. (E) Network activity was evoked by reducing extracellular Mg2+ to 0.2 mM and blocking inhibition (GABAA receptor blocker gabazine). OL membrane potentials were temporally synchronized with network burst and exhibited peak depolarizations up to 20 mV. Insets show expanded timescales of ∼1 s. Scale bars, 10 mV and 1 s. (F) Boxplot depicting the timing of myelin Ca2+ events 3 s before and after network activity compared with randomly generated event times (p = 0.99, Kolmogorov-Smirnov test; n = 4 OLs). The box indicates 25th and 75th percentiles, the horizontal bar indicates the median, and error bars maximum and minimum. (G) Left: single-trial Ca2+ fluorescence traces overlaid with the average (red trace) before and after increase of network activity. Scale bars, 10% ΔF/F0 and 0.5 s. Right: summary plot showing Ca2+ event frequency before and after increased network activity (p = 0.88, Wilcoxon signed rank test; n = 4 OLs). Mean ± SEM. (H) Single-trial Ca2+ fluorescence traces and summary data before and after bath application of TTX (p = 0.31, Wilcoxon signed rank test; n = 6 OLs). Scale bars, 1 s and 10% ΔF/F0. Mean ± SEM. See also Figure S5.
Figure 6
Figure 6
Myelin Microdomain Ca2+ Transients Are Generated by Mitochondria in Non-compacted Myelin (A) Schematic overview of putative receptors and pathways implicated in myelin Ca2. Ca2+ entry could be triggered by activation of NMDA receptors (NMDAR), downstream activation of intracellular IP3R or ryanodine receptor (RyR), gap-junction coupling with astrocytes or mitochondria. (B) Example traces and pooled summary data for paired DAP-5 wash-in experiments (connecting lines) and intracellular application of MK-801 (single data points). No effect of NMDA receptor block on event frequency was observed (p = 0.91, Mann-Whitney test; ctrl: n = 4 OLs, NMDA block = 6 OLs). Mean ± SEM. (C) Example traces and summary plot for Ca2+ event frequency for control and intracellular IP3R block by heparin shows no change (p = 0.21, Mann-Whitney test; n = 7 OLs for each condition). Mean ± SEM. (D) Examples traces and summary plots for the effect of gap-junction blocker carbenoxolone (p = 0.18, Wilcoxon-signed rank test; n = 5 OLs). Mean ± SEM. (E) Reduction of extracellular [Ca2+] to 0.1 mM reduces Ca2+ event frequency in myelin (p = 0.03, Wilcoxon-signed rank test; n = 6 OLs). Mean ± SEM. (F) Left: example traces showing 5 × 20 s of myelin Ca2+ imaging in control and after inhibition of the mitochondrial permeability transition pore (mPTP) with 20 μM cyclosporine A and 10 μM rotenone. Asterisks indicate Ca2+ transients. Middle and right: individual Ca2+ events (gray) and average Ca2+ event frequency (red) showing a significant reduction following mPTP block (p = 0.03, Wilcoxon-signed rank test; n = 34 internodes from 6 OLs). Scale bars for all imaging traces from (B) to (F), 1 s and 10% ΔF/F0. Mean ± SEM. (G) Left: example EM image mitochondria (yellow arrows) in the cytoplasm of paranodal myelin (false blue colored) in the adult somatosensory cortex. Right: EM image of a mitochondrion located in the inner cytoplasmic loop, the adaxonal myelin. Note the presence of cristae within the mitochondrion (black arrowheads). Scale bars, 100 nm. See also Figure S6.

References

    1. Agarwal A., Wu P.-H., Hughes E.G., Fukaya M., Tischfield M.A., Langseth A.J., Wirtz D., Bergles D.E. Transient opening of the mitochondrial permeability transition pore induces microdomain calcium transients in astrocyte processes. Neuron. 2017;93:587–605.e7. - PMC - PubMed
    1. Baraban M., Koudelka S., Lyons D.A. Ca 2+ activity signatures of myelin sheath formation and growth in vivo. Nat. Neurosci. 2018;21:19–23. - PMC - PubMed
    1. Barres B.A., Raff M.C. Axonal control of oligodendrocyte development. J. Cell Biol. 1999;147:1123–1128. - PMC - PubMed
    1. Battefeld A., Klooster J., Kole M.H.P. Myelinating satellite oligodendrocytes are integrated in a glial syncytium constraining neuronal high-frequency activity. Nat. Commun. 2016;7:11298. - PMC - PubMed
    1. Baxi E.G., DeBruin J., Jin J., Strasburger H.J., Smith M.D., Orthmann-Murphy J.L., Schott J.T., Fairchild A.N., Bergles D.E., Calabresi P.A. Lineage tracing reveals dynamic changes in oligodendrocyte precursor cells following cuprizone-induced demyelination. Glia. 2017;65:2087–2098. - PMC - PubMed

Publication types

LinkOut - more resources