. 2019 Jan 2;26(1):192-208.e6.
doi: 10.1016/j.celrep.2018.12.036.

Genetic Liver-Specific AMPK Activation Protects against Diet-Induced Obesity and NAFLD

Affiliations

Genetic Liver-Specific AMPK Activation Protects against Diet-Induced Obesity and NAFLD

Daniel Garcia et al. Cell Rep. .

Abstract

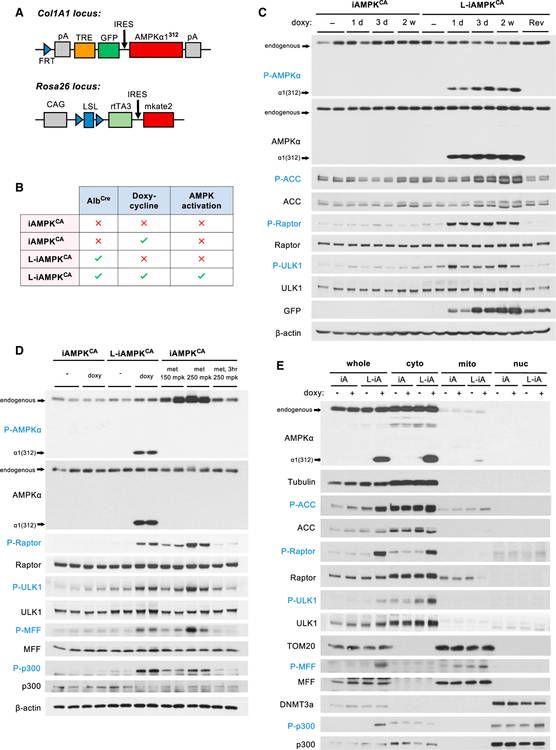
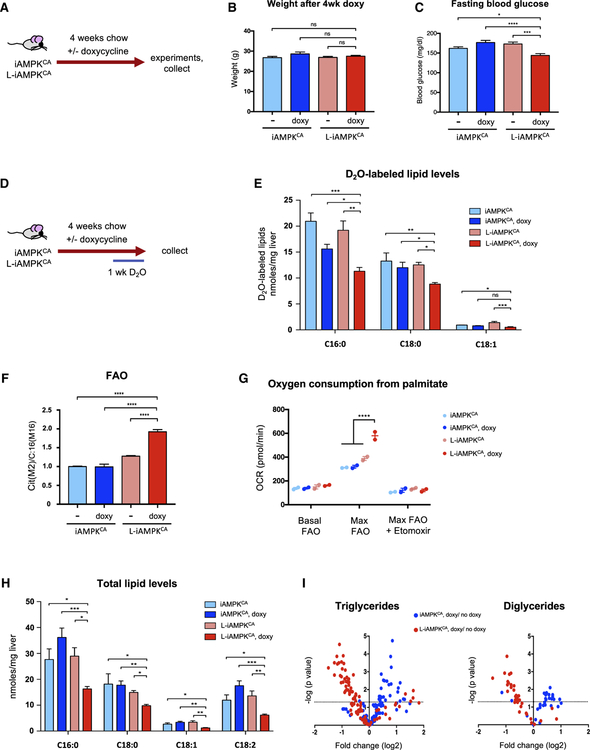
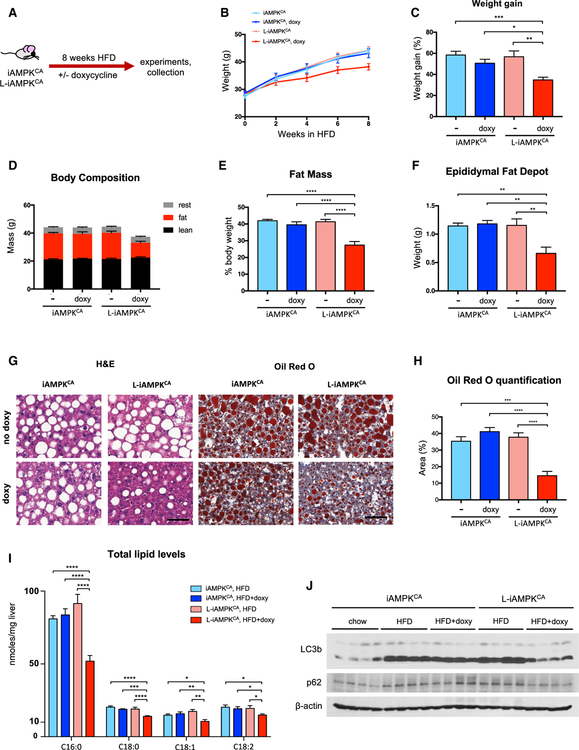
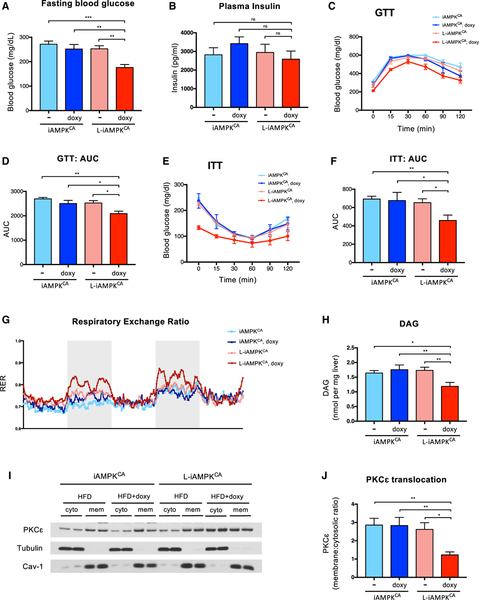
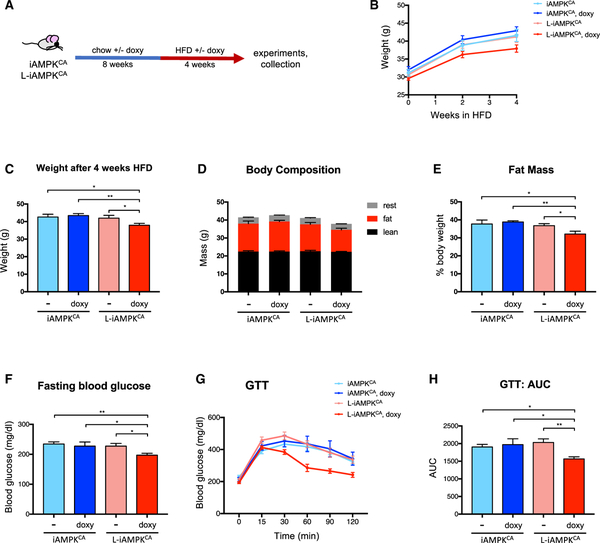
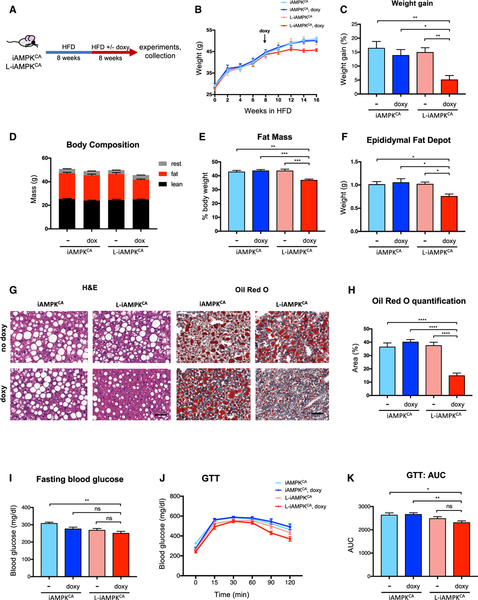
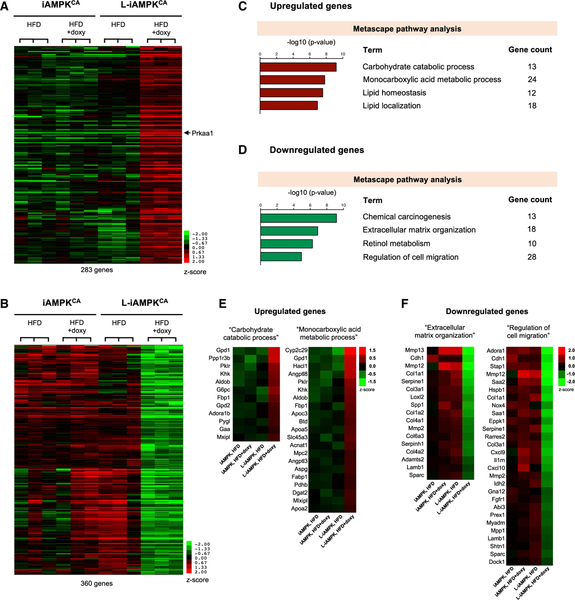
The AMP-activated protein kinase (AMPK) is a highly conserved master regulator of metabolism, whose activation has been proposed to be therapeutically beneficial for the treatment of several metabolic diseases, including nonalcoholic fatty liver disease (NAFLD). NAFLD, characterized by excessive accumulation of hepatic lipids, is the most common chronic liver disease and a major risk factor for development of nonalcoholic steatohepatitis, type 2 diabetes, and other metabolic conditions. To assess the therapeutic potential of AMPK activation, we have generated a genetically engineered mouse model, termed iAMPKCA, where AMPK can be inducibly activated in vivo in mice in a spatially and temporally restricted manner. Using this model, we show that liver-specific AMPK activation reprograms lipid metabolism, reduces liver steatosis, decreases expression of inflammation and fibrosis genes, and leads to significant therapeutic benefits in the context of diet-induced obesity. These findings further support AMPK as a target for the prevention and treatment of NAFLD.

Keywords: AMPK; GEMM; NAFLD; lipid metabolism; liver steatosis; obesity.


Conflict of interest statement

DECLARATION OF INTERESTS

The authors declare no competing interests.

Figures

Figure 1.
Figure 1.. Generation and Validation of iAMPKCA Mice
(A) Diagram detailing the genetically engineered components of iAMPKCA mice at the Col1A1 and Rosa26 loci. CAG, CMV early enhancer chicken β-actin promoter; FRT, Flp recombination target; IRES, internal ribosome entry site; LSL, loxP-Stop (neomycin-resistance gene)-loxP cassette; mkate2, next-generation red-fluorescent protein; pA, polyA signal; rtTA3, reverse tetracycline-controlled transactivator 3; TRE, tet-response element. (B) Table depicting the components required for liver-specific activation of AMPK using the iAMPKCA mouse model. Only doxycycline-treated L-iAMPKCA mice activate AMPK in liver. The other three groups serve as control mice. (C) Western blot analysis of the expression of constitutively active AMPK and subsequent AMPK signaling activation in livers from iAMPKCA and L-iAMPKCA mice. Each lane is a separate mouse. d, day; Rev, 2 weeks doxycycline and then 1 week without doxycycline (reversed); w, weeks. (D) Western blot analysis comparing the magnitude of AMPK activation in livers of iAMPKCA and L-iAMPKCA mice fed for 3 days with chow, plus or minus doxycycline, to AMPK activation by metformin in liver (1 hr, at indicated doses; or 3 hr where indicated). Each lane is a separate mouse. met, metformin; mpk, mg per kg. (E) Livers of iAMPKCA and L-iAMPKCA mice, plus or minus 4 weeks doxycycline, were subjected to cellular fractionation. The subcellular localization and phosphorylation of the indicated proteins were determined by western blot. Tubulin, TOM20, and DNMT3a were used to demonstrate fraction purity. cyto, cytoplasmic fraction; iA, iAMPKCA mice; L-iA, L-AMPKCA mice; mito, mitochondrial fraction; nuc, nuclear fraction.
Figure 2.
Figure 2.. AMPK Activation Reduces Hepatic Lipid Levels
(A) Schematic of experimental design to determine the effects of liver-specific AMPK activation in chow-fed iAMPKCA and L-iAMPKCA mice. (B) Body weight of iAMPKCA and L-iAMPKCA mice treated as in (A). n = 8–10 mice per condition. (C) Fasting (6 hr) blood glucose of iAMPKCA and L-iAMPKCA mice treated as in (A). n = 10 mice per condition. (D) Schematic of experimental design to determine the effects of AMPK activation on de novo lipogenesis in vivo. D2O, deuterium-labeled water. (E) Levels of newly synthesized (D2O-labeled) lipids in livers from iAMPKCA and L-iAMPKCA mice treated as in (D). (F) Fatty acid oxidation rates traced from uniformly labeled [U-13C16]-Palmitate and its oxidation into citrate in hepatocytes harvested from iAMPKCA and L-iAMPKCA mice, fed chow with or without doxycycline for 4 weeks. (G) Oxygen consumption rate from palmitate substrate in hepatocytes harvested from iAMPKCA and L-iAMPKCA mice fed chow with or without doxycycline for 4 weeks. Results from two independent experiments are plotted. (H) Total levels of palmitate (C16:0), stearate (C18:0), oleate (C18:1) and linoleate (C18:2) in livers from iAMPKCA and L-iAMPKCA mice fed chow with or without doxycycline for 4 weeks. n = 4 mice per condition. (I) Volcano plots showing lipidomics analysis of fold changes in triglycerides and diglycerides species in livers from iAMPKCA and L-iAMPKCA mice fed chow with or without doxycycline for 4 weeks. n = 4 mice per condition. All values are expressed as means, and error bars reflect SEM. Significance was determined by ANOVA (*p < 0.05; **p < 0.01; **p < 0.001; ****p < 0.0001; ns, not significant).
Figure 3.
Figure 3.. AMPK Activation in Liver Protects against Diet-Induced Obesity
(A) Protection study: schematic of experimental design to determine the effects of liver-specific AMPK activation on iAMPKCA and L-iAMPKCA mice fed a high-fat diet (HFD). (B) Body weights of iAMPKCA and L-iAMPKCA mice during the 8-week HFD trial. n = 14 mice per condition. (C) Percentage weight gain in iAMPKCA and L-iAMPKCA mice at the end of the HFD trial compared to initial weight. n = 14 mice per condition. (D) Body composition and (E) percent fat mass of iAMPKCA and L-iAMPKCA mice treated as in (A). n = 13 mice per condition. (F) Weight of one epididymal fat depot in iAMPKCA and L-iAMPKCA mice treated as in (A). n = 6 mice per condition. (G) Representative images of livers from iAMPKCA and L-iAMPKCA mice treated as in (A) stained with H&E or Oil Red O, as indicated. Scale bar, 50 μm. (H) Quantification of the area stained by Oil Red O in livers from iAMPKCA and L-iAMPKCA mice treated as in (A). n = 6 mice per condition. (I) Total levels of palmitate (C16:0), stearate (C18:0), oleate (C18:1), and linoleate (C18:2) in livers from iAMPKCA and L-iAMPKCA mice treated as in (A). n = 6 mice per condition. (J) Western blot analysis of the indicated proteins in iAMPKCA and L-iAMPKCA mice treated as in (A). Each lane is a separate mouse. All values are expressed as means, and error bars reflect SEM. Significance was determined by ANOVA (*p < 0.05; **p < 0.01; ***p < 0.001; ****p < 0.0001; ns, not significant).
Figure 4.
Figure 4.. AMPK Activation in Liver Modestly Improves Glucose Homeostasis in the Context of Diet-Induced Obesity
(A) Fasting (6 hr) blood glucose in iAMPKCA and L-iAMPKCA mice fed a HFD with or without doxycycline for 8 weeks. n = 13 mice per condition. (B) Fasting (6 hours) plasma insulin levels in iAMPKCA and L-iAMPKCA mice fed a HFD with or without doxycycline for 8 weeks. n = 6 mice per condition. (C) Glucose tolerance test (GTT) on iAMPKCA and L-iAMPKCA mice fed a HFD with or without doxycycline for 8 weeks. n = 6 mice per condition. (D) Quantification of the area under the curve in (C). (E) Insulin tolerance test (ITT) in iAMPKCA and L-iAMPKCA mice fed a HFD with or without doxycycline for 8 weeks. n = 6 mice per condition. (F) Quantification of the area under the curve in (E). (G) Metabolic cage analysis of the respiratory exchange ratio (RER) in iAMPKCA and L-iAMPKCA mice fed a HFD with or without doxycycline for 8 weeks. Shaded area (light gray) delineates night (6:00 p.m. to 6:00 a.m.). n = 4 mice per condition. (H) Measurement of diacylglycerol (DAG) in livers of iAMPKCA and L-iAMPKCA mice fed a HFD with or without doxycycline for 8 weeks. n = 5 mice per condition. (I) Western blot analysis of PKCε levels in fractionated livers from iAMPKCA and L-iAMPKCA mice fed a HFD with or without doxycycline for 8 weeks. Tubulin and caveolin-1 were used to demonstrate fraction purity. Cyto, cytoplasmic fraction; mem, cell membrane fraction. (J) Quantification of PKCε membrane translocation in fractionated livers from iAMPKCA and L-iAMPKCA mice fed a HFD with or without doxycycline for 8 weeks. The ratio of membrane-associated PKCε (normalized to caveolin-1) to cytoplasmic PKCε (normalized to tubulin) is plotted. n = 4 mice per condition. All values are expressed as means, and error bars reflect SEM. Significance was determined by ANOVA (*p < 0.05; **p < 0.01; ***p < 0.001; ns, not significant).
Figure 5.
Figure 5.. AMPK Activation in Liver Inhibits the Onset of Diet-Induced Obesity
(A) Prevention study: schematic of experimental design to determine whether prior liver-specific AMPK activation can inhibit the onset of diet-induced obesity in L-iAMPKCA mice. (B) Body weights of iAMPKCA and L-iAMPKCA mice during the HFD trial. n = 8 mice per condition. (C) Weight of iAMPKCA and L-iAMPKCA mice at the end of trial described in (A). n = 8 mice per condition. (D) Body composition and (E) percent fat mass of iAMPKCA and L-iAMPKCA mice treated as in (A). n = 8 mice per condition. (F) Fasting (6 hr) blood glucose levels in iAMPKCA and L-iAMPKCA mice treated as in (A). n = 7 mice per condition. (G) GTT in iAMPKCA and L-iAMPKCA mice treated as in (A). n = 7 mice per condition. (H) Quantification of the area under the curve in (G). All values are expressed as means, and error bars reflect SEM. Significance was determined by ANOVA (*p < 0.05; **p < 0.01).
Figure 6.
Figure 6.. AMPK Activation in Liver Inhibits Progression of Established Diet-Induced Obesity
(A) Intervention study. Schematic of experimental design to determine the effects of liver-specific AMPK activation on established obesity in iAMPKCA and L-iAMPKCA mice. (B) Weights of iAMPKCA and L-iAMPKCA mice during the intervention study. n = 9 mice per condition. (C) Percent weight gain in iAMPKCA and L-iAMPKCA mice at end of the intervention study relative to weight on week 8. n = 9 mice per condition. (D and E) Body composition and (E) percent fat mass of iAMPKCA and L-iAMPKCA mice at the end of intervention study. n = 9 mice per condition. (F) Weight of one epididymal fat depot in iAMPKCA and L-iAMPKCA mice at the end of intervention study. n = 8 mice per condition. (G) Representative images of H&E- and Oil Red O-stained livers from iAMPKCA and L-iAMPKCA mice at the end of intervention study. Scale bar, 50 μm. (H) Quantification of Oil Red O-stained area in livers from iAMPKCA and L-iAMPKCA mice at the end of the intervention study. n = 6 mice per condition. (I) Fasting (6 hr) blood glucose levels in iAMPKCA and L-iAMPKCA mice at the end of the intervention study. n = 8 mice per condition. (J) GTT on iAMPKCA and L-iAMPKCA mice at the end of intervention study. n = 7 mice per condition. (K) Quantification of the area under the curve in (J). All values are expressed as means. and error bars reflect SEM. Significance was determined by ANOVA (*p < 0.05; **p < 0.01; ***p < 0.001; ****p < 0.0001; ns, not significant).
Figure 7.
Figure 7.. AMPK Activation Downregulates Inflammation and Fibrosis-Related Transcriptional Programs
Whole-transcriptome sequencing (RNA-seq analysis) was performed on whole-liver RNA from iAMPKCA and L-iAMPKCA mice fed a HFD with or without doxycycline 8 weeks. (A) Heatmap representation of 283 genes upregulated after AMPK activation in liver (adjusted p < 0.05 from pairwise comparison of doxycycline-treated L-iAMPKCA samples to each of the 3 control groups). Prkaa1 (AMPKα1) is pointed out. (B) Heatmap representation of 360 genes downregulated after AMPK activation in liver (adjusted p < 0.05 from pairwise comparison of doxycycline-treated L-iAMPKCA samples to each of the 3 control groups). (C) Metascape pathway analysis on the genes upregulated by AMPK activation. (D) Metascape pathway analysis on the genes downregulated by AMPK activation. (E) Heatmaps showing upregulated genes in the terms “Carbohydrate catabolic process” and “Monocarboxylic acid metabolic process” from Metascape pathway analysis in (C). (F) Heatmaps showing downregulated genes in the terms “Extracellular matrix organization” and “Regulation of cell migration” from Metascape pathway analysis in (D).

References

    1. Beard C, Hochedlinger K, Plath K, Wutz A, and Jaenisch R (2006). Efficient method to generate single-copy transgenic mice by site-specific integration in embryonic stem cells. Genesis 44, 23–28. - PubMed
    1. Blair E, Redwood C, Ashrafian H, Oliveira M, Broxholme J, Kerr B, Salmon A, Ostman-Smith I, and Watkins H (2001). Mutations in the gamma(2) subunit of AMP-activated protein kinase cause familial hypertrophic cardiomyopathy: evidence for the central role of energy compromise in disease pathogenesis. Hum. Mol. Genet 10, 1215–1220. - PubMed
    1. Bligh EG, and Dyer WJ (1959). A rapid method of total lipid extraction and purification. Can. J. Biochem. Physiol 37, 911–917. - PubMed
    1. Boudaba N, Marion A, Huet C, Pierre R, Viollet B, and Foretz M (2018). AMPK re-activation suppresses hepatic steatosis but its downregulation does not promote fatty liver development. EBioMedicine 28, 194–209. - PMC - PubMed
    1. Carling D (2017). AMPK signalling in health and disease. Curr. Opin. Cell Biol 45, 31–37. - PubMed

Publication types

MeSH terms

Substances