

Joint models of tumour size and lymph node spread for incident breast cancer cases in the presence of screening
- PMID: 30606087
- PMCID: PMC6745622
- DOI: 10.1177/0962280218819568
Joint models of tumour size and lymph node spread for incident breast cancer cases in the presence of screening
Abstract
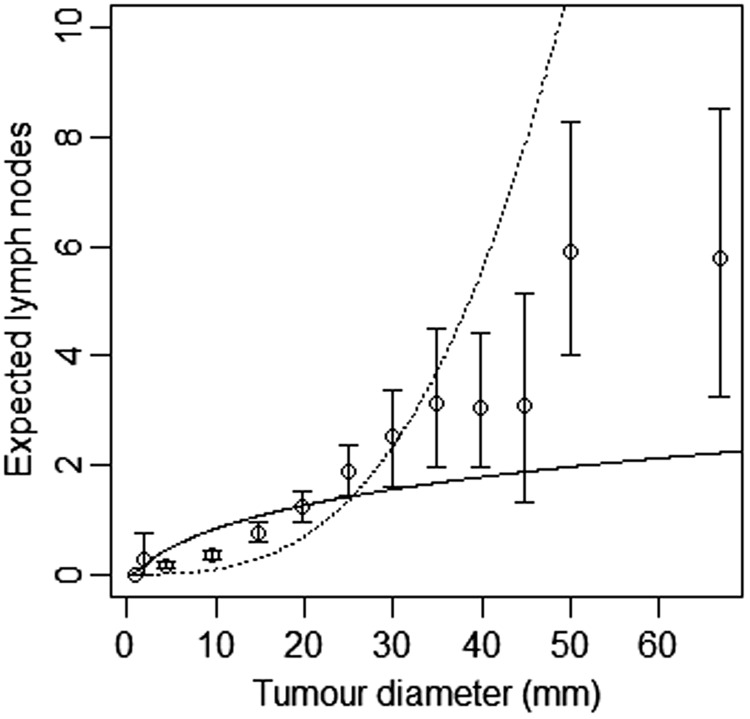
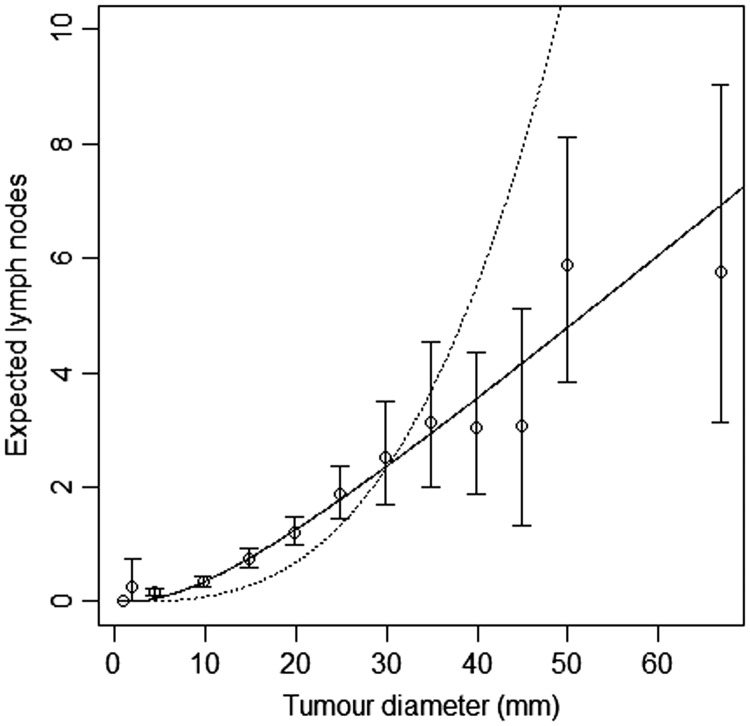
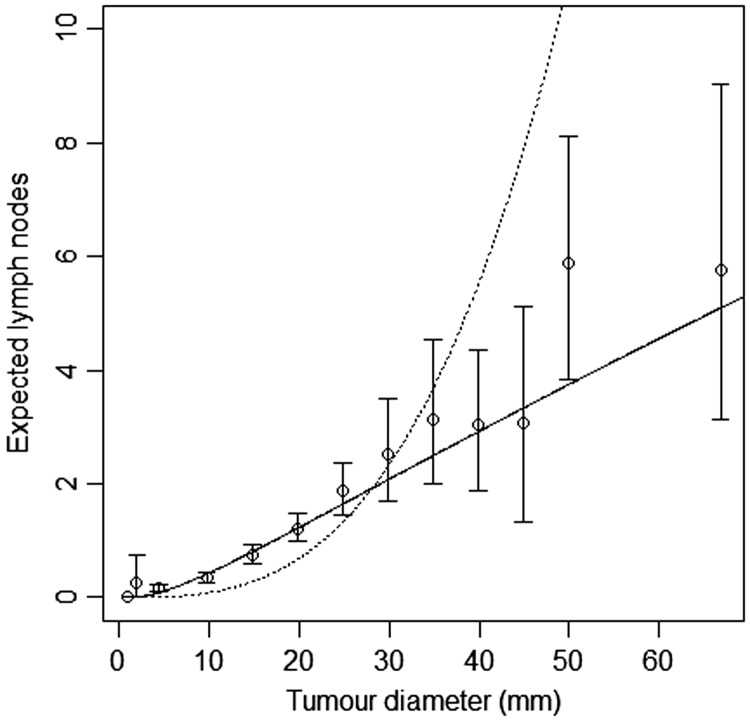
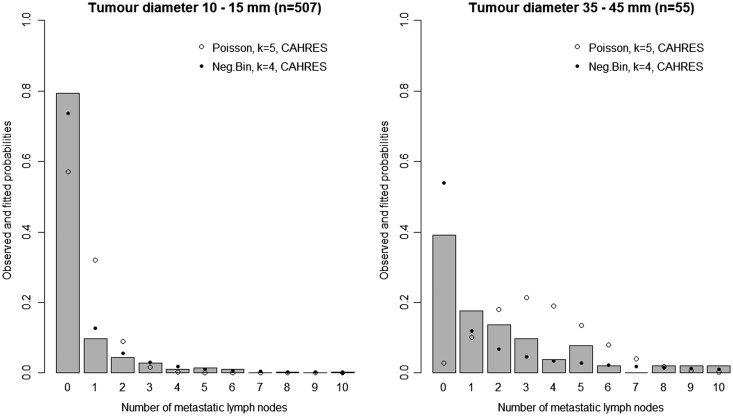
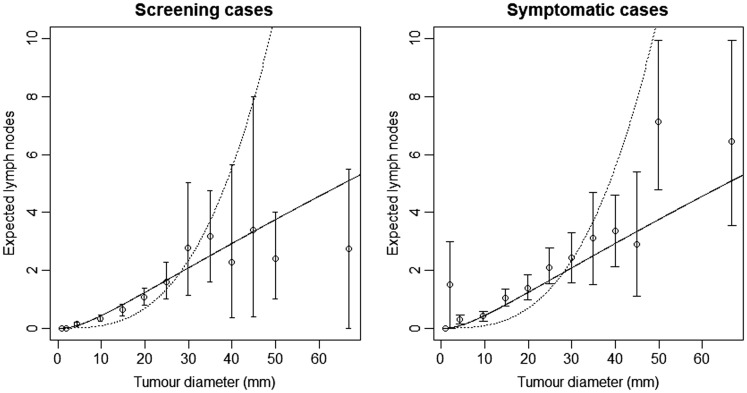
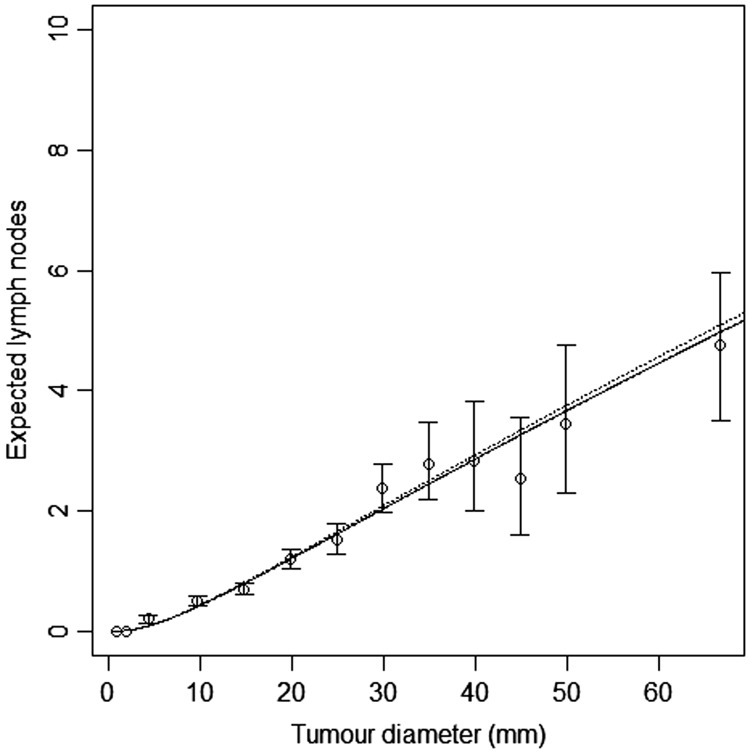
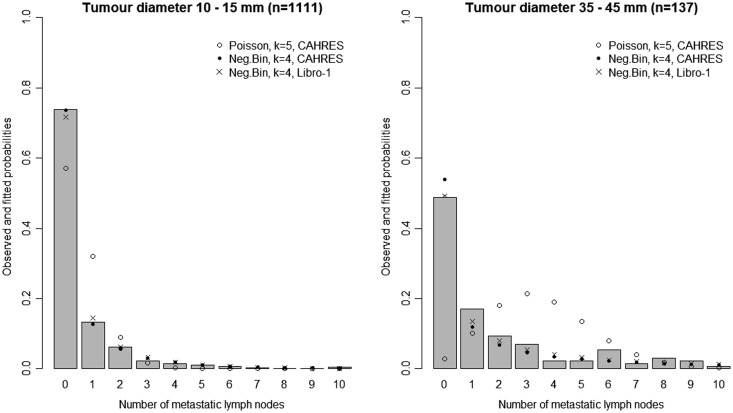
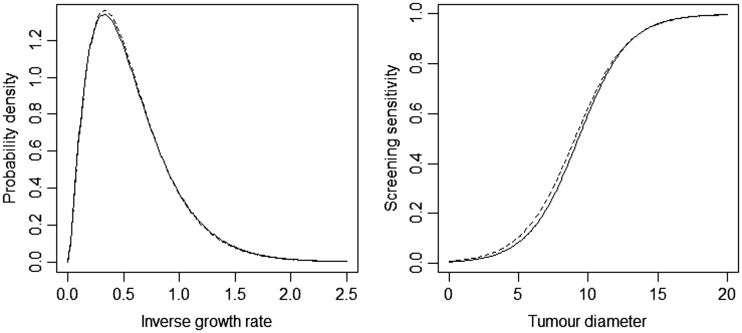
Continuous growth models show great potential for analysing cancer screening data. We recently described such a model for studying breast cancer tumour growth based on modelling tumour size at diagnosis, as a function of screening history, detection mode, and relevant patient characteristics. In this article, we describe how the approach can be extended to jointly model tumour size and number of lymph node metastases at diagnosis. We propose a new class of lymph node spread models which are biologically motivated and describe how they can be extended to incorporate random effects to allow for heterogeneity in underlying rates of spread. Our final model provides a dramatically better fit to empirical data on 1860 incident breast cancer cases than models in current use. We validate our lymph node spread model on an independent data set consisting of 3961 women diagnosed with invasive breast cancer.
Keywords: Breast cancer; joint modelling; lymph node spread; random effects modelling; screening; tumour growth model.
Figures
Similar articles
-
Random effects models of lymph node metastases in breast cancer: quantifying the roles of covariates and screening using a continuous growth model.Biometrics. 2022 Mar;78(1):376-387. doi: 10.1111/biom.13430. Epub 2021 Feb 7. Biometrics. 2022. PMID: 33501643
-
Application of automated image analysis reduces the workload of manual screening of sentinel lymph node biopsies in breast cancer.Histopathology. 2017 Dec;71(6):866-873. doi: 10.1111/his.13305. Epub 2017 Sep 22. Histopathology. 2017. PMID: 28677240
-
Detection method, tumour size and node metastases in breast cancers diagnosed during a trial of breast cancer screening.Eur J Cancer Clin Oncol. 1987 Jul;23(7):959-62. doi: 10.1016/0277-5379(87)90341-5. Eur J Cancer Clin Oncol. 1987. PMID: 3311769 Clinical Trial.
-
Sentinel lymph node as a new marker for therapeutic planning in breast cancer patients.J Surg Oncol. 2004 Mar;85(3):102-11. doi: 10.1002/jso.20022. J Surg Oncol. 2004. PMID: 14991881 Review.
-
A selection algorithm for internal mammary sentinel lymph node biopsy in breast cancer.Eur J Surg Oncol. 2002 Sep;28(6):603-14. doi: 10.1053/ejso.2002.1269. Eur J Surg Oncol. 2002. PMID: 12359195 Review.
Cited by
-
A stochastic modelling framework for cancer patient trajectories: combining tumour growth, metastasis, and survival.J Math Biol. 2025 May 22;90(6):65. doi: 10.1007/s00285-025-02229-6. J Math Biol. 2025. PMID: 40402308 Free PMC article.
-
Evaluation of optimal strategies for breast cancer screening in Ghana: A simulation study based on a continuous tumor growth model.PLoS One. 2025 Jun 17;20(6):e0323485. doi: 10.1371/journal.pone.0323485. eCollection 2025. PLoS One. 2025. PMID: 40526619 Free PMC article.
-
Optimizing breast cancer screening strategies for women with different BMI levels in Ghana: A simulation-based study on BMI-dependent tumor growth model.PLOS Glob Public Health. 2025 Jul 28;5(7):e0004953. doi: 10.1371/journal.pgph.0004953. eCollection 2025. PLOS Glob Public Health. 2025. PMID: 40720523 Free PMC article.
-
Estimating latent, dynamic processes of breast cancer tumour growth and distant metastatic spread from mammography screening data.Stat Methods Med Res. 2022 May;31(5):862-881. doi: 10.1177/09622802211072496. Epub 2022 Feb 1. Stat Methods Med Res. 2022. PMID: 35103530 Free PMC article.
-
Tumour Growth Models of Breast Cancer for Evaluating Early Detection-A Summary and a Simulation Study.Cancers (Basel). 2023 Jan 31;15(3):912. doi: 10.3390/cancers15030912. Cancers (Basel). 2023. PMID: 36765870 Free PMC article.
References
-
- Duffy SW, Chen HH, Tabar L, et al. Estimation of mean sojourn time in breast cancer screening using a Markov chain model of both entry to and exit from the preclinical detectable phase. Stat Med 1995; 14: 1531–1543. - PubMed
-
- Chen T, Duffy S, Day N. Markov chain models for progression of breast cancer. Part I: tumour attributes and the preclinical screen-detectable phase. J Epidemiol Biostat 1997; 2: 9–23. .
-
- Chen T, Duffy S, Tabar L, et al. Markov chain models for progression of breast cancer. Part II: prediction of outcomes for different screening regimes. J Epidemiol Biostatist 1997; 2: 25–35. .
-
- Uhry Z, Hédelin G, Colonna M, et al. Multi-state Markov models in cancer screening evaluation: a brief review and case study. Stat Meth Med Res 2010; 19: 463–486. - PubMed
-
- Weedon-Fekjær H, Tretli S, Aalen OO. Estimating screening test sensitivity and tumour progression using tumour size and time since previous screening. Stat Meth Med Res 2010; 19: 507–527. - PubMed
Publication types
MeSH terms
LinkOut - more resources
Full Text Sources
Medical
