

Genetic control of longissimus dorsi muscle gene expression variation and joint analysis with phenotypic quantitative trait loci in pigs
- PMID: 30606113
- PMCID: PMC6319002
- DOI: 10.1186/s12864-018-5386-2
Genetic control of longissimus dorsi muscle gene expression variation and joint analysis with phenotypic quantitative trait loci in pigs
Abstract
Background: Economically important growth and meat quality traits in pigs are controlled by cascading molecular events occurring during development and continuing throughout the conversion of muscle to meat. However, little is known about the genes and molecular mechanisms involved in this process. Evaluating transcriptomic profiles of skeletal muscle during the initial steps leading to the conversion of muscle to meat can identify key regulators of polygenic phenotypes. In addition, mapping transcript abundance through genome-wide association analysis using high-density marker genotypes allows identification of genomic regions that control gene expression, referred to as expression quantitative trait loci (eQTL). In this study, we perform eQTL analyses to identify potential candidate genes and molecular markers regulating growth and meat quality traits in pigs.
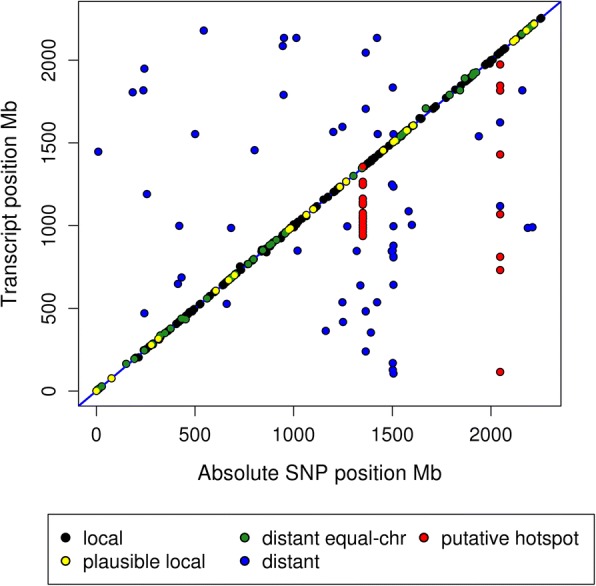
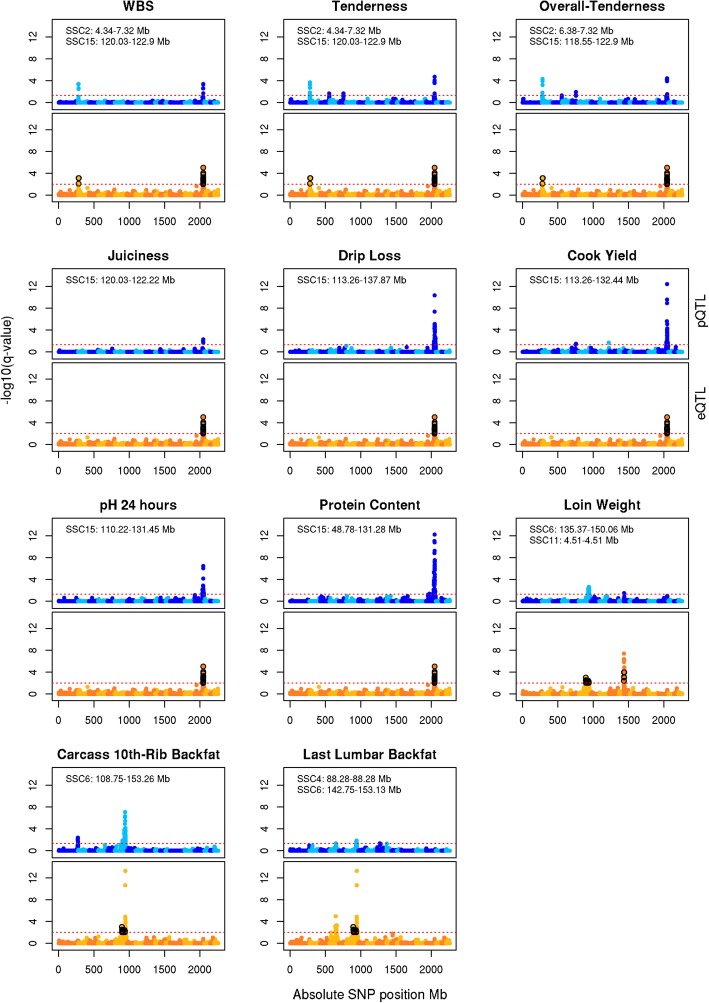
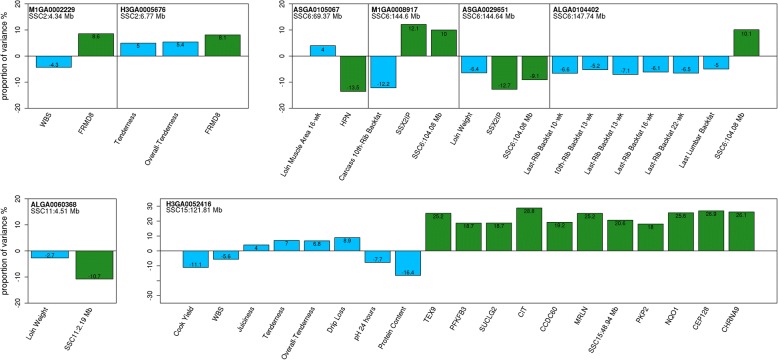
Results: Messenger RNA transcripts obtained with RNA-seq of longissimus dorsi muscle from 168 F2 animals from a Duroc x Pietrain pig resource population were used to estimate gene expression variation subject to genetic control by mapping eQTL. A total of 339 eQTL were mapped (FDR ≤ 0.01) with 191 exhibiting local-acting regulation. Joint analysis of eQTL with phenotypic QTL (pQTL) segregating in our population revealed 16 genes significantly associated with 21 pQTL for meat quality, carcass composition and growth traits. Ten of these pQTL were for meat quality phenotypes that co-localized with one eQTL on SSC2 (8.8-Mb region) and 11 eQTL on SSC15 (121-Mb region). Biological processes identified for co-localized eQTL genes include calcium signaling (FERM, MRLN, PKP2 and CHRNA9), energy metabolism (SUCLG2 and PFKFB3) and redox hemostasis (NQO1 and CEP128), and results support an important role for activation of the PI3K-Akt-mTOR signaling pathway during the initial conversion of muscle to meat.
Conclusion: Co-localization of eQTL with pQTL identified molecular markers significantly associated with both economically important phenotypes and gene transcript abundance. This study reveals candidate genes contributing to variation in pig production traits, and provides new knowledge regarding the genetic architecture of meat quality phenotypes.
Keywords: Pig; RNA-Seq; Skeletal muscle; Transcriptome; eQTL.
Conflict of interest statement
Ethics approval and consent to participate
Animal housing and care protocols were evaluated and approved by the Michigan State University All University Committee on Animal Use and Care (AUF # 09/03–114-00).
Consent for publication
Not applicable.
Competing interests
The authors declare that they have no competing interests.
Publisher’s Note
Springer Nature remains neutral with regard to jurisdictional claims in published maps and institutional affiliations.
Figures

Similar articles
-
Identification of expression QTL (eQTL) of genes expressed in porcine M. longissimus dorsi and associated with meat quality traits.BMC Genomics. 2010 Oct 16;11:572. doi: 10.1186/1471-2164-11-572. BMC Genomics. 2010. PMID: 20950486 Free PMC article.
-
Genome-wide association study in an F2 Duroc x Pietrain resource population for economically important meat quality and carcass traits.J Anim Sci. 2017 Feb;95(2):545-558. doi: 10.2527/jas.2016.1003. J Anim Sci. 2017. PMID: 28380601
-
Association and expression quantitative trait loci (eQTL) analysis of porcine AMBP, GC and PPP1R3B genes with meat quality traits.Mol Biol Rep. 2012 Apr;39(4):4809-21. doi: 10.1007/s11033-011-1274-4. Epub 2011 Sep 27. Mol Biol Rep. 2012. PMID: 21947951
-
Molecular advances in QTL discovery and application in pig breeding.Trends Genet. 2013 Apr;29(4):215-24. doi: 10.1016/j.tig.2013.02.002. Epub 2013 Mar 14. Trends Genet. 2013. PMID: 23498076 Review.
-
Advances in the discovery of genetic elements underlying longissimus dorsi muscle growth and development in the pig.Anim Genet. 2023 Dec;54(6):709-720. doi: 10.1111/age.13365. Epub 2023 Oct 5. Anim Genet. 2023. PMID: 37796678 Review.
Cited by
-
Expression quantitative trait loci in sheep liver and muscle contribute to variations in meat traits.Genet Sel Evol. 2021 Jan 18;53(1):8. doi: 10.1186/s12711-021-00602-9. Genet Sel Evol. 2021. PMID: 33461502 Free PMC article.
-
Genome-Wide Association Analysis Identified BMPR1A as a Novel Candidate Gene Affecting the Number of Thoracic Vertebrae in a Large White × Minzhu Intercross Pig Population.Animals (Basel). 2020 Nov 22;10(11):2186. doi: 10.3390/ani10112186. Animals (Basel). 2020. PMID: 33266466 Free PMC article.
-
Genome-Wide Analysis Reveals Selection Signatures Involved in Meat Traits and Local Adaptation in Semi-Feral Maremmana Cattle.Front Genet. 2021 Apr 28;12:675569. doi: 10.3389/fgene.2021.675569. eCollection 2021. Front Genet. 2021. PMID: 33995500 Free PMC article.
-
A compendium of genetic regulatory effects across pig tissues.Nat Genet. 2024 Jan;56(1):112-123. doi: 10.1038/s41588-023-01585-7. Epub 2024 Jan 4. Nat Genet. 2024. PMID: 38177344 Free PMC article.
-
Genomic Analysis of Adaptability and Genetic Structure of Jabal Akhdar Goats: Evidence of Positive Selection in an Indigenous Omani Breed.Biology (Basel). 2025 Jun 25;14(7):761. doi: 10.3390/biology14070761. Biology (Basel). 2025. PMID: 40723324 Free PMC article.
References
-
- Dekkers JCM. Commercial application of marker- and gene-assisted selection in livestock : strategies and lessons. J Anim Sci. 2004;82:E313–E328. - PubMed
-
- Van Der HAM S, GFW P, Plastow GS. Application of genomics to the pork industry. J Anim Sci. 2005;83(13):E1–E8.
MeSH terms
Grants and funding
LinkOut - more resources
Full Text Sources
Miscellaneous
