

Analysis of ambient temperature-responsive transcriptome in shoot apical meristem of heat-tolerant and heat-sensitive broccoli inbred lines during floral head formation
- PMID: 30606114
- PMCID: PMC6318969
- DOI: 10.1186/s12870-018-1613-x
Analysis of ambient temperature-responsive transcriptome in shoot apical meristem of heat-tolerant and heat-sensitive broccoli inbred lines during floral head formation
Abstract
Background: Head formation of broccoli (Brassica oleracea var. italica) is greatly reduced under high temperature (22 °C and 27 °C). Broccoli inbred lines that are capable of producing heads at high temperatures in summer are varieties that are unique to Taiwan. However, knowledge of the early-activated pathways of broccoli head formation under high temperature is limited.
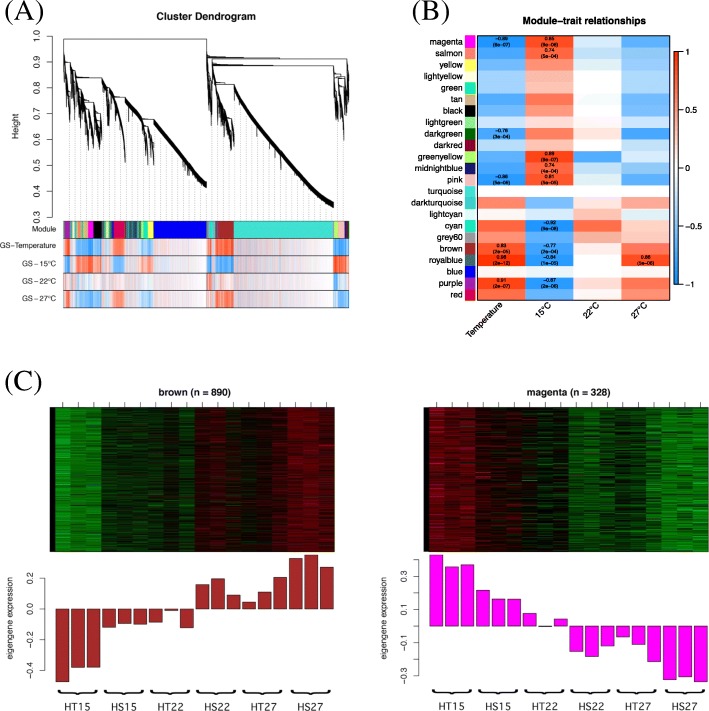
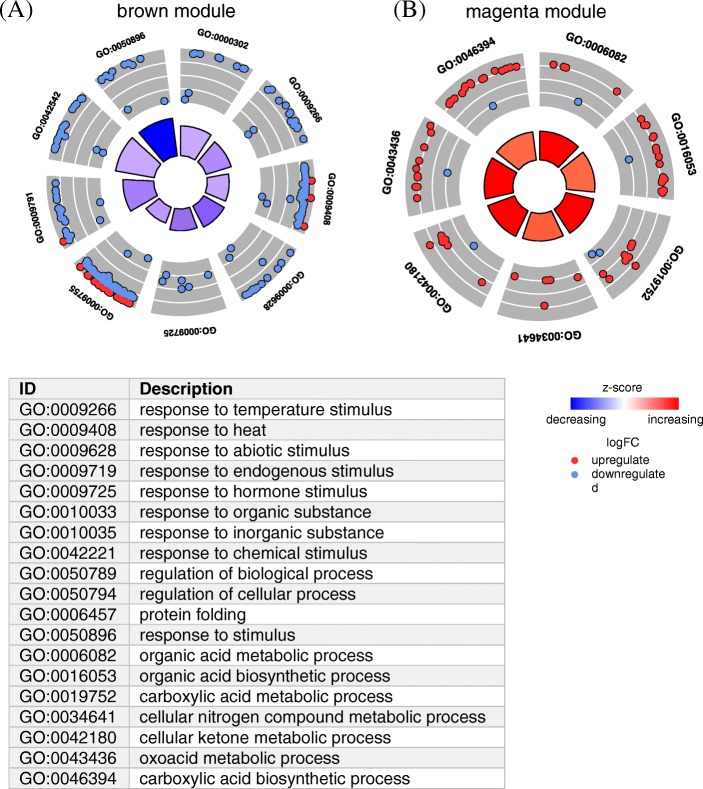
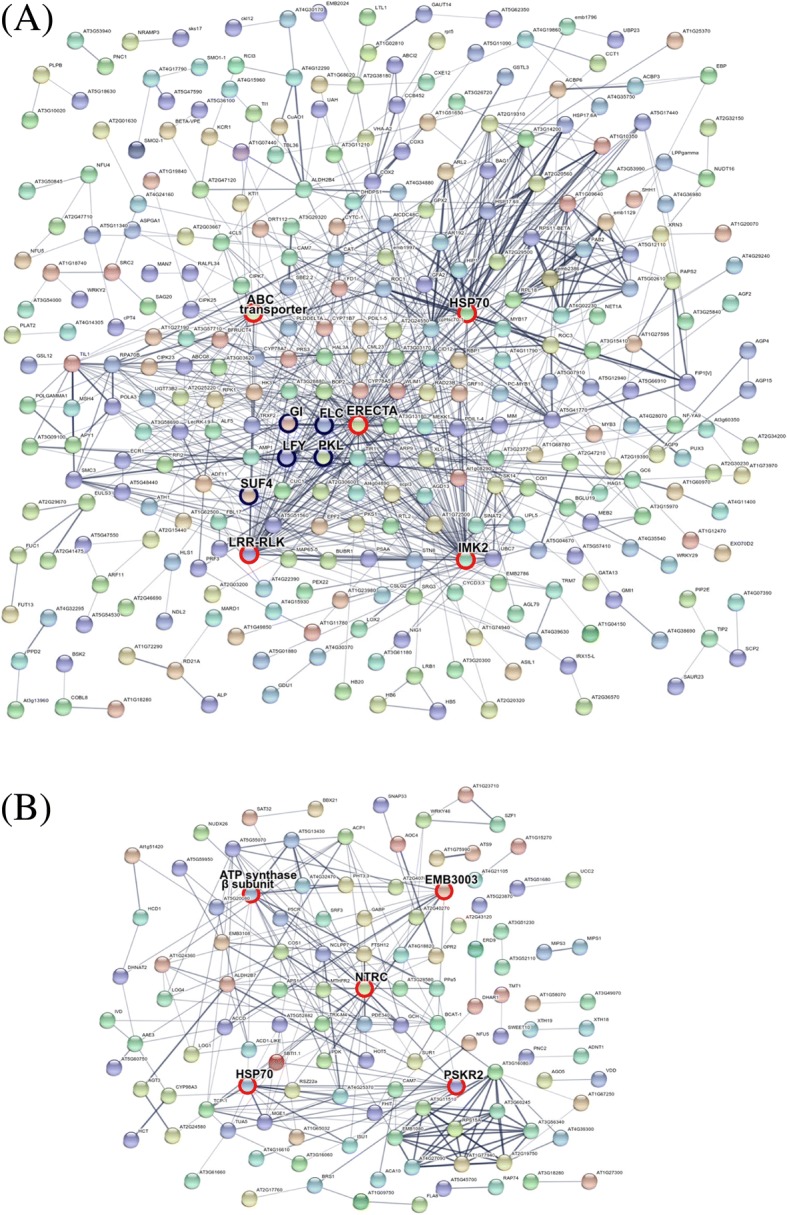
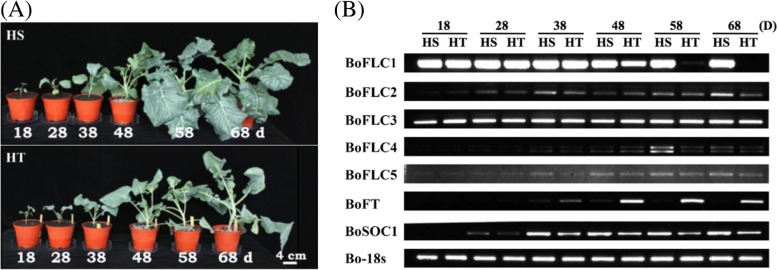
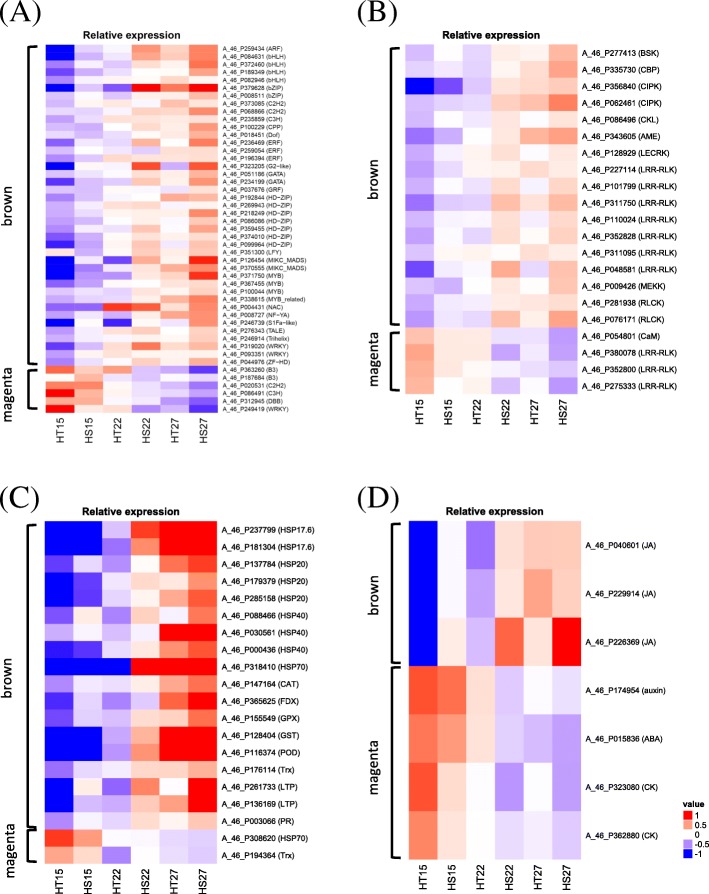
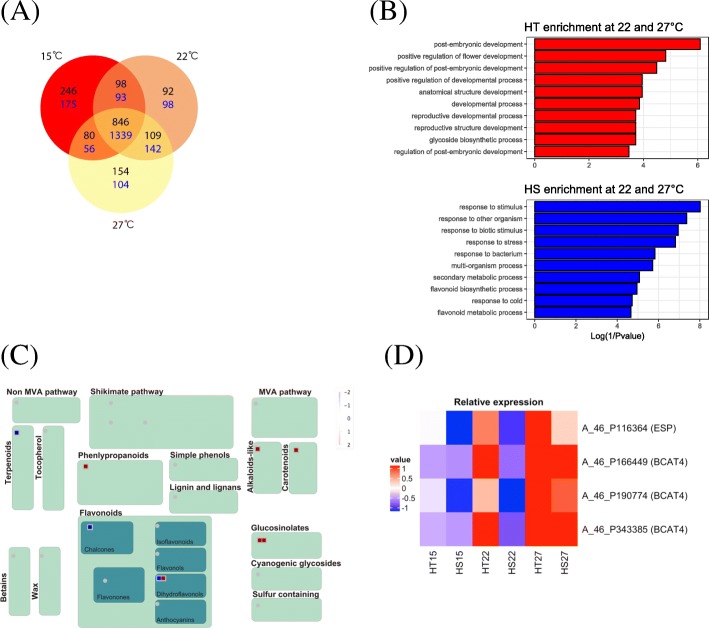
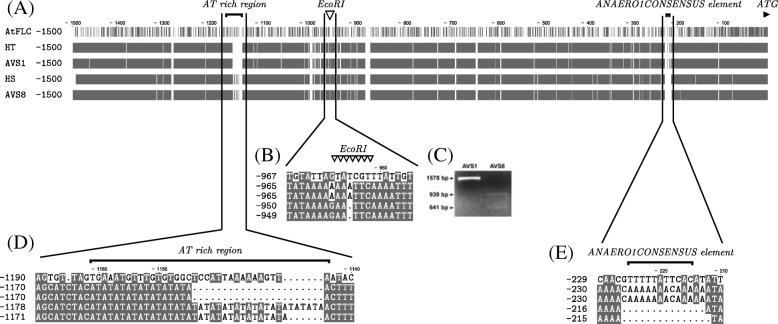
Results: We compared heat-tolerant (HT) and heat-sensitive (HS) transcriptome of broccoli under different temperatures. Weighted gene correlation network analysis (WGCNA) revealed that genes involved in calcium signaling pathways, mitogen-activated protein kinase (MAPK) cascades, leucine-rich repeat receptor-like kinases (LRR-RLKs), and genes coding for heat-shock proteins and reactive oxygen species homeostasis shared a similar expression pattern to BoFLC1, which was highly expressed at high temperature (27 °C). Of note, these genes were less expressed in HT than HS broccoli at 22 °C. Co-expression analysis identified a model for LRR-RLKs in survival-reproduction tradeoffs by modulating MAPK- versus phytohormones-signaling during head formation. The difference in head-forming ability in response to heat stress between HT and HS broccoli may result from their differential transcriptome profiles of LRR-RLK genes. High temperature induced JA- as well as suppressed auxin- and cytokinin-related pathways may facilitate a balancing act to ensure fitness at 27 °C. BoFLC1 was less expressed in HT than HS at 22 °C, whereas other FLC homologues were not. Promoter analysis of BoFLC1 showed fewer AT dinucleotide repeats in HT broccoli. These results provide insight into the early activation of stress- or development-related pathways during head formation in broccoli. The identification of the BoFLC1 DNA biomarker may facilitate breeding of HT broccoli.
Conclusions: In this study, HT and HS broccoli genotypes were used to determine the effect of temperature on head formation by transcriptome profiling. On the basis of the expression pattern of high temperature-associated signaling genes, the HS transcriptome may be involved in stress defense instead of transition to the reproductive phase in response to heat stress. Transcriptome profiling of HT and HS broccoli helps in understanding the molecular mechanisms underlying head-forming capacity and in promoting functional marker-assisted breeding.
Keywords: Biomarker; Broccoli; Genomic analysis; Head formation; High temperatures.
Conflict of interest statement
Ethics approval and consent to participate
Not applicable
Consent for publication
Not applicable.
Competing interests
The authors declare that they have no competing interests.
Publisher’s Note
Springer Nature remains neutral with regard to jurisdictional claims in published maps and institutional affiliations.
Figures
Similar articles
-
Comparative miRNAs analysis of Two contrasting broccoli inbred lines with divergent head-forming capacity under temperature stress.BMC Genomics. 2015 Dec 1;16:1026. doi: 10.1186/s12864-015-2201-1. BMC Genomics. 2015. PMID: 26625945 Free PMC article.
-
Meristem identity gene expression during curd proliferation and flower initiation in Brassica oleracea.J Exp Bot. 2008;59(2):421-33. doi: 10.1093/jxb/erm327. J Exp Bot. 2008. PMID: 18332227
-
Transcriptome and DNA methylome reveal insights into yield heterosis in the curds of broccoli (Brassica oleracea L var. italic).BMC Plant Biol. 2018 Aug 13;18(1):168. doi: 10.1186/s12870-018-1384-4. BMC Plant Biol. 2018. PMID: 30103674 Free PMC article.
-
Shoot apical meristem form and function.Curr Top Dev Biol. 2010;91:103-40. doi: 10.1016/S0070-2153(10)91004-1. Curr Top Dev Biol. 2010. PMID: 20705180 Review.
-
Grass meristems I: shoot apical meristem maintenance, axillary meristem determinacy and the floral transition.Plant Cell Physiol. 2013 Mar;54(3):302-12. doi: 10.1093/pcp/pct025. Epub 2013 Feb 14. Plant Cell Physiol. 2013. PMID: 23411664 Review.
Cited by
-
Flowering time runs hot and cold.Plant Physiol. 2022 Aug 29;190(1):5-18. doi: 10.1093/plphys/kiac111. Plant Physiol. 2022. PMID: 35274728 Free PMC article. Review.
-
Complex Horticultural Quality Traits in Broccoli Are Illuminated by Evaluation of the Immortal BolTBDH Mapping Population.Front Plant Sci. 2019 Sep 18;10:1104. doi: 10.3389/fpls.2019.01104. eCollection 2019. Front Plant Sci. 2019. PMID: 31620146 Free PMC article.
-
Gene Co-expression Network Analysis of the Comparative Transcriptome Identifies Hub Genes Associated With Resistance to Aspergillus flavus L. in Cultivated Peanut (Arachis hypogaea L.).Front Plant Sci. 2022 Jun 15;13:899177. doi: 10.3389/fpls.2022.899177. eCollection 2022. Front Plant Sci. 2022. PMID: 35812950 Free PMC article.
-
Gene co-expression network analysis of the heat-responsive core transcriptome identifies hub genes in Brassica rapa.Planta. 2021 Apr 27;253(5):111. doi: 10.1007/s00425-021-03630-3. Planta. 2021. PMID: 33905008
-
Localized chilling of crowns promotes floral bud differentiation in strawberry transplants in a closed transplant production system.AoB Plants. 2025 Jan 27;17(2):plaf004. doi: 10.1093/aobpla/plaf004. eCollection 2025 Feb. AoB Plants. 2025. PMID: 39926203 Free PMC article.
References
-
- Shapiro TA, Fahey JW, Wade KL, Stephenson KK, Talalay P. Human metabolism and excretion of cancer chemoprotective glucosinolates and isothiocyanates of cruciferous vegetables. Cancer Epidemiol Biomark Prev. 1998;7:1091–1100. - PubMed
MeSH terms
Grants and funding
LinkOut - more resources
Full Text Sources
Molecular Biology Databases
