Review
. 2019 Jan 3;16(1):2.
doi: 10.1186/s12984-018-0458-8.

Mobility related physical and functional losses due to aging and disease - a motivation for lower limb exoskeletons

Affiliations
Review

Mobility related physical and functional losses due to aging and disease - a motivation for lower limb exoskeletons

Martin Grimmer et al. J Neuroeng Rehabil. .

Erratum in

Abstract

Background: Physical and functional losses due to aging and diseases decrease human mobility, independence, and quality of life. This study is aimed at summarizing and quantifying these losses in order to motivate solutions to overcome them with a special focus on the possibilities by using lower limb exoskeletons.

Methods: A narrative literature review was performed to determine a broad range of mobility-related physical and functional measures that are affected by aging and selected cardiovascular, respiratory, musculoskeletal, and neurological diseases.

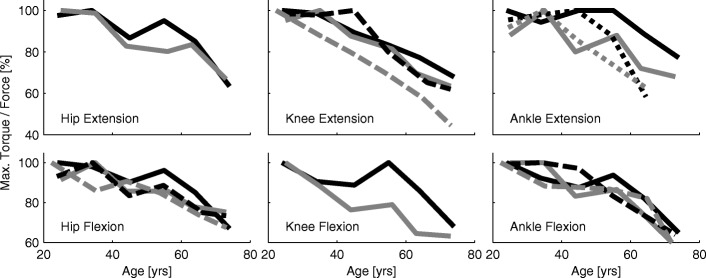
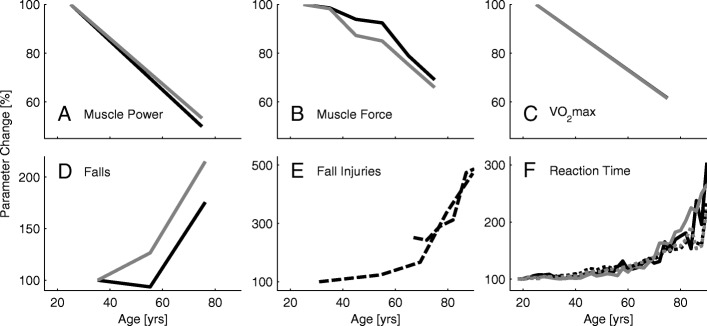
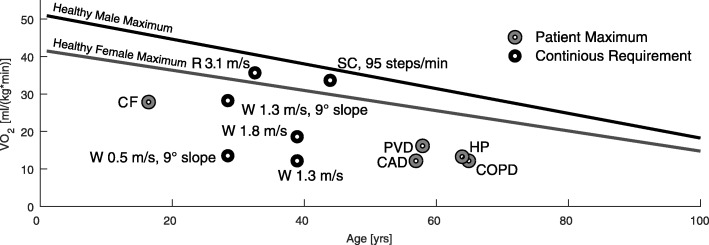
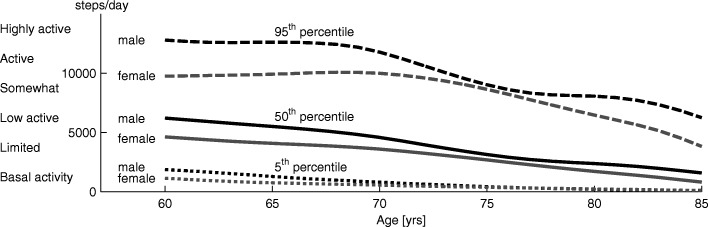
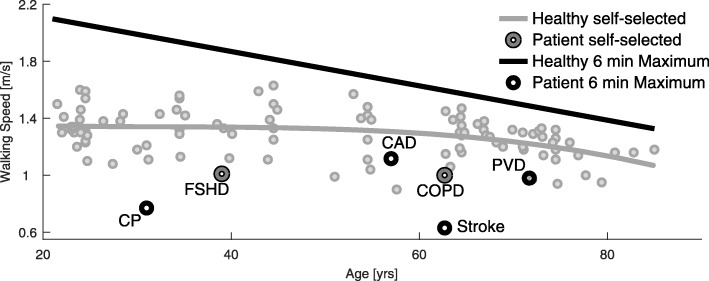
Results: The study identified that decreases in limb maximum muscle force and power (33% and 49%, respectively, 25-75 yrs) and in maximum oxygen consumption (40%, 20-80 yrs) occur for older adults compared to young adults. Reaction times more than double (18-90 yrs) and losses in the visual, vestibular, and somatosensory systems were reported. Additionally, we found decreases in steps per day (75%, 60-85 yrs), maximum walking speed (24% 25-75 yrs), and maximum six-minute and self-selected walking speed (38% and 21%, respectively, 20-85 yrs), while we found increases in the number of falls relative to the number of steps per day (800%), injuries due to falls (472%, 30-90 yrs) and deaths caused by fall (4000%, 65-90 yrs). Measures were identified to be worse for individuals with impaired mobility. Additional detrimental effects identified for them were the loss of upright standing and locomotion, freezing in movement, joint stress, pain, and changes in gait patterns.

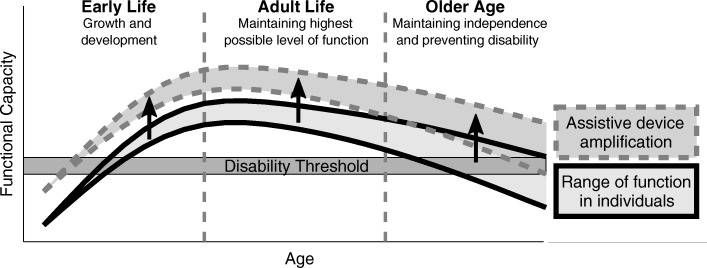
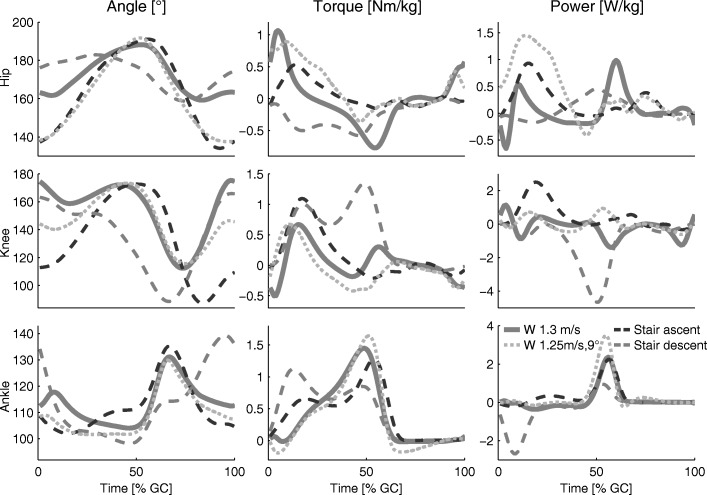
Discussion: This review shows that aging and chronic conditions result in wide-ranging losses in physical and sensory capabilities. While the impact of these losses are relatively modest for level walking, they become limiting during more demanding tasks such as walking on inclined ground, climbing stairs, or walking over longer periods, and especially when coupled with a debilitating disease. As the physical and functional parameters are closely related, we believe that lost functional capabilities can be indirectly improved by training of the physical capabilities. However, assistive devices can supplement the lost functional capabilities directly by compensating for losses with propulsion, weight support, and balance support.

Conclusions: Exoskeletons are a new generation of assistive devices that have the potential to provide both, training capabilities and functional compensation, to enhance human mobility.

Keywords: Aging; Assistance; Exoskeleton; Impaired; Mobility; Motivation; Walking.


Conflict of interest statement

Ethics approval and consent to participate

Not applicable.

Consent for publication

All authors gave their final approval of the submitted version.

Competing interests

The authors declare that they have no competing interests.

Publisher’s Note

Springer Nature remains neutral with regard to jurisdictional claims in published maps and institutional affiliations.

Figures

Fig. 1
Fig. 1
Functional capacity over the course of life. Changes in the environment can lower the disability threshold. Assistive devices provide the potential to increase the level of function for all age groups. Thus, fewer individuals would fall below the disability threshold for certain capabilities (modified from [165])
Fig. 2
Fig. 2
Torque and force development. Maximum torque and maximum force development for the hip, the knee, and the ankle extension and flexion with increasing age. Solid lines contain data published by Harbo et al. [39] (178 subjects, 15 to 83 yrs, isokinetic peak torque). Dashed lines contain data of Bohannon [40] (231 subjects, 20 to 79 yrs, hand held dynamometer peak force). Dotted lines contain data from Fugl-Meyer et al. [41] (135 subjects, 20 to 65 yrs, isokinetic peak torque). Black lines are for male, gray lines for female subject data
Fig. 3
Fig. 3
Summary of age related parameters. Changes with age in maximum muscle power (a), maximum muscle force (b), maximum oxygen consumption (c), self reported falls (d), injuries due to falls (e), and reaction time (f). Black lines represent male, gray lines female and dashed lines mixed groups. a Muscle power data was assessed by jumping mechanography (89 male, 169 female, 18-88 yrs) [46]. b Muscle force data is the mean of the curves presented in Fig. 2. c Maximum oxygen consumption was assessed in treadmill walking from (619 male, 497 female, 18-94 yrs) [54]. The relation of VO2max and age is described as y=51.23−0.33·x for males and y=41.74−0.27·x for females. d Changes in self reported falls (one minimum in the last two years) for three age groups in percent. Age means were 35.3 (20–45, n=292), 55.3 (46–65, n=616), and 76.2 (>65, n=589) years. The relative amount of male fallers is 16.8, 15.7, and 29.5 percent and of female fallers is 20, 25.3, and 43 percent with increasing age [118]. e Increases of injuries due to falls (survey, 30–90 yrs) for the Canadian (dashed, [123]) and the US (solid, [124]) population with 100% set for 30 years old of [124]. Absolute values are about 20 to 100 falls with injury per 1000 population for the 30 and 90 years old respectively. f Relative change with age (100% at 18 yrs) of single (dotted) and choice (solid) reaction time of 7130 subjects (18-90 yrs, [103]). Absolute values range from 287 ms to 872 ms for the single and 567 ms to 1129 ms for the choice reaction. Data was acquired using a single button that had to be pressed when showing a number in a display. Choice reaction time included pressing one out of four different buttons
Fig. 4
Fig. 4
Oxygen consumption in relation to age and for different activities and diseases. VO2max decreases for healthy males (black line) and healthy females (gray line) with age. Example requirements of continuous level and incline walking (W, [149, 150]), running (R, [151]), and climbing stairs [152] are indicated by a black circle. VO2max values for people with peripheral vascular disease (PVD, [60]), coronary artery disease (CAD, [58]), chronic obstructive pulmonary disease (COPD, [56]), and cystic fibrosis (CF, [57]) and hemiparesis (HP, [50]) are indicated by a gray circle. Age related trends for both genders are from linear fits of 619 males and 497 females with an age between 18 to 95 years [14]
Fig. 5
Fig. 5
Steps per day. Percentiles of steps per day for males (black) and females (gray) from the age of 60 to 85 years. Five percent of the population achieves less than the 5th percentile (dotted line) of steps per day, 50% is below the 50th percentile (solid), and 5% is above the 95th percentile (dashed). Data was taken from a US study [87] including results of 1196 60+ year old participants
Fig. 6
Fig. 6
Walking speed, age and diseases. Self-selected (gray line) and six-minute maximum walking speed (black line) in relation to age for healthy subjects and examples of populations with diseases. Age-related self-selected speed data (small gray circles) was extracted from 27 studies including 100 data points of speed and age (see Appendix Table 2 for details). A trend was illustrated using polynomial curve fitting. The six-minute walking speed was measured with the six-minute walking test where subjects were encouraged to achieve the maximum distance by walking as fast as possible. The curve is based on the equation derived by [64] (40-80 yrs, n=155) in combination with input values that represent mixed gender groups (1.72m, 72kg). Patient data represents self-selected walking speed (dark gray circle) for patients with FSHD [71] and very serve COPD [166]. Due to limited availability of self-selected speed data, for CP [73], CAD [58], PVD [69], and stroke [167] walking speed (self-selected) for the six-minute walking test is shown. The healthy self-selected speed has a polynomial of order 3: y=−0.00000176·x3+0.00017·x2−0.00576·x+1.408
Fig. 7
Fig. 7
Joint biomechanics. Hip, knee, and ankle biomechanics (angle, torque, and power) for one gait cycle of level walking (solid, 1.3 m/s, [169]), walking inclines (dotted, 1.25 m/s, 9°, [170]), and ascending (dashed, black) and descending (dashed gray) stairs [148]. For [170] and [148], joint torques and angles were digitized. Joint angular velocity and power were calculated using these values in combination with the published gait cycle time information [171]

References

    1. Moreau KL, Degarmo R, Langley J, McMahon C, Howley ET, Bassett DR, Thompson DL. Increasing daily walking lowers blood pressure in postmenopausal women. Med Sci Sports Exerc. 2001;33(11):1825–31. doi: 10.1097/00005768-200111000-00005. - DOI - PubMed
    1. Swartz AM, Strath SJ, Bassett DR, Moore JB, Redwine BA, Groër M, Thompson DL. Increasing daily walking improves glucose tolerance in overweight women. Prev Med. 2003;37(4):356–62. doi: 10.1016/S0091-7435(03)00144-0. - DOI - PubMed
    1. Bravata DM, Smith-Spangler C, Sundaram V, Gienger AL, Lin N, Lewis R, Stave CD, Olkin I, Sirard JR. Using pedometers to increase physical activity and improve health: a systematic review. JAMA. 2007;298(19):2296–304. doi: 10.1001/jama.298.19.2296. - DOI - PubMed
    1. Murtagh EM, Murphy MH, Boone-Heinonen J. Walking–the first steps in cardiovascular disease prevention. Curr Opin Cardiol. 2010;25(5):490. doi: 10.1097/HCO.0b013e32833ce972. - DOI - PMC - PubMed
    1. Erlichman J, Kerbey A, James W. Physical activity and its impact on health outcomes. paper 1: the impact of physical activity on cardiovascular disease and all-cause mortality: an historical perspective. Obes Rev. 2002;3(4):257–71. doi: 10.1046/j.1467-789X.2002.00077.x. - DOI - PubMed

Publication types