

Real-time H-scan ultrasound imaging using a Verasonics research scanner
- PMID: 30606648
- PMCID: PMC6467760
- DOI: 10.1016/j.ultras.2018.12.010
Real-time H-scan ultrasound imaging using a Verasonics research scanner
Abstract
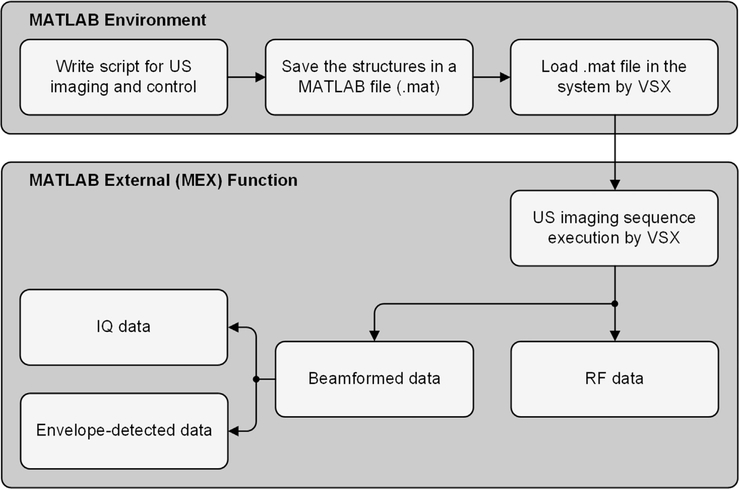
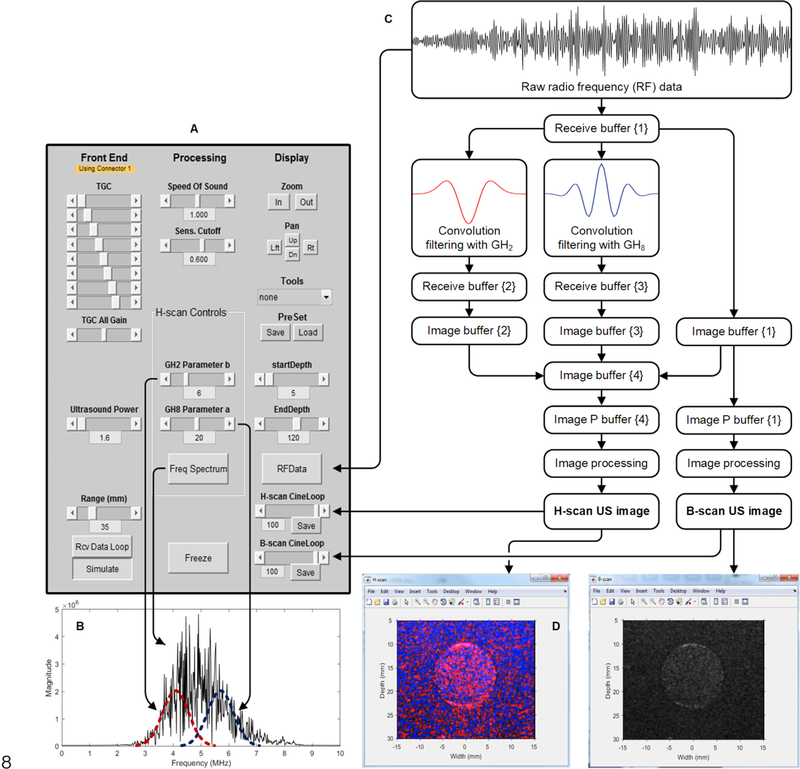
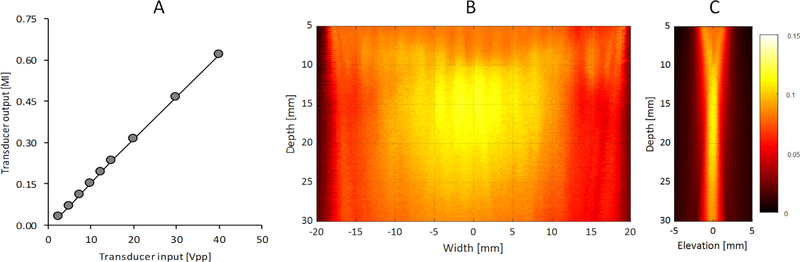
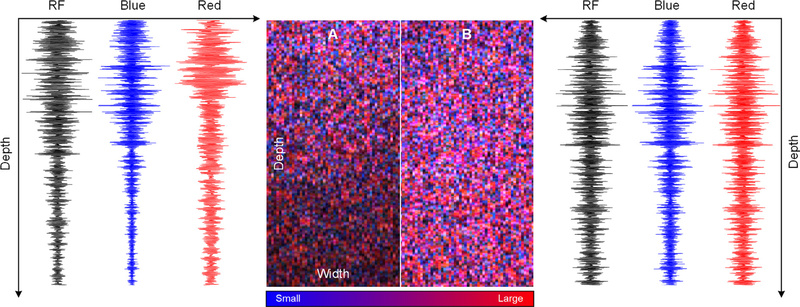
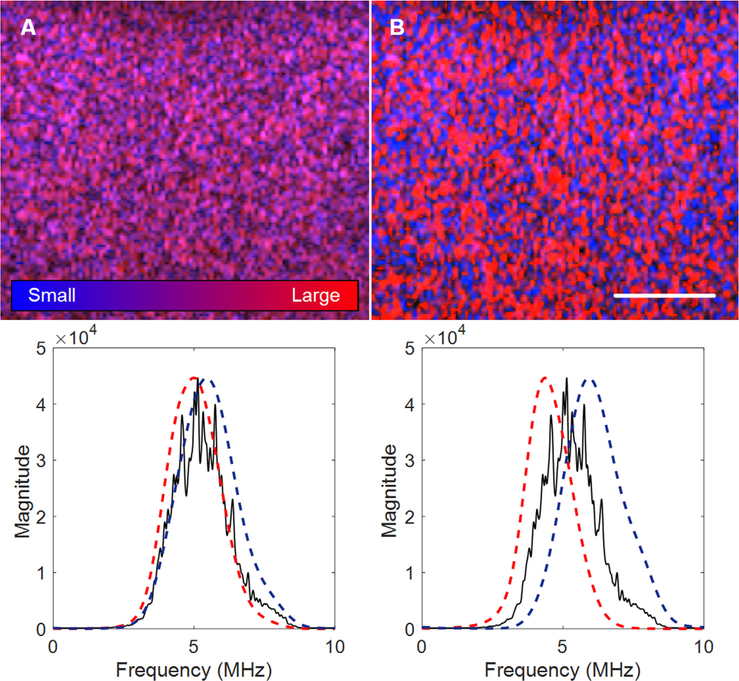
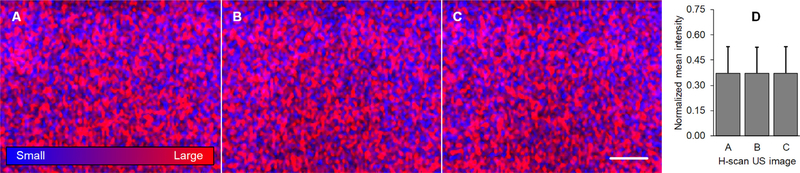
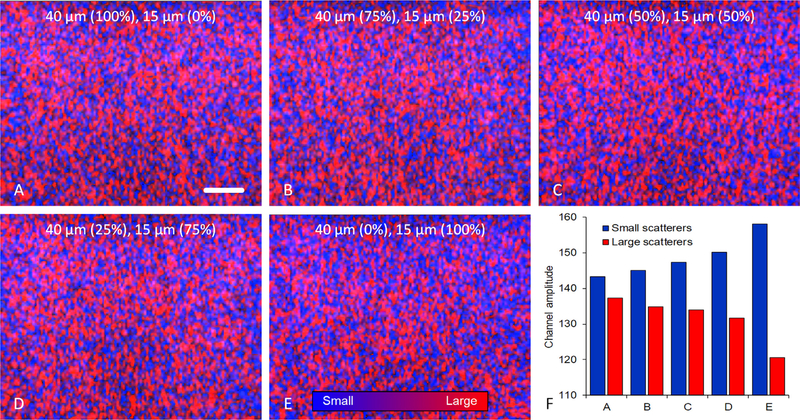
H-scan ultrasound (US) is a new imaging technique that relies on matching a model that describes US image formation to the mathematics of a class of Gaussian-weighted Hermite polynomials (GH). In short, H-scan US (where the 'H' denotes Hermite or hue) is a tissue classification technique that images the relative size of acoustic scatterers. Herein, we detail development of a real-time H-scan US imaging technology that was implemented on a programmable US research scanner (Vantage 256, Verasonics Inc, Kirkland, WA). This custom US imaging system has a dual display for real-time visualization of both the H-scan and B-scan US images. This MATLAB-based (Mathworks Inc, Natick, MA) system includes a graphical user interface (GUI) for controlling the entire US scan sequence including the raw radio frequency (RF) data acquisition parameters, image processing, variable control of a parallel set of convolution filters used to derive the H-scan US signal, and data (cine loop) save. The system-level structure used for software-based image reconstruction and display is detailed. Imaging studies were conducted using a series of homogeneous and heterogeneous tissue-mimicking phantom materials embedded with monodisperse spherical US scatterers of size 15-40 µm in diameter. Relative to H-scan US image measurements from a phantom with 15 µm-sized scatterers, data from phantoms with the 30 and 40 µm-sized scatterers exhibited mean intensity increases of 5.2% and 11.6%, respectively. Overall, real-time H-scan US imaging is a promising approach for visualizing the relative size and distribution of acoustic scattering objects.
Keywords: Acoustic scatterers; H-scan; Plane waves; Spatial angular compounding; Tissue characterization; Ultrasound.
Copyright © 2018. Published by Elsevier B.V.
Figures

Similar articles
-
3-D H-scan ultrasound imaging of relative scatterer size using a matrix array transducer and sparse random aperture compounding.Comput Biol Med. 2022 Dec;151(Pt B):106316. doi: 10.1016/j.compbiomed.2022.106316. Epub 2022 Nov 17. Comput Biol Med. 2022. PMID: 36442278 Free PMC article.
-
Spatial Angular Compounding Technique for H-Scan Ultrasound Imaging.Ultrasound Med Biol. 2018 Jan;44(1):267-277. doi: 10.1016/j.ultrasmedbio.2017.09.003. Epub 2017 Oct 12. Ultrasound Med Biol. 2018. PMID: 29031985 Free PMC article.
-
High-Resolution Ultrasound Characterization of Local Scattering in Cancer Tissue.Ultrasound Med Biol. 2023 Apr;49(4):951-960. doi: 10.1016/j.ultrasmedbio.2022.11.017. Epub 2023 Jan 19. Ultrasound Med Biol. 2023. PMID: 36681609 Free PMC article.
-
3-D H-Scan Ultrasound Imaging and Use of a Convolutional Neural Network for Scatterer Size Estimation.Ultrasound Med Biol. 2020 Oct;46(10):2810-2818. doi: 10.1016/j.ultrasmedbio.2020.06.001. Epub 2020 Jul 9. Ultrasound Med Biol. 2020. PMID: 32653207 Free PMC article.
-
Monitoring Early Breast Cancer Response to Neoadjuvant Therapy Using H-Scan Ultrasound Imaging: Preliminary Preclinical Results.J Ultrasound Med. 2019 May;38(5):1259-1268. doi: 10.1002/jum.14806. Epub 2018 Oct 2. J Ultrasound Med. 2019. PMID: 30280391 Free PMC article.
Cited by
-
H-Scan Ultrasound Monitoring of Breast Cancer Response to Chemotherapy and Validation With Diffusion-Weighted Magnetic Resonance Imaging.J Ultrasound Med. 2023 Jun;42(6):1297-1306. doi: 10.1002/jum.16143. Epub 2022 Dec 5. J Ultrasound Med. 2023. PMID: 36468546 Free PMC article.
-
3-D H-scan ultrasound imaging of relative scatterer size using a matrix array transducer and sparse random aperture compounding.Comput Biol Med. 2022 Dec;151(Pt B):106316. doi: 10.1016/j.compbiomed.2022.106316. Epub 2022 Nov 17. Comput Biol Med. 2022. PMID: 36442278 Free PMC article.
-
Adaptive attenuation correction during H-scan ultrasound imaging using K-means clustering.Ultrasonics. 2020 Mar;102:105987. doi: 10.1016/j.ultras.2019.105987. Epub 2019 Aug 23. Ultrasonics. 2020. PMID: 31477244 Free PMC article.
-
Contrast-enhanced ultrasound imaging using pulse inversion spectral deconvolution.J Acoust Soc Am. 2019 Oct;146(4):2466. doi: 10.1121/1.5129115. J Acoust Soc Am. 2019. PMID: 31671995 Free PMC article.
-
Challenges of conducting quantitative ultrasound with a multimodal optical imaging system.Phys Med Biol. 2021 Jan 26;66(3):035008. doi: 10.1088/1361-6560/abc93c. Phys Med Biol. 2021. PMID: 33171448 Free PMC article.
References
-
- Thijssen JM, Ultrasonic tissue characterisation and echographic imaging, Phys. Med. Biol 34 (1989) 1667–1674. - PubMed
-
- Hoyt K, Forsberg F, Ophir J, Analysis of a hybrid spectral strain estimation technique in elastography, Phys. Med. Biol 51 (2006) 197–209. - PubMed
-
- Hall CS, Verdonk ED, Wickline SA, Perez JE, Miller JG, Anisotropy of the apparent frequency dependence of backscatter in formalin fixed human myocardium, J. Acoust. Soc. Am 101 (1997) 563–568. - PubMed
Grants and funding
LinkOut - more resources
Full Text Sources
Other Literature Sources
