CDK phosphorylation of Xenopus laevis M18BP1 promotes its metaphase centromere localization
- PMID: 30606714
- PMCID: PMC6376277
- DOI: 10.15252/embj.2018100093
CDK phosphorylation of Xenopus laevis M18BP1 promotes its metaphase centromere localization
Abstract
Chromosome segregation requires the centromere, the site on chromosomes where kinetochores assemble in mitosis to attach chromosomes to the mitotic spindle. Centromere identity is defined epigenetically by the presence of nucleosomes containing the histone H3 variant CENP-A. New CENP-A nucleosome assembly occurs at the centromere every cell cycle during G1, but how CENP-A nucleosome assembly is spatially and temporally restricted remains poorly understood. Centromere recruitment of factors required for CENP-A assembly is mediated in part by the three-protein Mis18 complex (Mis18α, Mis18β, M18BP1). Here, we show that Xenopus M18BP1 localizes to centromeres during metaphase-prior to CENP-A assembly-by binding to CENP-C using a highly conserved SANTA domain. We find that Cdk phosphorylation of M18BP1 is necessary for M18BP1 to bind CENP-C and localize to centromeres in metaphase. Surprisingly, mutations which disrupt the metaphase M18BP1/CENP-C interaction cause defective nuclear localization of M18BP1 in interphase, resulting in defective CENP-A nucleosome assembly. We propose that M18BP1 may identify centromeric sites in metaphase for subsequent CENP-A nucleosome assembly in interphase.
Keywords: CENP‐A; CENP‐C; centromere; epigenetics.
© 2019 The Authors.
Figures
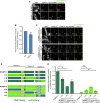
Full‐length M18BP1‐1 and M18BP1‐2 differ in their metaphase localization. Immunofluorescence images of M18BP1 isoform localization to metaphase sperm centromeres. The M18BP1 isoform is indicated to the left; immunolocalized protein is indicated above. Myc‐tagged, in vitro translated M18BP1‐1 or M18BP1‐2 was incubated with sperm chromatin in metaphase‐arrested Xenopus egg extract depleted of endogenous M18BP1. M18BP1‐1 localizes robustly to metaphase centromeres whereas M18BP1‐2 was only weakly detectable. This image represents the maximum amount of metaphase M18BP1‐2 localization observed. Scale bar, 10 μm. Insets are magnified 3×.
CENP‐A nucleosome binding‐deficient mutant of M18BP1‐1 remains at metaphase centromeres. Quantification of immunofluorescence intensity of full‐length Flag‐M18BP1‐1 (mutant species indicated at bottom) at metaphase centromeres normalized to WT. R774A shows 85 ± 2% of WT localization. Error bars represent SEM from two independent experiments. Significance determined by Welch's unpaired two‐tailed t‐test.
M18BP1‐2161–570 exhibits CENP‐C‐dependent localization to metaphase centromeres similar to M18BP1‐1161–580. Representative immunofluorescence images showing M18BP1 truncation localization (indicated at left) in metaphase extract depleted of endogenous M18BP1. In addition, extract was mock‐depleted or depleted of CENP‐C as indicated at left. Immunolocalized protein indicated above. Scale bar, 10 μm. Insets are magnified 3×. M18BP1‐1 images are the same as those in Fig 3E.
Schematic showing M18BP1 chimeras in which the indicated domains from M18BP1‐1 (dark green) were substituted into M18BP1‐2 (light green) and vice versa for assessing their role in metaphase centromere localization.
Quantification of metaphase centromere localization of M18BP1 chimeras in (D). M18BP1 species indicated at bottom. Graph shows mean centromere intensity normalized to M18BP1‐1WT. Error bars represent SEM from three independent experiments. Significance determined by Welch's unpaired two‐tailed t‐test, *P < 0.05, **P < 0.005.

Representative immunofluorescence images showing localization of Myc‐tagged M18BP1‐1 truncations schematized in (B) to metaphase sperm centromeres in M18BP1‐depleted extract. Truncations analyzed are indicated on the left; immunolocalized proteins are indicated above. Scale bar, 10 μm. Insets are magnified 3×.
Schematic of M18BP1‐1 truncations used to define the metaphase targeting domain in (A) and (C).
Quantification of the average Myc intensity at centromeres from (A). Values are normalized to centromeric signal of full‐length M18BP1‐1. Graph shows the mean ± SEM of at least three experiments. Significance determined by Welch's unpaired two‐tailed t‐test, *P < 0.05, **P < 0.005.

Alignment of SANTA domain among select eukaryotes. Red circles indicate conserved hydrophobic residues predicted to play a role in protein–protein interactions that were mutated in this study (Zhang et al, 2006). Darker shades of blue represent increased conservation of amino acids in alignment of ˜300 M18BP1 homologues. Secondary structure prediction was reported by Zhang et al (2006).
Representative Western blot showing disruption of the interaction between M18BP1‐1 and CENP‐C by mutation of the SANTA domain by co‐immunoprecipitation. Extract depleted of endogenous M18BP1 was supplemented with full‐length Flag‐M18BP1‐1WT or Flag‐M18BP1‐1SANTA. The M18BP1‐1 species added to each reaction, and the cell cycle state of the extract is indicated above. The immunoblotted species is indicated at left. Mock precipitations using rabbit reticulocyte lysate without any in vitro translated protein served as a negative control.
Representative images showing that mutation of the SANTA domain in M18BP1‐1 causes decreased localization to sperm centromeres. Metaphase extracts were depleted of endogenous M18BP1 and either mock‐depleted or depleted of CENP‐C. The extracts were then complemented with WT or SANTA mutant M18BP1‐1. M18BP1‐1 species and depletion conditions are indicated at left; immunolocalized proteins are indicated above. Scale bar, 10 μm. Insets are magnified 3×.
Quantification of the average Flag‐M18BP1‐1 intensity at centromeres from (C). Values are normalized to centromeric signal of M18BP1‐1WT in mock‐depleted extract. Graph shows the mean ± SEM of three experiments. Significance determined by Welch's unpaired two‐tailed t‐test, **P < 0.005.
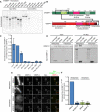
A representative autoradiograph from a GST‐pulldown of CENP‐C to map the CENP‐C binding domain of M18BP1‐1. Radiolabeled Myc‐M18BP1‐1 truncations (amino acids indicated at the top) were mixed with recombinant GST‐CENP‐C1191–1400. Material bound to glutathione agarose was resolved by SDS–PAGE and visualized by autoradiography (see also Fig EV2).
Schematic showing the cognate binding domains on M18BP1‐1 (top) and CENP‐C (bottom), indicated by the black boxes, relative to other functional domains.
Quantification of (A). Bound material as a fraction of the input was calculated from autoradiographs. The graph shows mean fraction bound ± SD of three independent experiments normalized to M18BP1‐1161–580, the CENP‐C binding domain.
Representative Western blot showing metaphase‐specific binding of M18BP1‐1161–580 to CENP‐C by co‐immunoprecipitation. Extract depleted of endogenous M18BP1 was supplemented with full‐length Myc‐M18BP1‐1 or Myc‐M18BP1‐1161–580. M18BP1‐1 species added to each reaction and cell cycle state of the extract is indicated above. Immunoblotted species indicated at left. Mock precipitations using rabbit reticulocyte lysate without any in vitro translated protein served as a negative control.
Representative immunofluorescence images showing Myc‐M18BP1‐1161–580 localization at sperm centromeres in extract depleted of endogenous M18BP1. In addition, extract was mock‐depleted or immunodepleted of CENP‐C (indicated at left). Cell cycle state indicated at left, immunolocalized protein indicated above. Scale bar, 10 μm. Insets magnified 3×.
Quantification of (E). Graph shows mean Myc‐M18BP1‐1161–580 intensity at centromeres ± SEM of two independent experiments normalized to the mock‐depleted, metaphase condition.
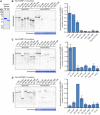
Coomassie‐stained gel showing the purity of the GST‐xlCENP‐C1191–1400 and GST‐hsCENP‐C723–943 proteins used for in vitro binding assays.
Reproduction of the representative GST‐pulldown data from Fig 3 which includes the Coomassie stain showing equivalent recovery of GST‐CENP‐C1191–1400 for all truncations analyzed (left). Bound material as a fraction of the input was calculated from autoradiographs. The graph shows mean fraction bound ± SD of three independent experiments normalized to M18BP1‐1161–580, the CENP‐C binding domain of M18BP1‐1.
Gel and quantification of GST‐pulldown to map the CENP‐C binding domain of M18BP1‐2. Myc‐M18BP1‐2 truncations (amino acids indicated at the bottom) were translated in reticulocyte lysate in the presence of [35S]‐methionine and mixed with recombinant GST‐CENP‐C1191–1400. Material bound to glutathione agarose was resolved by SDS–PAGE and visualized by autoradiography to assess binding of M18BP1‐2 truncations. Bound material was quantified as in Fig 3B and normalized to M18BP1‐2161–570, the CENP‐C binding domain of M18BP1‐2. Notably, M18BP1‐2161–415 was not sufficient to bind CENP‐C (data not shown). Error bars represent SD of two independent experiments.
Gel and quantification of GST‐pulldown to map the CENP‐C binding domain of human M18BP1. Pulldowns were performed as in (C), except radiolabeled truncations were mixed with recombinant GST‐hCENP‐C723–943, the M18BP1‐binding domain on human CENP‐C. Data are normalized to M18BP1325–480, the CENP‐C binding domain on human M18BP1. Error bars represent SD of three independent experiments.
- A, B
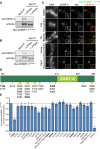
Metaphase binding of M18BP1‐1 to CENP‐C requires phosphorylation. Either full‐length Myc‐M18BP1‐1 (A) or Myc‐M18BP1‐1161–580 (B) was immunoprecipitated from metaphase extract. Half of the immunoprecipitate was treated with λ‐protein phosphatase (+ LPPase) to assess whether binding to CENP‐C required phosphorylation. Immunoprecipitation with an equivalent amount of mouse IgG served as a negative control. Immunoblotted species is indicated at left.
- C
Cdk inhibition with flavopiridol prevents M18BP1‐1161–580 localization at metaphase centromeres. Representative images showing Myc‐M18BP1‐1161–580 localization at sperm centromeres in metaphase extract depleted of endogenous M18BP1 following treatment with various mitotic kinase inhibitors. Inhibitor treatment is indicated at left, and immunolocalized protein is indicated above. Scale bar, 10 μm. Insets are magnified 3×. See Fig EV3 for demonstration of inhibitor efficacy.
- D
Schematic of phosphorylation sites in M18BP1‐1161–580 mutated for this study. M18BP1‐1 residue numbers indicated above. Positions of phosphorylation sites are indicated by orange lines and labels below. Bold indicates consensus Cdk phosphorylation sites.
- E
Quantification of immunofluorescence experiments examining localization of M18BP1‐1161–580 phosphorylation site mutants to sperm centromeres in metaphase extract depleted of endogenous M18BP1. Graph shows mean centromere intensity ± SEM of three independent experiments normalized to the WT condition. Significance determined by Welch's unpaired two‐tailed t‐test, *P < 0.05, **P < 0.005. See also Fig EV4B.

Pulldowns from metaphase or interphase extract depleted of M18BP1 with (+) or without (−) MBP‐M18BP1‐1161–580. (Top) Immunoblot showing that MBP‐M18BP1‐1161–580 specifically co‐immunoprecipitates CENP‐C from metaphase extract. (Bottom) Coomassie colloidal blue‐stained gel showing material precipitated with α‐MBP antibody‐coated beads. Red boxes indicate bands that were excised and submitted for mass spectrometry.
Immunoblot showing levels of MBP‐M18BP1‐1161–580 in M18BP1‐depleted extract relative to endogenous M18BP1 levels (undepleted, left lane). Non‐specific band recognized by α‐M18BP1 antibody indicated by asterisk. MBP‐M18BP1‐1161–580 was ˜56‐fold in excess of endogenous M18BP1.
Representative images showing spindle morphology in cycled metaphase egg extracts treated with DMSO or with the Polo kinase (Plx) inhibitor BI2536. Spindles in BI2536‐treated extract were largely monopolar or asymmetric whereas control extracts showed largely bipolar spindles, similar to the effect of Plx immunodepletion from metaphase egg extract (Budde et al, 2001). Scale bar, 10 μm.
Autoradiograph showing histone H1 phosphorylation by Cdk in control DMSO‐treated metaphase extracts or extracts treated with the Cdk inhibitor flavopiridol.
Western blot showing reduction in histone H3 serine 10 phosphorylation by Aurora kinase in extracts treated with ZM447439. See (Gadea & Ruderman, 2005)
Autoradiographs showing the change in Cdk activity (as determined by histone H1 phosphorylation) in control extracts with and without spindle assembly checkpoint activation brought about by treatment with nocodazole (top, DMSO‐treated). Declining Cdk activity despite nocodazole treatment after Mps1 inhibition (Reversine) indicates bypass of the spindle assembly checkpoint by these inhibitors. See Santaguida et al (2010).
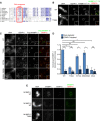
Conservation of the Xenopus T166 phosphorylation site. Alignment of M18BP1 sequences among select eukaryotes. Red box indicates the position of the Xenopus Cdk site, with conserved T‐P residues indicated in red. Darker shades of blue represent increased conservation of amino acids in alignment of ˜300 M18BP1 homologues.
Representative immunofluorescence images showing WT and T166A mutant M18BP1‐1161–580 localization at metaphase sperm centromeres (see Fig 4E). Mutant species indicated at left, immunolocalized protein indicated above. Scale bar, 10 μm. Insets are magnified 3×.
Representative immunofluorescence images showing localization of full‐length M18BP1‐1 phosphorylation site mutants to metaphase centromeres. M18BP1‐1 species indicated at left; immunolocalized species indicated above. Scale bar, 10 μm. Insets are magnified 3×.
Quantification of (C). Values are normalized to M18BP1‐1WT localization in mock‐depleted extract. Error bars represent SEM of three independent experiments. Significance determined by Welch's unpaired two‐tailed t‐test, *P < 0.05, **P < 0.005.
T166A mutation in M18BP1‐2 does not affect metaphase centromere localization. Metaphase, M18BP1‐depleted extract was supplemented with the M18BP1 species indicated at left and sperm chromatin. Immunolocalized protein indicated above. Scale bar, 10 μm.

Representative immunofluorescence images showing M18BP1‐1 mutant localization. M18BP1‐depleted metaphase extract was supplemented with in vitro translated full‐length Flag‐M18BP1‐1 mutants and sperm chromatin. In addition, extract was either mock‐depleted or CENP‐C depleted to assess CENP‐C dependent metaphase localization. M18BP1‐1 species and CENP‐C depletion status are indicated at left; immunolocalized protein is indicated above. Scale bar, 10 μm. Insets are magnified 3×.
Representative Western blot showing co‐immunoprecipitation of CENP‐C with phosphorylation site mutants of M18BP1‐1. M18BP1‐depleted metaphase or interphase extract was supplemented with in vitro translated Flag‐M18BP1‐1 mutants. M18BP1‐1 mutation and cell cycle state indicated above, and immunoblotted species indicated at right. Mock precipitations using rabbit reticulocyte lysate without any in vitro translated protein served as a negative control.
Quantification of (A). Flag‐M18BP1‐1 mutant centromere intensity normalized to WT localization in the mock‐depleted condition. Error bars represent SEM from three independent experiments. Significance determined by Welch's unpaired two‐tailed t‐test, **P < 0.005.
Model showing phosphorylation‐dependent binding of Xenopus M18BP1 to CENP‐C during mitosis (top) and the transition to CENP‐A‐dependent binding in interphase (bottom).

Representative immunofluorescence images showing incorporation of exogenous Myc‐CENP‐A at centromeres. Sperm nuclei were incubated in M18BP1‐depleted interphase Xenopus egg extracts complemented with the indicated M18BP1‐1 protein. Extracts were supplemented with RNA encoding Myc‐CENP‐A to track new CENP‐A assembly and in vitro translated HJURP. Scale bar, 10 μm. Insets are magnified 3×.
Quantification of Myc‐CENP‐A loading at Xenopus sperm centromeres in (A). Values are normalized to the centromere signals in mock‐depleted extract. Dashed lines indicate the Myc‐CENP‐A assembly signal observed upon M18BP1 depletion (bottom) and Flag‐M18BP1‐1WT add‐back (top) as points of reference for mutant rescue. Graph shows the mean ± SEM of four independent experiments. Significance determined by Welch's unpaired two‐tailed t‐test, *P < 0.05, **P < 0.005.
Interphase Mis18 complex formation is unaffected by M18BP1‐1 mutations that prevent binding to CENP‐C. Extract depleted of endogenous M18BP1 was supplemented with Myc‐Mis18α, Myc‐Mis18β, and Flag‐M18BP1‐1. M18BP1‐1 species added to each reaction, and cell cycle state of the extract is indicated at the top. Co‐immunoprecipitation of Myc‐Mis18α/β was assessed by α‐Myc immunoblot following Flag precipitation.
HJURP association with M18BP1‐1 is unaffected by mutations that prevent CENP‐C binding. Extract depleted of endogenous M18BP1 was supplemented with Flag‐M18BP1‐1. M18BP1‐1 species added to each reaction and cell cycle state of the extract are indicated at the top. Co‐immunoprecipitation of Flag‐M18BP1‐1 was assessed by α‐Flag immunoblot following HJURP precipitation.
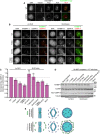
Representative images showing G1 localization of human M18BP1WT or human M18BP1SANTA in sfGFP‐AID‐M18BP1 DLD1 cells treated with 1 mM IAA for 24 h to remove endogenous M18BP1. Centromeric localization is indicated by localization with ACA (α‐centromere autoantibody serum); early G1 cell cycle state is indicated by midbody staining in the tubulin channel. M18BP1 species indicated at left; immunolocalized protein indicated above. Scale bar, 10 μm. Insets are magnified 3×.
Representative immunofluorescence images showing localization of full‐length Flag‐M18BP1‐1 (mutant species indicated at left) without (left panels) and with (right panels) fusion to an SV40 NLS to sperm centromeres in interphase extract depleted of endogenous M18BP1. Immunolocalized protein indicated above. Scale bar, 10 μm. Insets are magnified 3×. Quantification of immunofluorescence intensity at centromeres as total integrated fluorescence signal normalized to wild‐type levels. The values shown on each panel are represented as a percentage of wild‐type Flag‐M18BP1‐1 ± SEM from three independent experiments.
Quantification of Myc‐CENP‐A assembly in M18BP1‐depleted extract complemented with the indicated M18BP1‐1 species. Graph shows mean immunofluorescence intensity at centromeres normalized to reactions complemented with WT M18BP1‐1. Error bars show SEM of at least three independent experiments. Significance determined by Welch's unpaired two‐tailed t‐test, *P < 0.05, **P < 0.005.
Representative Western blot of CENP‐A assembly reactions in (B). Efficient M18BP1 depletion is indicated by comparing lanes 1 and 10. Add‐back of wild‐type or mutant M18BP1‐1 is near endogenous levels.
Model showing that metaphase localization of M18BP1 (green) promotes M18BP1 retention on chromosomes during nuclear envelope formation to promote centromeric localization during interphase.

Representative images of full‐length Flag‐M18BP1‐1WT or Flag‐M18BP1‐1T166A binding to CENP‐A chromatin‐coated beads in reticulocyte lysate. Scale bar, 5 μm.
Quantification of (A). Flag‐M18BP1‐1 fluorescence on beads was normalized to Myc‐H4 signal to control for the amount of chromatin coating each bead, and then, all conditions were normalized to WT. Error bars show SEM from three independent experiments. Significance determined by Welch's unpaired two‐tailed t‐test, ns: not significant, **P < 0.005.
Metaphase targeting mutants of M18BP1 show increased localization to interphase centromeres following CENP‐C depletion. French et al (2017) showed that this increase depends on the ability of M18BP1 to bind CENP‐A nucleosomes, suggesting that the T166A and SANTA mutations do not prevent CENP‐A nucleosome binding in extract. M18BP1‐1 mutant species indicated below. Values are normalized to M18BP1‐1WT in mock‐depleted interphase extract (dashed line). Error bars represent SEM of three independent experiments. Significance determined by Welch's unpaired two‐tailed t‐test, *P < 0.05, **P < 0.005.
Schematic showing nuclear transfer and permeabilization scheme to investigate regulation of M18BP1 nuclear localization. Sperm nuclei were prepared in mock‐depleted or M18BP1‐depleted interphase extract (1), recovered by centrifugation, permeabilized, and introduced into fresh mock‐depleted or M18BP1‐depleted interphase extract (2) to assay centromere localization.
Representative immunofluorescence images of experiment in (D) showing endogenous M18BP1 localization at sperm centromeres in untreated or lysolecithin‐permeabilized nuclei. Incubation scheme indicated at left. Left panels show M18BP1 localization in unpermeabilized nuclei; right panels show localization in lysolecithin‐permeabilized nuclei. Immunolocalized protein indicated above. Scale bar, 10 μm. Insets are magnified 4×.

Agarose gel showing genomic PCR to assess successful integration of the sfGFP‐AID tag at the endogenous M18BP1 locus. Presence of endogenous band only (944 bp) indicates no integration (+/+), presence of the sfGFP‐AID‐M18BP1 band only (2.5 kbp) indicates successful integration at both alleles (AID/AID), and presence of both bands indicates successful integration at only one allele (AID/+).
Immunoblot showing sfGFP‐AID‐M18BP1 degradation kinetics in the M18BP1AID/AID cell line following supplementation of the medium with 1 mM indole‐3‐acetic acid (IAA). Whole‐cell lysates were harvested at the indicated times following IAA addition and blotted for GFP‐tagged and total M18BP1. Immunoblotted species indicated at left.
Representative immunofluorescence images showing complete loss of G1 M18BP1 localization in the M18BP1AID/AID cell line within 1 h of IAA addition. Untreated cells are viable and show normal G1 localization of tagged M18BP1, indicating the tagged species remains functional. Midbody staining in the tubulin channel indicates early G1. ACA, α‐centromere autoantibody serum. Scale bar, 10 μm. Insets are magnified 3×.
Robust centromere localization of endogenous sfGFP‐AID‐M18BP1 was not observed prior to anaphase/telophase in M18BP1AID/AID cells. Cell cycle state indicated at left; immunolocalized protein indicated above. ACA, α‐centromere autoantibody serum. Scale bar 10 μm. Insets are magnified 3×.
Representative images showing G1 localization of humanM18BP1WT, M18BP1SANTA, or M18BP1 lacking the SANTA domain (M18BP1ΔSANTA) in sfGFP‐AID‐M18BP1 DLD1 cells treated with 1 mM IAA for 24 h to remove endogenous M18BP1. Scale bar, 10 μm. Insets are magnified 3×.
Immunoblot showing expression of mRuby2‐Flag‐tagged M18BP1 transgenes from (E). Immunoblotted species indicated at left; transgene indicated above. Transgenes are expressed at similar levels to each other (Flag blot), but are in vast excess of endogenous sfGFP‐AID‐M18BP1 levels (M18BP1 blot).
Quantification of M18BP1 intensity at G1 centromeres in (E). Mutation or deletion of the SANTA domain reduces centromere localization of M18BP1 regardless of the presence of endogenous M18BP1 (i.e., ±IAA). Negative values for M18BP1SANTA arise from background subtraction and reflect the fact that its localization is primarily cytosolic.
Quantification of percent midbody‐positive G1 cells in (E) showing detectable M18BP1 localization at centromeres. Similar to Stellfox Madison et al (2016), approximately half as many cells are positive for M18BP1ΔSANTA as for M18BP1WT. We observed no cells with centromeric M18BP1SANTA.
Quantification of M18BP1 intensity at centromeres in cells scored as positive for M18BP1 in (H).
Similar articles
-
Xenopus laevis M18BP1 Directly Binds Existing CENP-A Nucleosomes to Promote Centromeric Chromatin Assembly.Dev Cell. 2017 Jul 24;42(2):190-199.e10. doi: 10.1016/j.devcel.2017.06.021. Dev Cell. 2017. PMID: 28743005 Free PMC article.
-
CENP-C recruits M18BP1 to centromeres to promote CENP-A chromatin assembly.J Cell Biol. 2011 Sep 19;194(6):855-71. doi: 10.1083/jcb.201106079. Epub 2011 Sep 12. J Cell Biol. 2011. PMID: 21911481 Free PMC article.
-
Repression of CENP-A assembly in metaphase requires HJURP phosphorylation and inhibition by M18BP1.J Cell Biol. 2023 Jun 5;222(6):e202110124. doi: 10.1083/jcb.202110124. Epub 2023 May 4. J Cell Biol. 2023. PMID: 37141119 Free PMC article.
-
Orchestrating the Specific Assembly of Centromeric Nucleosomes.Prog Mol Subcell Biol. 2017;56:165-192. doi: 10.1007/978-3-319-58592-5_7. Prog Mol Subcell Biol. 2017. PMID: 28840237 Free PMC article. Review.
-
Putting CENP-A in its place.Cell Mol Life Sci. 2013 Feb;70(3):387-406. doi: 10.1007/s00018-012-1048-8. Epub 2012 Jun 23. Cell Mol Life Sci. 2013. PMID: 22729156 Free PMC article. Review.
Cited by
-
Mechanism of centromere recruitment of the CENP-A chaperone HJURP and its implications for centromere licensing.Nat Commun. 2019 Sep 6;10(1):4046. doi: 10.1038/s41467-019-12019-6. Nat Commun. 2019. PMID: 31492860 Free PMC article.
-
Plant kinetochore complex: composition, function, and regulation.Front Plant Sci. 2024 Oct 10;15:1467236. doi: 10.3389/fpls.2024.1467236. eCollection 2024. Front Plant Sci. 2024. PMID: 39464281 Free PMC article. Review.
-
Recurrent Plant-Specific Duplications of KNL2 and Its Conserved Function as a Kinetochore Assembly Factor.Mol Biol Evol. 2022 Jun 7;39(6):msac123. doi: 10.1093/molbev/msac123. Online ahead of print. Mol Biol Evol. 2022. PMID: 35671323 Free PMC article.
-
Gene replacement strategies validate the use of functional tags on centromeric chromatin and invalidate an essential role for CENP-AK124ub.Cell Rep. 2021 Nov 2;37(5):109924. doi: 10.1016/j.celrep.2021.109924. Cell Rep. 2021. PMID: 34731637 Free PMC article.
-
The N-terminal tail of C. elegans CENP-A interacts with KNL-2 and is essential for centromeric chromatin assembly.Mol Biol Cell. 2021 Jun 1;32(12):1193-1201. doi: 10.1091/mbc.E20-12-0798. Epub 2021 Apr 14. Mol Biol Cell. 2021. PMID: 33852350 Free PMC article.
References
-
- Blow JJ, Laskey RA (1988) A role for the nuclear envelope in controlling DNA replication within the cell cycle. Nature 332: 546–548 - PubMed
Publication types
MeSH terms
Substances
Grants and funding
LinkOut - more resources
Full Text Sources
Other Literature Sources

