. 2019 Feb 15;79(4):720-734.
doi: 10.1158/0008-5472.CAN-18-1791. Epub 2019 Jan 3.

SIX2 Mediates Late-Stage Metastasis via Direct Regulation of SOX2 and Induction of a Cancer Stem Cell Program

Affiliations

SIX2 Mediates Late-Stage Metastasis via Direct Regulation of SOX2 and Induction of a Cancer Stem Cell Program

Michael U J Oliphant et al. Cancer Res. .

Abstract

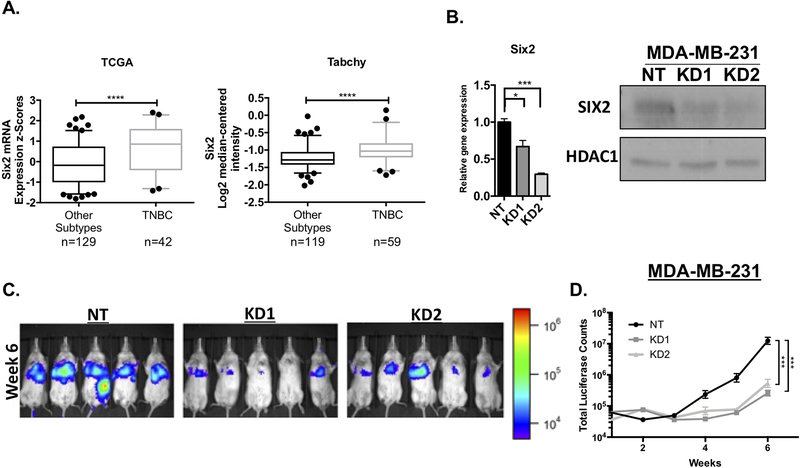
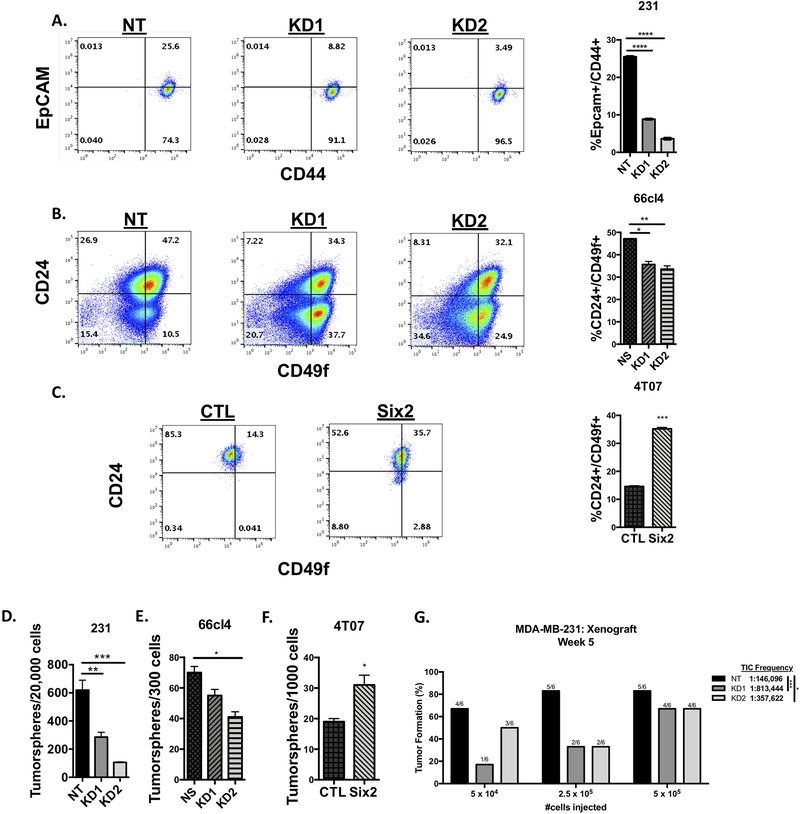
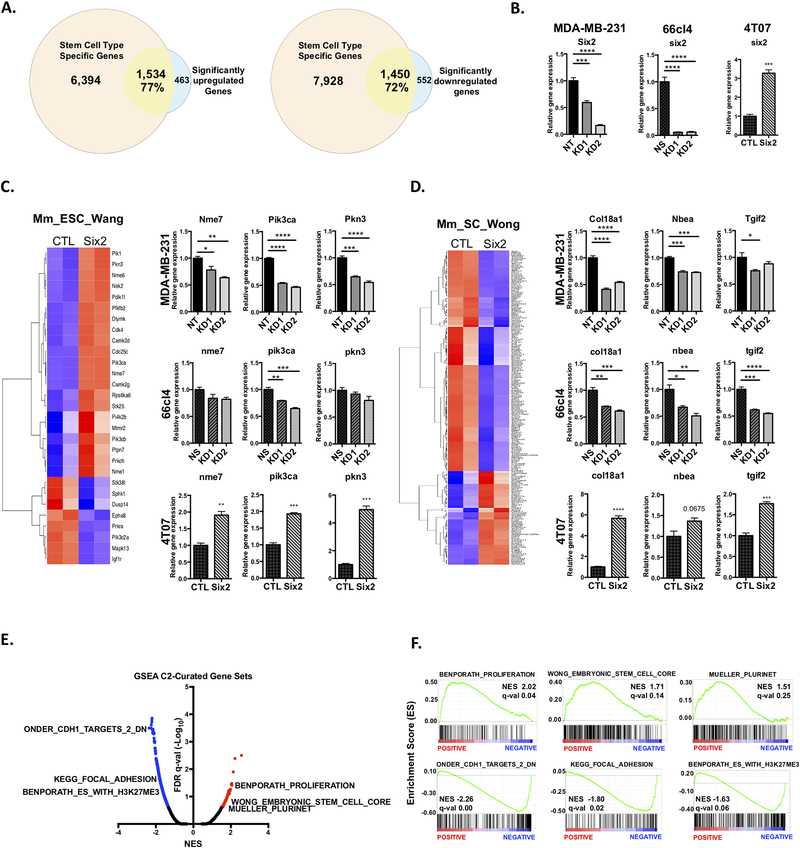
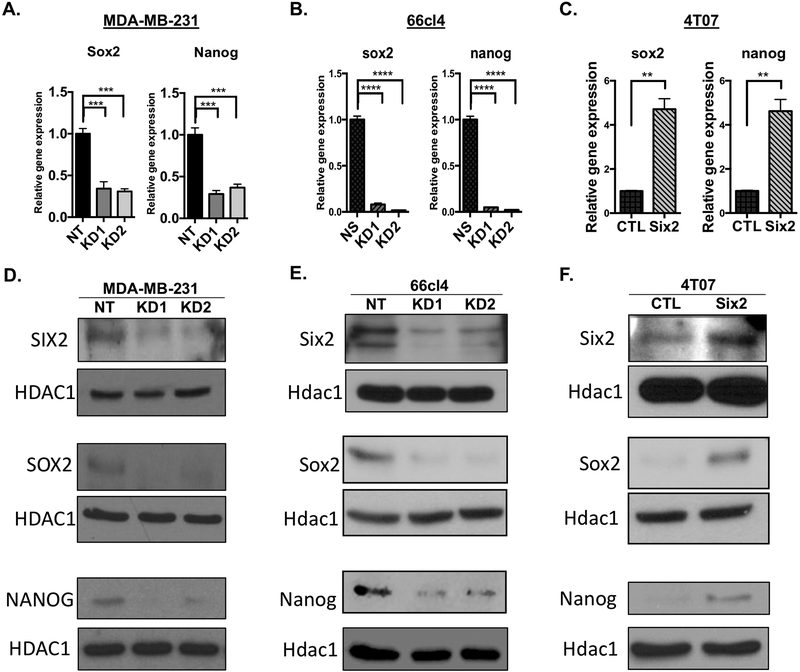
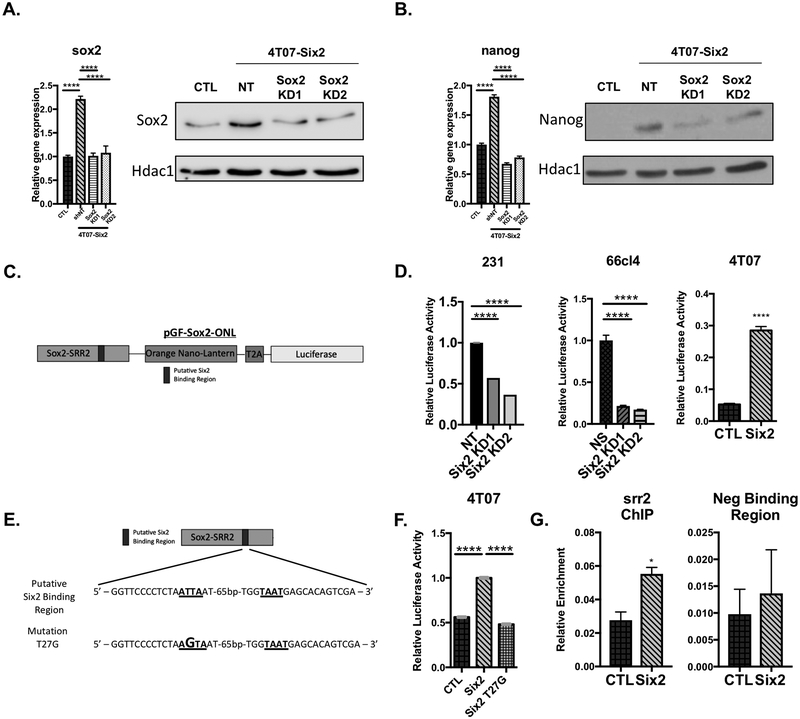
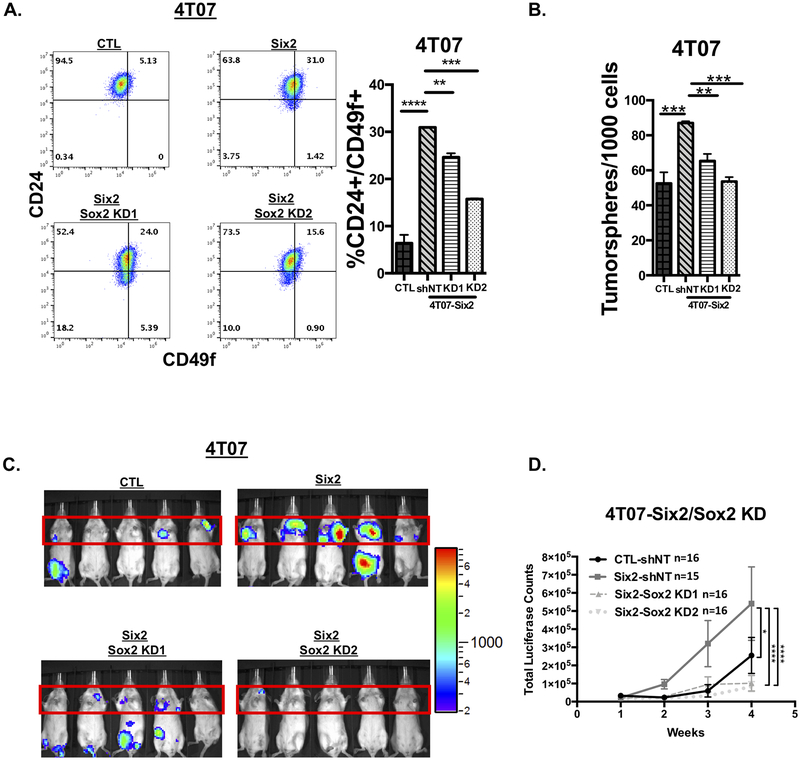
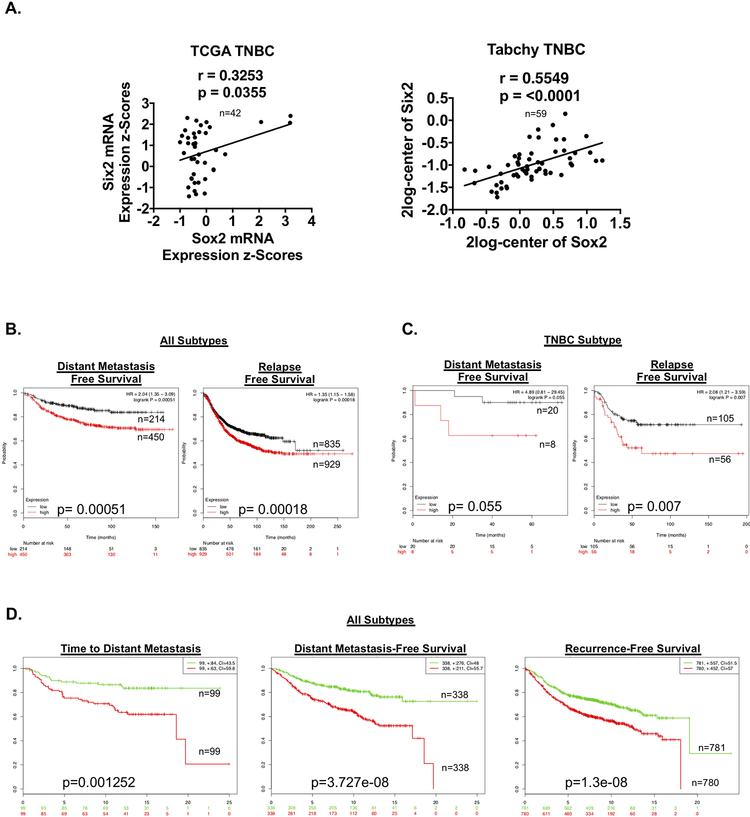
The capacity for tumor cells to metastasize efficiently is directly linked to their ability to colonize secondary sites. Here we identify Six2, a developmental transcription factor, as a critical regulator of a breast cancer stem cell program that enables metastatic colonization. In several triple-negative breast cancer (TNBC) models, Six2 enhanced the expression of genes associated with embryonic stem cell programs. Six2 directly bound the Sox2 Srr2 enhancer, promoting Sox2 expression and downstream expression of Nanog, which are both key pluripotency factors. Regulation of Sox2 by Six2 enhanced cancer stem cell properties and increased metastatic colonization. Six2 and Sox2 expression correlated highly in breast cancers including TNBC, where a Six2 expression signature was predictive of metastatic burden and poor clinical outcome. Our findings demonstrate that a SIX2/SOX2 axis is required for efficient metastatic colonization, underscoring a key role for stemness factors in outgrowth at secondary sites. SIGNIFICANCE: These findings provide novel mechanistic insight into stemness and the metastatic outgrowth of triple-negative breast cancer cells.Graphical Abstract: http://cancerres.aacrjournals.org/content/canres/79/4/720/F1.large.jpg.


Conflict of interest statement

Conflict of Interest Statement: The authors have declared that no conflict of interest exists.

Figures

Figure 1:
Figure 1:. Six2 expression is enriched in triple-negative breast cancer (TNBC) where it promotes metastasis.
A) Six2 mRNA expression in TNBC vs all other subtypes. Expression levels of Six2 obtained from the TCGA Cell 2015 (cbioportal) (Gao et al. 2013; Cerami et al. 2012) and Tabchy breast datasets (Oncomine) (Rhodes et al. 2004) B) Levels of Six2 mRNA (left) and protein (right) in non-targeting (NT) Control MDA-MB-231 cells and in Six2 KD MDA-MB-231 cells. Gene expression was normalized to Ppib mRNA expression and fold-change is relative to the NT cells. P-values were calculated using one-way anova followed by Bonferroni multiple comparisons test of triplicate samples in a representative experiment (n=3). For western blot analysis, nuclear extracts are shown with HDAC1 used as a loading control. C) Luciferase-labeled MDA-MB-231 NT, KD1 and KD2 cells were injected into NSG mice through the tail vein. Metastatic burden was measured by IVIS imaging. Luciferase images are of mice at the week 6 timepoint (n=5 mice/condition). D) Quantification of average whole-body luciferase signal (total luciferase counts) for each condition over the duration of the animal experiment, (n=5 mice/condition). P-values to determine differences in luciferase signal over time were calculated using mixed model effects interaction analysis followed by Bonferroni correction.
Figure 2:
Figure 2:. Six2 regulates stem cell-associated phenotypes in TNBC and mouse mammary carcinoma cells.
A) Six2 knockdown in MDA-MB-231 cells decreases the EpCam+/CD44+ population, as measured using flow cytometry. Quantification on the right is of triplicate samples for a representative experiment (n=3). Error bars represent the mean +/− SEM. P-values were calculated using one-way anova followed by a Bonferroni multiple comparisons test. B) six2 KD in 66cl4 cells decreases the CD24+/CD49f+ population, as measured using flow cytometry. Quantification and p-values were done as described above. C) Six2 overexpression in 4T07 cells increases the CD24+/CD49f+ population, as measured using flow cytometry. Quantification was performed as described above. P-values were calculated using an unpaired two-tailed t test. D) Six2 knockdown in MDA-MB-231 cells decreases tumorsphere formation when compared to control (NT) cells. Quantification on the right is of triplicate samples for a representative experiment (n=3). Error bars represent the mean +/− SEM. P-values were calculated using one-way anova followed by a Bonferroni multiple comparisons test. E) six2 knockdown in 66cl4 cells decreases tumorsphere formation when compared to control (NS) cells. Quantification and p-values were performed as described above. F) Six2 overexpression in 4T07 cells increases tumorsphere formation when compared to control cells. Quantification was performed as described above. P-values were calculated using an unpaired two-tailed t test. G) Six2 knockdown in MDA-MB-231 cells decreases tumor-initiating capacity compared to control (NT) cells. Cells were transplanted into the 4th mammary fat pad of nude mice at limiting dilutions. The graph displays the percentage of positive tumors at week 5 post tumor cell injection (n=6). Mean tumor-initiating cell (TIC) frequency was determined using the ELDA software program, with estimated ranges of TIC frequency being 72,956–292,560 for NT, 326,264–2,028,088 for KD1 and 175,059–730,575 for KD2.
Figure 3:
Figure 3:. Six2 regulates a transcriptional program associated with stemness.
A) Area-proportional Venn Diagram displaying percent overlap of significantly upregulated (left) or downregulated (right) genes with normal stem cell type signatures. B) RT-qPCR analysis measuring Six2 mRNA expression after KD (MDA-MB-231 and 66cl4) and OE (4T07). Gene expression was normalized to Ppib (human) or ppib (mouse) mRNA expression and fold-change is relative to the NT cells. P-values calculated using either One-way anova followed by Bonferroni multiple comparisons test or an unpaired two-tailed t test of triplicate samples for a representative experiment are shown (n=3). Heatmap and mRNA expression of significantly expressed genes from RNA-seq analysis that overlap with the C) Mm_ESC_Wang and D) Mm_SC_Wong gene signature. Only genes that met a fold-change of > or < 1.0 (Six2 OE/CTL) and adjusted p-value of < 0.1 after batch correction (limma package) were considered for generating heatmaps. Validation of mRNA expression was performed using RT-qPCR in MDA-MB-231, 66cl4 and 4T07 cells. Gene expression was normalized to Ppib mRNA expression and fold-change is relative to the non-targeting (NT), non-silencing (NS) or control (CTL) cells respectively. P-values were calculated using either one-way anova followed by Bonferroni multiple comparisons test or unpaired T-test on means +/− SEM of triplicate samples for a representative experiment (n=3). E) Volcano plot of false discovery rate (FDR q-val) versus normalized enrichment score (NES) after GSEA from RNA-seq data (Pre-ranked GSEA module). Red dots denote significantly positively enriched pathways and blue dots denote significantly negatively enriched pathways (0.25 FDR cutoff). F) GSEA enrichment plots for EMT-, adhesion- and stemness-associated pathways selected from the C2-Curated gene set. Black bars represent genes contained within the specific pathway and are ranked from positively expressed (left) to negatively expressed (right) based on log2 fold change (Six2 OE vs CTL).
Figure 4:
Figure 4:. Six2 regulates master pluripotency factors Sox2 and Nanog.
Sox2 and Nanog mRNA expression in the A) MDA-MB-231, B) 66cl4 and C) 4T07 cells. Gene expression was determined by RT-qPCR and normalized to Ppib mRNA expression. Fold-change is relative to the NT (MDA-MB-231 cells), NS (66cl4 cells) or CTL (4T07 cells). P-values determined using an unpaired T-test or one-way anova followed by Bonferroni multiple comparisons test of means +/− SEM of triplicate samples for a representative experiment (n=3). Six2 (top), Sox2 (middle) and Nanog (bottom) protein expression in D) MDA-MB-231, E) 66cl4 and F) 4T07 cells. Protein expression after nuclear extraction was determined by Western Blot Analysis with HDAC1/Hdac1 being used as a loading control (n=3).
Figure 5:
Figure 5:. Sox2 is upstream of Nanog and is directly regulated by Six2 via its SRR2 enhancer.
A) sox2 mRNA expression in 4T07-CTL, 4T07-Six2 and 4T07-Six2/Sox2 KD (KD1 and KD2) cells measured by RT-qPCR (left). Western blot analysis of Sox2 protein in 4T07-CTL, 4T07-Six2, and 4T07-Six2/Sox2 KD cells (right). Gene expression was determined using RT-qPCR and normalized to ppib mRNA expression. Fold-change is relative to 4T07-CTL cells. P-values were determined using a one-way anova followed by Bonferroni multiple comparisons test of means +/− SEM of triplicate samples for a representative experiment (n=3). Sox2 protein was determined using western blot analysis after whole cell extraction with Hdac1 used as a loading control. B) nanog mRNA expression in 4T07-CTL, 4T07-Six2 and 4T07-Six2/Sox2 KD (KD1 and KD2) cells measured by RT-qPCR (left). Gene expression was determined by RT-qPCR and normalized to ppib mRNA expression. Fold-change is relative to 4T07-CTL cells. P-values were determined as described above of triplicate samples for a representative experiment (n=3). Nanog protein was determined as described above (right). C) Diagram of pGF-Sox2-ONL luciferase reporter plasmid used in luciferase assays. Darker rectangle denotes putative Six2 binding region (T2A, encodes self-cleaving peptide sequence; ONL, Orange NanoLantern). D) pGF-Sox2-ONL luciferase assays performed in MDA-MB-231 +/− Six2 KD, 66cl4 +/− Six2 KD and 4T07 +/− Six2 OE cells 72h after transfection. P-values determined using an unpaired T-test or one-way anova followed by Bonferroni multiple comparisons test of means +/− SEM of triplicate samples in a representative experiment (n=3). E) Sequence of WT Six2 binding region (underlined) within SRR2 enhancer region. Bottom sequence depicts the mutant version of the SRR2 enhancer (mutation in larger font) (T27G) used in the luciferase experiment. F) Luciferase reporter assay using WT and T27G Sox2-ONL luciferase reporter plasmids in 4T07-CTL and Six2 cells. P-values were determined as described above of triplicate samples in a representative experiment (n=3). G) ChIP-qPCR analysis of 4T07-CTL and -Six2 cells. ChIP-enriched DNA was quantified using RT-qPCR with primers surrounding the predicted Six2 binding region within the SRR2-enhancer. In a separate pulldown, Six2 binding at a downstream region that does not contain known Six2 binding sites was also examined. P-values were determined using an unpaired T-test of means +/− SEM of triplicate samples in a representative experiment (n=3).
Figure 6:
Figure 6:. Sox2 mediates stem cell-associated phenotypes and late-stage metastasis downstream of Six2.
A) KD of sox2 in 4T07-Six2 cells decreases the CD24+/CD49f+ mouse mammary stem cell-like population when compared to 4T07-Six2 scramble control (shNT) cells as measured by flow cytometry. Quantification on the right is of triplicate samples for a representative experiment (n=3). Error bars represent the mean +/− SEM. P-values were calculated using one-way anova followed by a Bonferroni multiple comparisons test. B) sox2 KD in 4T07-Six2 cells decreases tumorsphere formation compared to 4T07-Six2 non-targeting shRNA (4T07-Six2 shNT) cells. Quantification and calculation of p-values were done as described above. C) Luciferase-labeled 4T07-CTL shNT, -Six2 shNT, -Six2/Sox2 KD1 and -Six2/Sox2 KD2 cells were injected into Balb/c mice through the tail vein. Metastatic burden was measured using IVIS imaging. Representative pictures of animals injected (n=16 per condition at Week 2 timepoint). D) Quantification of average +/− SEM lung luciferase signal for each condition over the duration of the animal experiment (n equals at least 15 per condition, as one 4T07-Six2 shNT mouse died after week 2). P-values to determine differences in luciferase signal over time were calculated using two-way anova followed by Bonferroni correction of average luciferase signal in each condition.
Figure 7:
Figure 7:. Six2 and Sox2 expression correlate in human breast cancer, and a Six2 gene expression signature is associated with poor prognosis.
A) Linear regression analysis demonstrating that Six2 and Sox2 mRNA significantly correlate in TNBC patient samples using both the TCGA Cell 2015 dataset and the Tabchy dataset (obtained from Oncomine). B) Distant-metastasis free and relapse-free survival in patients with high or low combined expression of the Six2 gene signature in all subtypes of breast cancer (KMPlotter). C) Distant-metastasis free and relapse-free survival of TNBC patients with high or low combined expression of the Six2 gene signature (KMPlotter, auto select was used for cutoff). D) Time to distant metastasis, Distant metastasis-free survival and recurrence-free survival from the Survexpress meta-analysis dataset of the Six2 Gene Signature (median cutoff).

Similar articles

Cited by

References

    1. Massagué J, Obenauf AC. Metastatic colonization by circulating tumour cells. Nature 2016;529:298–306. doi:10.1038/nature17038. - DOI - PMC - PubMed
    1. Chambers AF, Groom AC, MacDonald IC. Dissemination and growth of cancer cells in metastatic sites. Nat Rev Cancer 2002;2:563–72. doi:10.1038/nrc865. - DOI - PubMed
    1. Chambers AF, Naumov GN, Varghese HJ, Nadkarni KV, MacDonald IC, Groom AC. Critical steps in hematogenous metastasis: an overview. Surg Oncol Clin N Am 2001;10:243–55, vii. - PubMed
    1. Hüsemann Y, Geigl JB, Schubert F, Musiani P, Meyer M, Burghart E, et al. Systemic Spread Is an Early Step in Breast Cancer. Cancer Cell 2008;13:58–68. doi:10.1016/j.ccr.2007.12.003. - DOI - PubMed
    1. Fili S, Karalaki M, Schaller B. Mechanism of bone metastasis: The role of osteoprotegerin and of the host-tissue microenvironment-related survival factors. Cancer Lett 2009;283:10–9. doi:10.1016/j.canlet.2009.01.011. - DOI - PubMed

Publication types

MeSH terms