. 2019 Feb;29(2):223-235.
doi: 10.1101/gr.230243.117. Epub 2019 Jan 3.

An AR-ERG transcriptional signature defined by long-range chromatin interactomes in prostate cancer cells

Affiliations

An AR-ERG transcriptional signature defined by long-range chromatin interactomes in prostate cancer cells

Zhizhuo Zhang et al. Genome Res. 2019 Feb.

Abstract

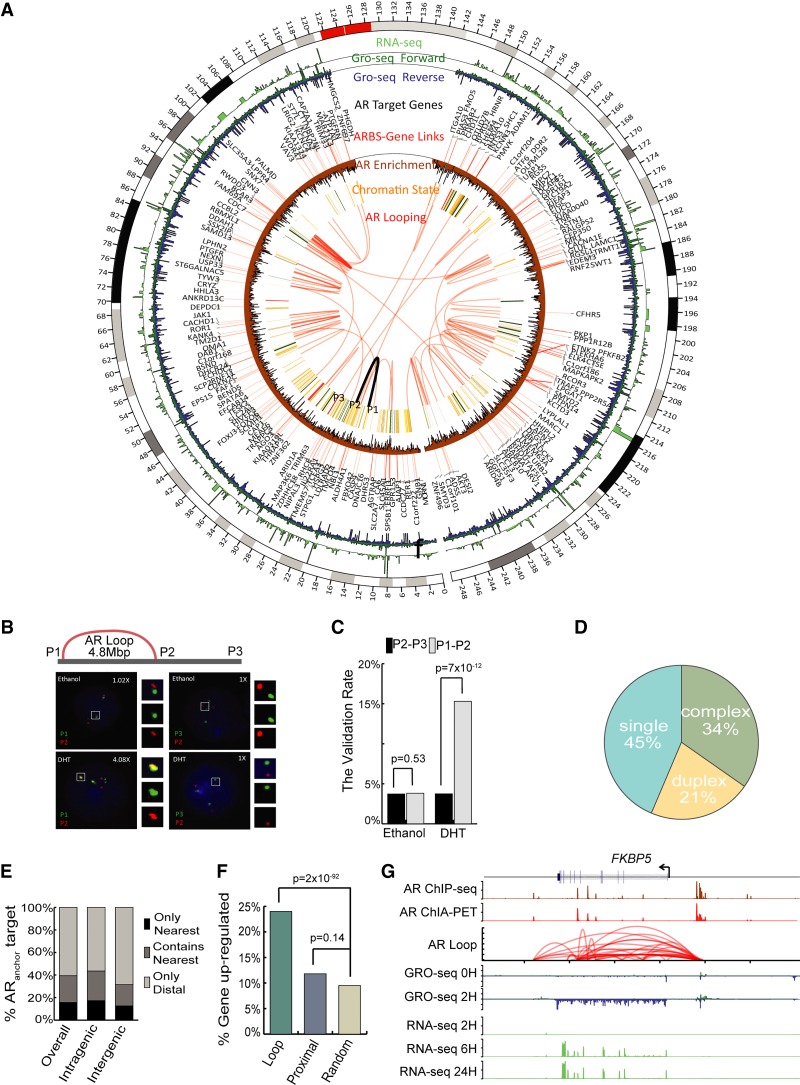
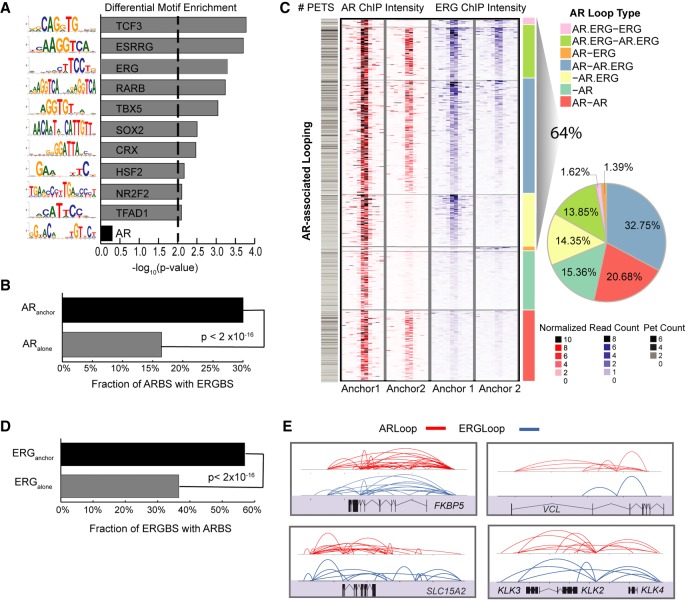
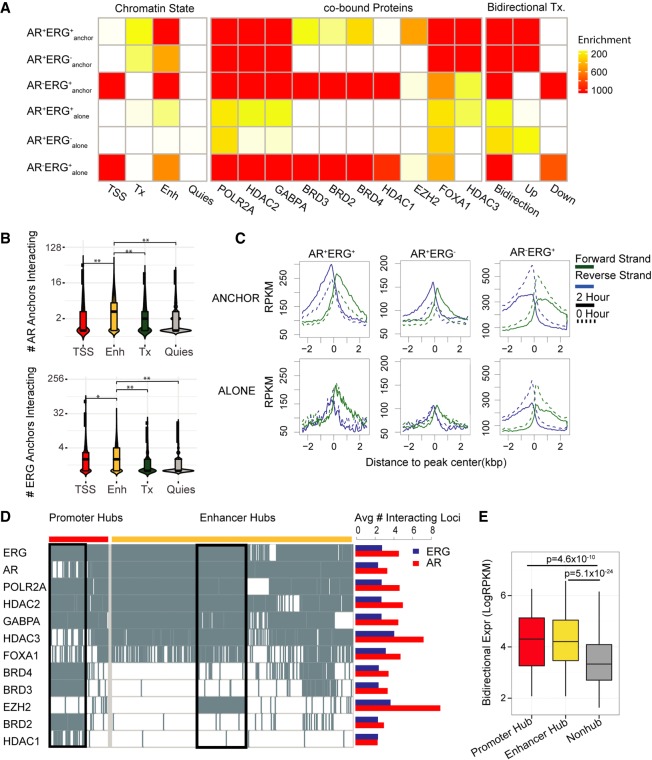
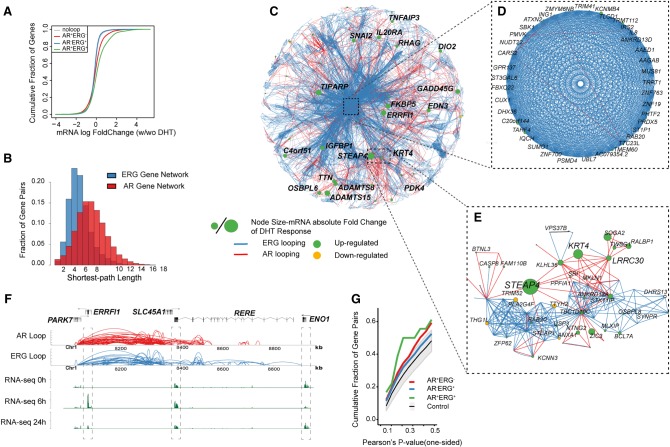
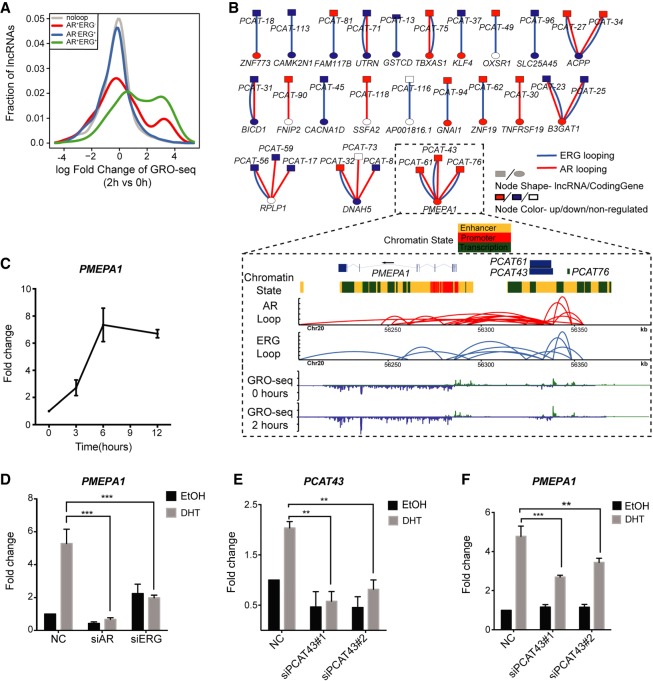
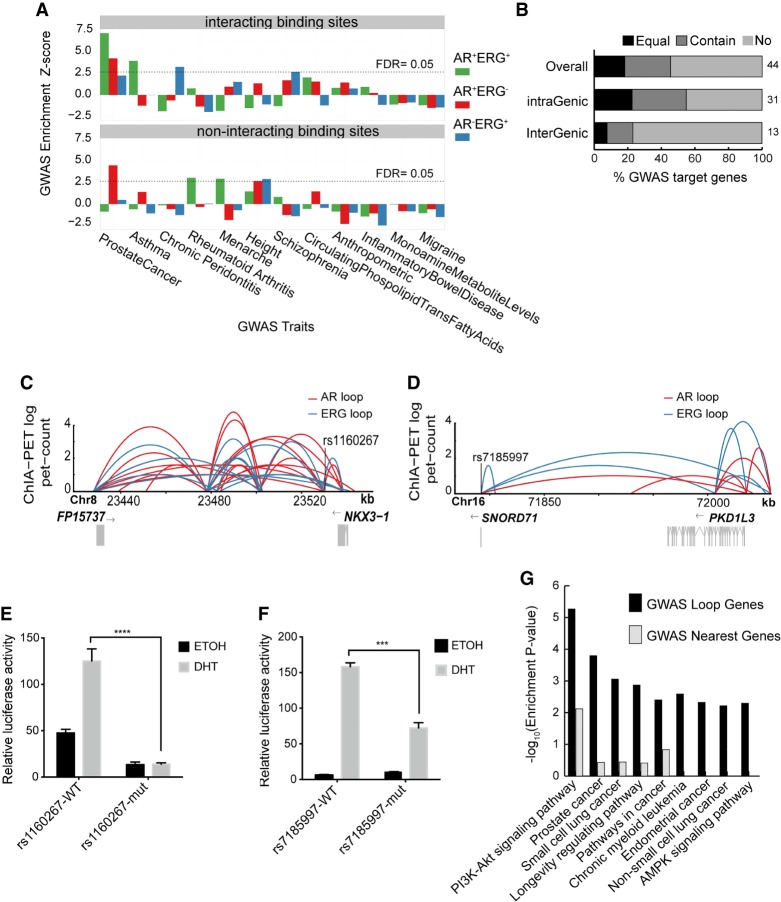
The aberrant activities of transcription factors such as the androgen receptor (AR) underpin prostate cancer development. While the AR cis-regulation has been extensively studied in prostate cancer, information pertaining to the spatial architecture of the AR transcriptional circuitry remains limited. In this paper, we propose a novel framework to profile long-range chromatin interactions associated with AR and its collaborative transcription factor, erythroblast transformation-specific related gene (ERG), using chromatin interaction analysis by paired-end tag (ChIA-PET). We identified ERG-associated long-range chromatin interactions as a cooperative component in the AR-associated chromatin interactome, acting in concert to achieve coordinated regulation of a subset of AR target genes. Through multifaceted functional data analysis, we found that AR-ERG interaction hub regions are characterized by distinct functional signatures, including bidirectional transcription and cotranscription factor binding. In addition, cancer-associated long noncoding RNAs were found to be connected near protein-coding genes through AR-ERG looping. Finally, we found strong enrichment of prostate cancer genome-wide association study (GWAS) single nucleotide polymorphisms (SNPs) at AR-ERG co-binding sites participating in chromatin interactions and gene regulation, suggesting GWAS target genes identified from chromatin looping data provide more biologically relevant findings than using the nearest gene approach. Taken together, our results revealed an AR-ERG-centric higher-order chromatin structure that drives coordinated gene expression in prostate cancer progression and the identification of potential target genes for therapeutic intervention.


Figures

Figure 1.
Figure 1.
The genome-wide AR interactome in prostate cancer cells. (A) Circos (Krzywinski et al. 2009) view of the AR interactome landscape in Chromosome 1. From innermost to outermost: (1) AR ultra-long-range looping (>1 Mbp), FISH-validated loops are highlighted in black, and the locations of the three FISH probes P1, P2, and P3 are annotated; (2) chromatin state track; (3) AR-Gene Linking; (4) AR target genes; (5) GRO-seq signal 2 h after DHT; (6) RNA-seq signal 6 h after DHT. (B) FISH analysis for the intra-Chromosome 1 interaction (16934619–21771843). (C) Summary of the validation rate of FISH experiments from examining 180 cells. (D) Breakdown of AR binding sites (ARBS) according to their associated type of chromatin interaction model classification from our previous study (Fullwood et al. 2009). (E) The fraction of ARanchor in either intra-genic regions or inter-genic regions whose targets genes were defined by ChIA-PET interaction matching the nearest gene. (Only Nearest) The nearest gene is the only target gene, (Contain Nearest) the nearest gene is one of the target genes, (Only Distal) the nearest gene is not one of the target genes. (F) Bar plot (Wickham 2009) showing the fraction of genes from different categories that are up-regulated after DHT. The genes with AR looping in their TSS show more up-regulation events than genes with only ARalone in proximal 5 kbp to TSS and random genes. (G) Snapshot representation (from top to bottom) of the AR binding peak profile (defined by ChIP-seq), AR self-ligation peak profile (defined by ChIA-PET), AR-associated chromatin interaction profile (defined by ChIA-PET), transcriptional rate profiles (defined by GRO-seq), and steady-state mRNA level profiles (defined by RNA-seq) associated with the androgen-regulated gene, FKBP5.
Figure 2.
Figure 2.
ERG binding is involved in AR-associated chromatin looping. (A) Bar chart showing the top 10 motifs enriched at interacting ARBS (ARanchor) compared to noninteracting ARBS (ARalone). There is no difference in AR motif enrichment between the two sets. (B) Fraction of ARanchor with colocalized ERGBS compared to ARalone. (C) Left: Heat map depiction of the AR and ERG ChIP intensity (±5 kbp) centered at AR anchor pairs. Each row is one AR loop represented by two anchor regions, and AR loops are classified into seven categories based on the occupancy status of AR and ERG at both anchors. Right: Pie-chart summarizing the fraction of different categories. (D) Fraction of interacting ERGBS (ERGanchor) with colocalized ARBS compared to noninteracting ERGBS (ERGalone). (E) Snapshots depicting the interconnectivity of AR/ERG-associated chromatin interactions at model androgen-regulated genes.
Figure 3.
Figure 3.
Regulatory signatures of the AR and ERG interactome in prostate cancer. (A) Dissecting AR/ERG binding sites into six categories based on AR/ERG binding status and whether the binding sites associate with either AR loops or ERG loops. The left heat map presents enrichment of different chromatin states in the six categories of AR/ERG binding. The middle heat map presents enrichment of cotranscription factor ChIP-seq peak regions in VCaP cells. The three columns of the right heat map present enrichment of regions with bidirectional transcription 2 h after DHT treatment, with increasing bidirectional transcription in the middle column and decreasing bidirectional transcription on the right. The enrichment was computed as the negative log binomial P-value of the overlapping fraction of peaks in a given category (row) with the given annotation feature (column). The ENCODE combined DNase peaks (open chromatin) overlapping fractions are used as the null distribution. (B) Distribution of the number of interacting anchors comprising four different chromatin states in the AR anchored network (top) and ERG network (bottom). The Wilcoxon rank-sum test was applied to test if the number of anchors in the enhancer state is higher than other chromatin states. (*) P-value = 1.6 × 10⁻⁷, (**) P-value < 2.2 × 10⁻¹⁶. (C) GRO-seq profile around six categories of AR/ERG binding sites. The forward strand GRO-seq signal is presented in green and the reverse strand in blue. The dashed line represents the GRO-seq signal before DHT treatment, and the solid line represents the GRO-seq signal 2 h after DHT treatment. (D) Left: Binary heat map representation of the distribution of listed transcription factor binding sites in promoter and enhancer hub regions. Each column represents one genomic region, with rows representing TF binding sites. The black boxes illustrate two TF clusters in promoter hub regions and enhancer hub regions. Right: Bar plot shows the average number of interacting loci for the AR (red) or ERG (blue) anchor regions with different TF binding. (E) Box plot showing the average bidirectional expression level (2 h after DHT treatment) of promoter hub regions (red), enhancer hub regions (yellow), and nonhub anchor regions (gray). The bidirectional expression level is defined by the minimum reads per kilobase per million mapped reads (RPKM) of two strands.
Figure 4.
Figure 4.
Transcriptome network defined AR and ERG interactome in prostate cancer. (A) Distribution of mRNA expression changes at 0 and 2 h after DHT treatment. mRNA changes are classified into four categories depending on the association with different types of loops. The x-axis shows the log fold change of the gene expression by RNA-seq data, and the y-axis is the cumulative fraction of genes in the given gene categories. (B) The distribution of shortest path lengths between any two genes in the AR or ERG loop defined gene networks. (C) Cytoscape (Shannon et al. 2003) map of the largest connected component of the gene network defined by both AR and ERG associated loops. Each node is a gene, and the node size represents the absolute log fold change of the mRNA expression at 0 and 2 h after DHT treatment. The edge color represents either AR looping (red) or ERG looping (blue). (D) A zoomed view of a core gene network showing 39 genes highly inter-connected by ERG loops and a few AR loops. (E) Zoomed in subnetwork view of the neighborhood of genes with STEAP4. (F) A browser track view of genes linked by AR-ERG co-associated looping. From top to bottom: the gene track, AR looping track, ERG looping track, RNA-seq signal at 0 h, RNA-seq signal at 6 h, and RNA-seq signal at 24 h after DHT treatment. (G) Cumulative fraction of gene pairs against the Pearson's correlation P-value of their expression across four time points after DHT treatment (based on microarray data). The P-value is one-sided and the alternative hypothesis is that the correlation is greater than zero. The green curve is for gene pairs linked by AR-ERG co-associated looping, the red curve is for gene pairs linked by AR looping only, and the blue curve is for gene pairs linked by ERG loops only. The gray color band denotes the 95% confidence interval of the same number of randomly selected gene pairs as in the AR-ERG co-association.
Figure 5.
Figure 5.
Functional relationship between lncRNA and chromatin loops in the AR-ERG transcriptional network. (A) Distribution of lncRNA expression change from 0 to 2 h after DHT treatment as measured by GRO-seq. Genes were classified into four categories depending on their association with different loop types. The x-axis shows the log fold change of the lncRNA expression, and the y-axis is the fraction of genes in the given lncRNA categories. (B) Bipartite graph linking clinically relevant lncRNAs to coding genes by AR/ERG looping. The node shape indicates the molecule type (lncRNA or coding gene), and the node color represents a more than 1.5-fold expression increase (red) or decrease (blue) after DHT treatment. Lower panel: An example showing three clinically relevant lncRNAs linked to the gene PMEPA1 by AR-ERG co-associated looping. Snapshot representation of (from top to bottom) gene track and ChromHMM track, the ERG and AR loops (defined by ChIA-PET), and transcriptional rate profiles before and after DHT (defined by GRO-seq). (C) Graph showing the time-dependent activation of PMEAP1 in VCaP cells after treatment with 10 nM DHT. (D) Bar graph showing the expression of PMEAP1 in VCaP cells transfected with siNC, siAR, or siERG and treated with DHT or EtOH for 6 h. (E) Transcribed from the same genomic region, PCAT43 and PCAT76 transcripts are indistinguishable from each other. Bar graph showing the efficiency of siRNA-mediated knockdown of PCAT43 in VCaP cells. (F) Graph showing the effect of PCAT43 knockdown on the androgen regulation of PMEAP1. VCaP cells transfected with siPCAT43 were treated with DHT or EtOH for 6 h.
Figure 6.
Figure 6.
Noncoding GWAS SNPs contribute to the risk of prostate cancer through AR/ERG chromatin interaction. (A) Graph showing the enrichment of different classes of AR/ERG binding sites in diverse GWAS traits. Upper panel: Examined regions with AR/ERG chromatin looping including AR-ERG cobinding sites (green), AR only binding sites (red), and ERG only binding sites (blue) with overlapping GWAS top loci. Lower panel: Similar to the upper panel but considered only regions without AR/ERG chromatin looping. (B) The fraction of prostate cancer GWAS loci in either intra-genic regions or inter-genic regions whose targets genes (defined by AR/ERG looping) match the nearest gene: The nearest gene is the only target gene (Equal), the nearest gene is one of the target genes (Contain), and the nearest gene is not a target gene (No). (C) Prostate cancer associated GWAS SNP rs1160267 linked to the NKX3-1 gene through AR/ERG chromatin looping. (D) Prostate cancer associated GWAS SNP rs7185997 linked to PDK1L3 gene through AR/ERG chromatin looping. (E) Luciferase assay activity before and after mutating the GWAS SNP rs1160267, which is located in the enhancer region of the NKX3-1 gene. (F) Luciferase assay activity before and after mutating GWAS SNP rs7185997, which is located in the enhancer region of PDK1L3 gene. (G) A list of the top 10 pathways enriched in prostate GWAS target genes defined by either using our chromatin looping data or the nearest gene method.

References

    1. Al Olama AA, Kote-Jarai Z, Berndt SI, Conti DV, Schumacher F, Han Y, Benlloch S, Hazelett DJ, Wang Z, Saunders E, et al. 2014. A meta-analysis of 87,040 individuals identifies 23 new susceptibility loci for prostate cancer. Nat Genet 46: 1103–1109. 10.1038/ng.3094 - DOI - PMC - PubMed
    1. Asangani IA, Dommeti VL, Wang X, Malik R, Cieslik M, Yang R, Escara-Wilke J, Wilder-Romans K, Dhanireddy S, Engelke, C, et al. 2014. Therapeutic targeting of BET bromodomain proteins in castration-resistant prostate cancer. Nature 510: 278–282. 10.1038/nature13229 - DOI - PMC - PubMed
    1. Berger MF, Lawrence MS, Demichelis F, Drier Y, Cibulskis K, Sivachenko AY, Sboner A, Esgueva R, Pflueger D, Sougnez C, et al. 2011. The genomic complexity of primary human prostate cancer. Nature 470: 214–220. 10.1038/nature09744 - DOI - PMC - PubMed
    1. Berndt SI, Wang Z, Yeager M, Alavanja MC, Albanes D, Amundadottir L, Andriole G, Beane Freeman L, Campa D, Cancel-Tassin G, et al. 2015. Two susceptibility loci identified for prostate cancer aggressiveness. Nat Commun 6: 6889 10.1038/ncomms7889 - DOI - PMC - PubMed
    1. Chen Y, Sawyers CL. 2010. Coordinate transcriptional regulation by ERG and androgen receptor in fusion-positive prostate cancers. Cancer Cell 17: 415–416. 10.1016/j.ccr.2010.04.022 - DOI - PMC - PubMed

Publication types

MeSH terms