. 2019 Feb 27;39(9):1588-1604.
doi: 10.1523/JNEUROSCI.2139-18.2018. Epub 2019 Jan 3.

Acquired Expression of Mutant Mitofusin 2 Causes Progressive Neurodegeneration and Abnormal Behavior

Affiliations

Acquired Expression of Mutant Mitofusin 2 Causes Progressive Neurodegeneration and Abnormal Behavior

Kaori Ishikawa et al. J Neurosci. .

Abstract

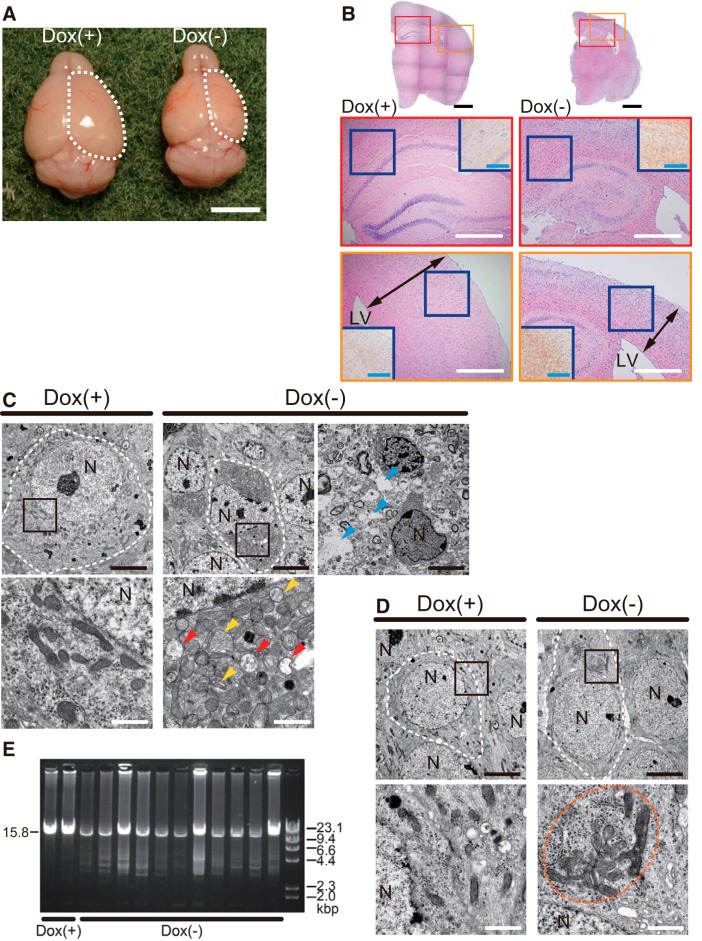
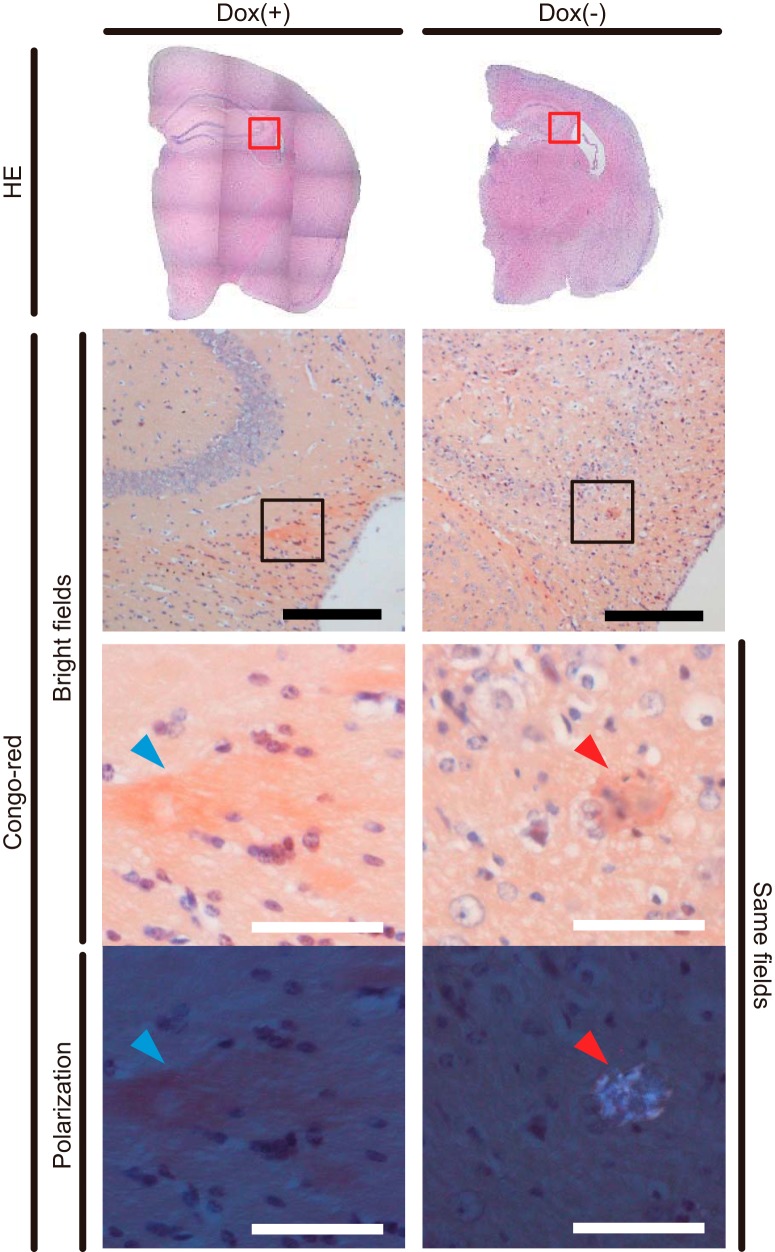
Neurons have high plasticity in developmental and juvenile stages that decreases in adulthood. Mitochondrial dynamics are highly important in neurons to maintain normal function. To compare dependency on mitochondrial dynamics in juvenile and adult stages, we generated a mouse model capable of selective timing of the expression of a mutant of the mitochondrial fusion factor Mitofusin 2 (MFN2). Mutant expression in the juvenile stage had lethal effects. Contrastingly, abnormalities did not manifest until 150 d after mutant expression during adulthood. After this silent 150 d period, progressive neurodegeneration, abnormal behaviors, and learning and memory deficits similar to those seen in human neurodegenerative diseases were observed. This indicates that abnormal neuronal mitochondrial dynamics seriously affect survival during early life stages and can also significantly damage brain function after maturation. Our findings highlight the need to consider the timing of disease onset in mimicking human neurodegenerative diseases.SIGNIFICANCE STATEMENT To compare the dependency on mitochondrial dynamics in neurons in juvenile and adult stages, we generated a mouse model expressing a mutant of the mitochondrial fusion factor MFN2 in an arbitrary timing. Juvenile expression of the mutant showed acute and severe phenotypes and had lethal effects; however, post-adult expression induced delayed but progressive phenotypes resembling those found in human neurodegenerative diseases. Our results indicate that abnormal neuronal mitochondrial dynamics seriously affect survival during early life stages and can also significantly damage brain function after maturation. This strongly suggests that the timing of expression should be considered when establishing an animal model that closely resembles human neurodegenerative diseases.

Keywords: MFN2; cognitive impairment; hyperactivity; mitochondrial dynamics; progressive neurodegeneration.


Figures

Figure 1.
Figure 1.
Schematic illustration of the experimental design. A, Schematic illustration of the construct used for the generation of the Camk2a-tTA/TRE-hMfn2(D210V) mouse line. Because expression of hMFN2(D210V) can be induced by a Tet-off system, switching on/off can be controlled with Dox-containing pellets. B, A representative image of genotyping of the mouse line by genome PCR. Integration and absence of Camk2a-tTA transgene resulted in the amplification of 450 and 200 bp fragments, respectively. Camk2a-tTA mice were maintained by mating of hemizygote with noncarrier; therefore, all Camk2a-tTA+ mice are hemizygote (lanes 1 and 3). The integration and absence of the hMFN2 transgene resulted in 1256 bp amplicon and without amplicon, respectively. C, Schematic illustration of the time courses of Dox treatment to regulate expression of hMFN2(D210V). Top and bottom indicate “juvenile expression” and “adult expression”, respectively. Green arrowheads and green band with “B.A.” indicate the time points when physiological and biochemical analyses were performed and the period which behavior analyses were performed, respectively. D, E, Representative sagittal images of in situ hybridization to visualize expression levels of tTA, the transgene, from embryonic stages to early postnatal days of juvenile expression group (D) and after adulthood in the adult expression group (E). Transgene-positive areas are shown in blue, and nuclei-abundant areas are shown in red or purple. Note the transgene expression was almost absent before birth (E13.5 and E18.5) but induced after birth, especially in the hippocampus and cortex (P4 < P14 < 5 w; D). In contrast, transgene expression decreased at Day 350 compared with Day 140 in the adult expression group (E). The specificity of the antisense riboprobe was confirmed by the negative results from the sense riboprobe against serial section and the Dox(+) mouse (D, “Sense” and “Dox(+)”). Scale bars: black, 1 mm; white, 500 μm.
Figure 2.
Figure 2.
Characterization of the Camk2a-tTA/TRE-hMFN2(D210V) mouse line. A, mRNA expression levels of mMfn2 and hMFN2 in the cortex compared with β-actin (Actb) by ΔΔCt method. B, Expression of hMFN2 compared with endogenous mMfn2. The left and right sides highlighted in blue and green in (A) and (B) show the results from the juvenile expression and adult expression groups, respectively. P values calculated by two-way ANOVA are shown in graph. C, Representative results of protein expression levels in the cortex by Western blot analysis and (D) their quantitative evaluation. *p < 0.05, **p < 0.01 by two-tailed multiple t test (n = 3). Detailed statistical parameters are shown in Figure 2-1.
Figure 3.
Figure 3.
Juvenile expression of hMFN2(D210V) induces acute and severe phenotypes. A, Transition of body weight from 4 weeks after birth. Data represented as mean ± SD. *p < 0.05, **p < 0.01, ***p < 0.001, ****p < 0.0001 by two-tailed multiple t test (n = 8). B, Survival curve by Kaplan–Meier method is shown. The p value indicated in the graph is the result of the log-rank test. Dox(+) group, n = 7; Dox(−) group, n = 8. C, Representative images of brains extracted from mice at 10 weeks of age. Marked cortex (surrounded by dashed line) atrophy was observed in a brain from the Dox(−) group. Scale bar, 5 mm. D, Brain weight at 10 weeks of age. Data are represented as mean ± SD. The p value calculated by independent two-tailed t test is shown in the graph. E, Respiratory complex activities at 10 weeks of age. Data are represented as mean + SD. **p < 0.01, ***p < 0.001 by two-way ANOVA (n = 3). Detailed statistical parameters are shown in Figure 2-1. F, Representative electron microscopy images of the hippocampal CA1 region. Bottom, High-magnification images of the areas surrounded by black borders in the top. The white dashed lines are the borders of one neuronal cell and N is the nucleus, respectively. Yellow and red arrowheads indicate mitochondria with abnormal inner membranes and swollen mitochondria lacking inner membrane structures, respectively. Scale bars: black, 5 μm; white, 1 μm.
Figure 4.
Figure 4.
Adult expression of hMFN2(D210V) induces delayed but progressive phenotypes. A, Survival curve by Kaplan–Meier method is shown. The p value indicated in the graph is the result of the log rank test. Dox(+) group, n = 12; Dox(−) group, n = 11. B, Transition of body weight. Yellow arrowhead indicates the time point when expression of hMFN2(D210V) started and green arrowheads show the time points when physiological and biochemical analyses were performed. Data represented as mean ± SD. *p < 0.05, **p < 0.01 by two-tailed multiple t test. C, Blood glucose levels, (D) blood lactate levels, (EG) biochemical activities of respiratory complexes in cortex, and (H) brain weights at Days 210, 280, and 350. Data represented as mean + SD. *p < 0.05, **p < 0.01, ***p < 0.001, ****p < 0.0001 by two-way ANOVA. Detailed statistical parameters are shown in Figure 2-1.
Figure 5.
Figure 5.
Brain histopathological analyses of adult expression group mice. A, Representative images of brains extracted from mice at Day 350. Marked cortical (surrounded by dashed line) atrophy was observed in a brain from the Dox(−) group. Scale bar, 5 mm. B, Representative coronal sections around bregma −1.70 mm. Top, Hematoxylin-eosin (HE) staining of whole-brain hemispheres. Middle and bottom, High-magnification images of areas surrounded by red (hippocampus) and yellow (cortex) borders in top, respectively. In the Dox(−) group, the cortical thickness (bottom, arrows) becomes thinner by ∼50% compared with the Dox(+) group, and an enlarged lateral ventricle (LV) was observed. In the middle and bottom, results from m1A immunohistochemical staining of areas surrounded by navy borders are also shown. Scale bars: black, 1 mm; white, 500 μm; blue, 200 μm. C, D, Representative electron microscopy images of hippocampal CA1 region at (C) Day 350 and (D) Day 140. Bottom, High-magnification images of areas surrounded by black borders in top. White dashed lines mark the borders of one neuronal cell and N is the nucleus, respectively. Yellow and red arrowheads in (C) indicate mitochondria with abnormal inner membranes and swollen mitochondria lacking inner membrane structures, respectively. Blue arrowheads in (C) show gaps generated in the tissue because of progressed neurodegeneration. Mitochondria surrounded by an orange dashed line in (D) are aggregated; however, the aggregation is not tight compared with (C), and they maintained normal morphology and inner membrane structures. Scale bars: black, 5 μm; white, 1 μm. E, MtDNA extracted from the cortex was amplified by long PCR. In the Dox(−) group, unspecified smaller bands were detected simultaneously with the 15.8 kbp main band.
Figure 6.
Figure 6.
Detection of amyloid plaques in adult expression group mice. Amyloid plaques were detected by Congo-red staining of paraffin sections. The results of the areas surrounded by red borders in the top are shown in the middle. High-magnification images of areas surrounded by black borders in the middle are shown in the bottom as bright-field images and polarized light microscopy images. Although Congo red stains amyloid depositions in red-orange under bright-field light, sometimes similar staining is observed in other areas showing a relatively high pH (blue arrowheads in the Dox(+) control group). Amyloid-specific results from the Congo red stain show an apple-green birefringence under polarized light microscopy (red arrowheads in the Dox(−) group). The birefringence was not detected in the Dox(+) group; however, it was detected in low-frequency in the Dox(−) group. Scale bars: black, 200 μm; white, 50 μm.
Figure 7.
Figure 7.
Analyses of motor functions in adult expression group mice. A, Wire hang test. Latency to fall was recorded with a 60 s cutoff time. B, Grip strength of forelimbs. Data indicate mean + SE. P values calculated by two-tailed Mann–Whitney U test (A) or independent two-tailed t test (B) are shown in graphs. Dox(+) group, n = 12; Dox(−) group, n = 11. C, Cross-sectional areas of the quadriceps and tibias anterior. Graphs indicate results from 3 mice per group, 30 fibers per mouse (n = 90, in total). P values calculated by independent two-tailed t test are shown in graphs. D, Representative HE staining cross-sections of the quadriceps and tibias anterior. The yellow dashed line is a fiber with small angular tendencies, and the green dashed lines indicate fibers with size discrepancies. Scale bars, 20 μm. E, Representative images of limb reflexes during tail hanging. Whereas Dox(+) mice have stretched legs, a reflex to balance themselves, Dox(−) mice lack such reflex. F, Representative images of cross-sections of the lumber spinal cord (top). The magnified views of the anterior horn regions (bottom) shows remaining of motor neurons (pyramidal shaped cells) in both Dox(+) and Dox(−) groups. Scale bars: black, 500 μm; white, 100 μm. G, The number of slippages and (H) moving speed recorded during the balance beam test. A wide rod was used in the first six repetitions and a narrow one was used in the remaining six repetitions. Data represented as mean ± SE. P values calculated by repeated-measures ANOVA in the first and later six repetitions are shown in graphs. Dox(+) group, n = 12; Dox(−) group, n = 11. Detailed statistical parameters are shown in Figure 2-1.
Figure 8.
Figure 8.
Analyses of behavior of mice expressing hMFN2(D210V) during adulthood. A, Results from the home cage test. Each mouse was individually housed in each home cage and their locomotor activity was monitored. White and black bands shown under the x-axis indicate daytime and night time, respectively. B, Distance traveled, (C) rearing time, and (D) time spent in the center area was recorded every 5 min during the open-field test. Data represents the mean ± SE. P values calculated by repeated-measures ANOVA are shown in graphs. Dox(+) group, n = 12; Dox(−) group, n = 11. E, Food intake and water consumption per week. F, Rectal temperature. Data represented as mean + SD. P values calculated by two-tailed multiple t test (E) and independent two-tailed t test (F) are shown in graphs. Dox(+) group, n = 12; Dox− group, n = 11. Detailed statistical parameters are shown in Figure 2-1.
Figure 9.
Figure 9.
Evaluation of spatial/working memory and learning in adult expression group mice. A, Representative traces of mouse movements during the 20th trial of the Barnes maze test. Red circles indicate the correct holes for mice. Transition of (B) number of visiting error holes before arriving at the correct hole, (C) time to arrive at the correct hole, and (D) rate of mice that arrived at the correct hole within the time limit in each trial of the Barnes maze test. E, The rate at which mice select the correct path in the T-maze. The dashed line indicates a chance level (50%). Data represented as mean ± SE. P values calculated by repeated-measures ANOVA are shown in graphs. Dox(+) group, n = 12; Dox(−) group, n = 11. Detailed statistical parameters are shown in Figure 2-1. F, Schematic illustration of the predicted neurodegeneration mechanism in mice expressing hMFN2(D210V) during adulthood. Mitochondrial aggregation is the first abnormality induced by hMFN2(D210V) expression, interfering normal mitochondrial distribution to synapses and dendrites (∼Day 140). Mitochondria-lacking synapses and dendrites cannot be maintained, and mitochondrial respiration gradually decrease because damage-buffering system by mitochondrial fusion is disrupted (∼Day 280). Long-term continuation of these states leads to neurodegeneration (∼Day 350).

References

    1. Ahlemeyer B, Halupczok S, Rodenberg-Frank E, Valerius KP, Baumgart-Vogt E (2018) Endogenous murine amyloid-beta peptide assembles into aggregates in the aged C57BL/6J mouse suggesting these animals as a model to study pathogenesis of amyloid-beta plaque formation. J Alzheimers Dis 61:1425–1450. 10.3233/JAD-170923 - DOI - PubMed
    1. Baek SH, Park SJ, Jeong JI, Kim SH, Han J, Kyung JW, Baik SH, Choi Y, Choi BY, Park JS, Bahn G, Shin JH, Jo DS, Lee JY, Jang CG, Arumugam TV, Kim J, Han JW, Koh JY, Cho DH, Jo DG (2017) Inhibition of Drp1 ameliorates synaptic depression, Aβ deposition, and cognitive impairment in an Alzheimer's disease model. J Neurosci 37:5099–5110. 10.1523/JNEUROSCI.2385-16.2017 - DOI - PMC - PubMed
    1. Bannerman P, Burns T, Xu J, Miers L, Pleasure D (2016) Mice hemizygous for a pathogenic mitofusin-2 allele exhibit hind limb/foot gait deficits and phenotypic perturbations in nerve and muscle. PLoS One 11:e0167573. 10.1371/journal.pone.0167573 - DOI - PMC - PubMed
    1. Barnes CA. (1979) Memory deficits associated with senescence: a neurophysiological and behavioral study in the rat. J Comp Physiol Psychol 93:74–104. 10.1037/h0077579 - DOI - PubMed
    1. Butterfield DA. (2002) Amyloid β-peptide (1–42)-induced oxidative stress and neurotoxicity: implications for neurodegeneration in Alzheimer's disease brain. A review. Free Radic Res 36:1307–1313. 10.1080/1071576021000049890 - DOI - PubMed

Publication types

MeSH terms

Supplementary concepts