. 2019 Feb;37(2):169-178.
doi: 10.1038/s41587-018-0001-2. Epub 2019 Jan 3.

Comprehensive identification of RNA-protein interactions in any organism using orthogonal organic phase separation (OOPS)

Affiliations

Comprehensive identification of RNA-protein interactions in any organism using orthogonal organic phase separation (OOPS)

Rayner M L Queiroz et al. Nat Biotechnol. 2019 Feb.

Erratum in

Abstract

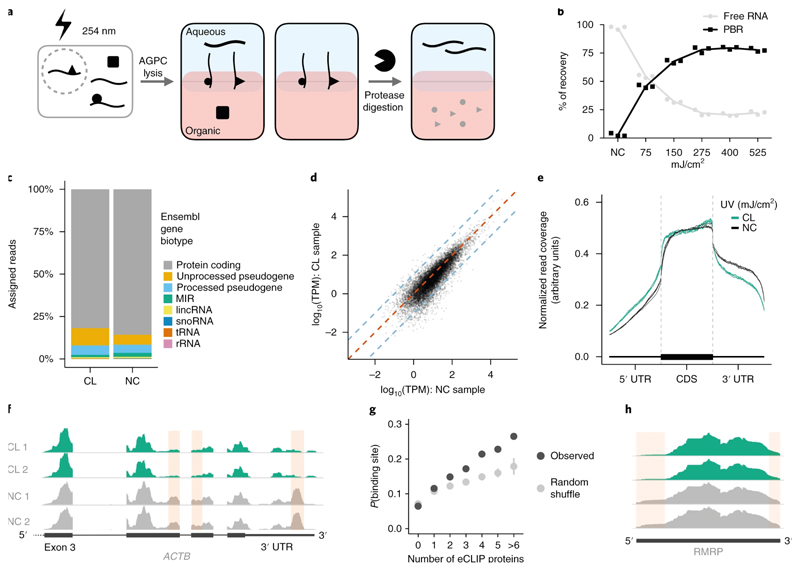
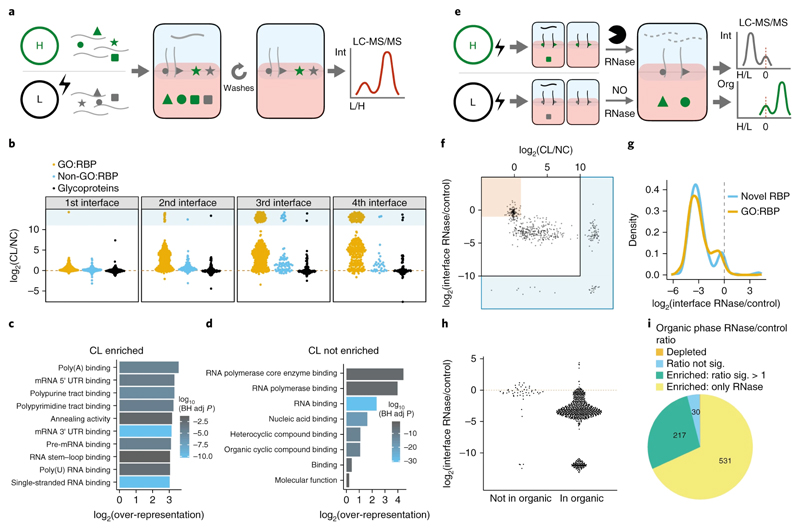
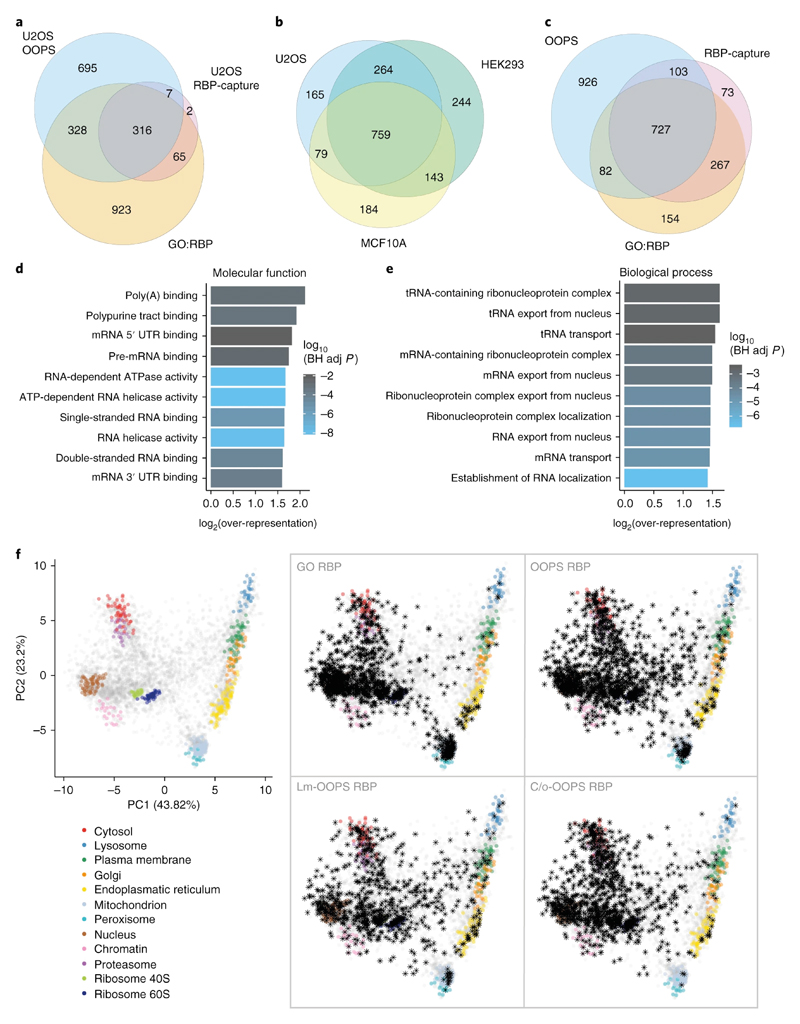
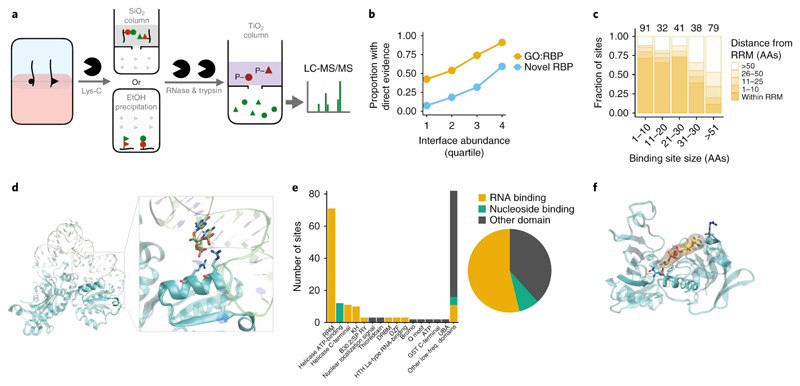
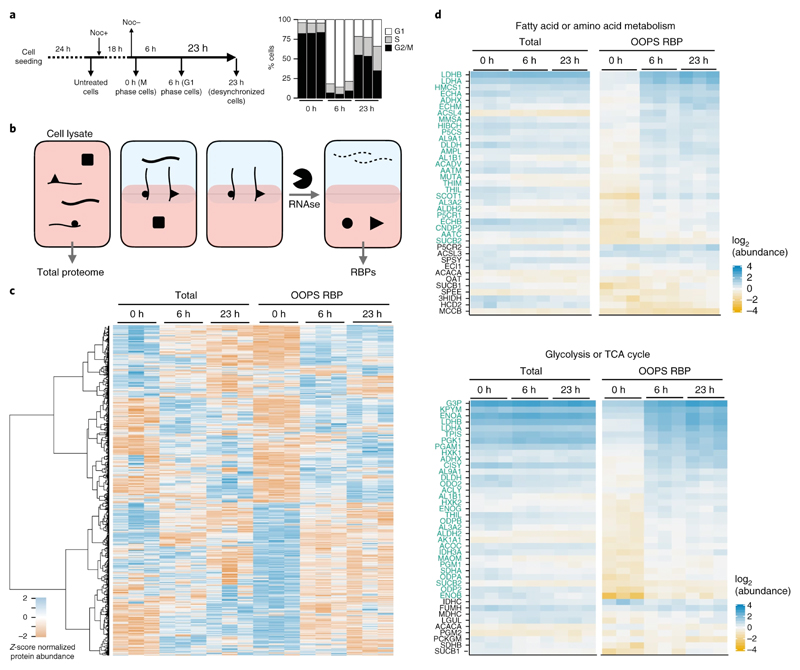
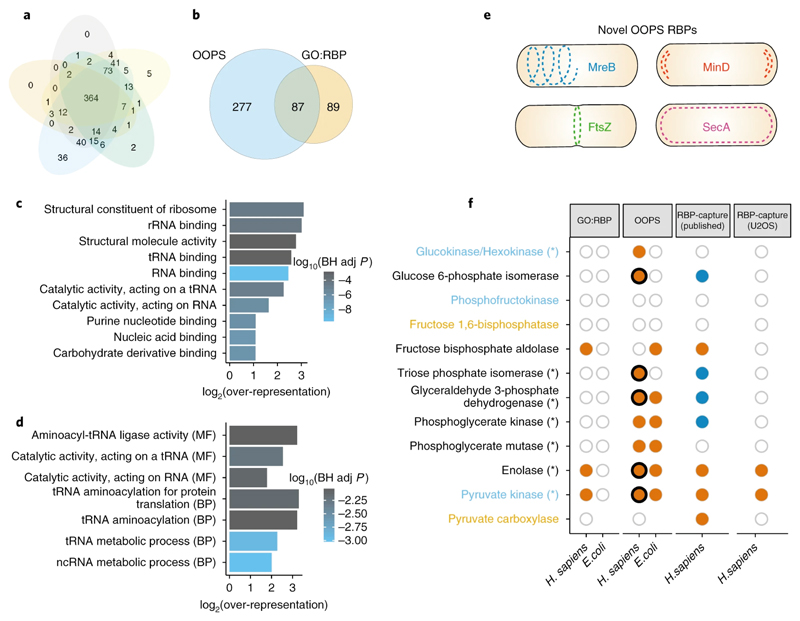
Existing high-throughput methods to identify RNA-binding proteins (RBPs) are based on capture of polyadenylated RNAs and cannot recover proteins that interact with nonadenylated RNAs, including long noncoding RNA, pre-mRNAs and bacterial RNAs. We present orthogonal organic phase separation (OOPS), which does not require molecular tagging or capture of polyadenylated RNA, and apply it to recover cross-linked protein-RNA and free protein, or protein-bound RNA and free RNA, in an unbiased way. We validated OOPS in HEK293, U2OS and MCF10A human cell lines, and show that 96% of proteins recovered were bound to RNA. We show that all long RNAs can be cross-linked to proteins, and recovered 1,838 RBPs, including 926 putative novel RBPs. OOPS is approximately 100-fold more efficient than existing methods and can enable analyses of dynamic RNA-protein interactions. We also characterize dynamic changes in RNA-protein interactions in mammalian cells following nocodazole arrest, and present a bacterial RNA-interactome for Escherichia coli. OOPS is compatible with downstream proteomics and RNA sequencing, and can be applied in any organism.


Conflict of interest statement

Competing interests

The authors declare no competing financial interests.

Figures

Figure 1
Figure 1. OOPS recovers protein-bound RNAs.
(a) Schematic representation of the OOPS method to extract protein-bound RNA. Cells are crosslinked to induce RNA-proteins adducts which are drawn simultaneously to the organic and aqueous phases in Acid Guanidinium-Phenol-Chloroform (AGPC) and thus remain at the interface. Protease digestion and a further AGPC separation yields RNA in the aqueous phase. (b) Relative proportions of free RNA (aqueous phase) and protein-bound RNA (PBR; interface) with increasing UV dosage. Data shown as mean +/- SD of 3 independent experiments. (c) Relative proportions of RNA-Seq reads assigned to Ensembl gene biotypes for 400 mJ/cm2 CL and NC samples. (d) Correlation between gene abundance estimates for NC replicate 1 and 400 mJ/cm2 CL replicate 1. Blue dashed lines represent a 10-fold difference. Red dashed line represents equality. (e) Meta-plot of read coverage over protein-coding gene-model. Reduced coverage observed for 400 mJ/cm2 CL samples in the 3' UTR. (f) Read coverage across ACTB for CL (400 mJ/cm2) and NC replicates. Red boxes denote regions with consistently reduced coverage in CL. (g) Relationship between the number of eCLIP proteins with a peak in a sliding window and the probability of the window being identified as a protein binding site. For random shuffle, the center value is the mean and error bar is 2 standard deviations, n = 100 iterations. (h) Read coverage across RMRP for CL (400 mJ/cm2) and NC replicates. Red boxes denote regions with consistently reduced coverage in CL. Non-crosslinked=NC, Crosslinked=CL.
Figure 2
Figure 2. OOPS for RBP recovery.
(a) Schematic representation of the SILAC experiment used to determine the effect of UV crosslinking on protein abundance in the interface and the effect of additional phase separation cycles to wash the interface. Equal quantities of cells +/- UV crosslinking are labelled with SILAC and mixed prior to OOPS. RNA bound proteins are expected to have a positive CL vs NC ratio. Contaminants are expected to be equally abundant in CL and NC. (b) Protein CL vs NC ratios for the 1st to 4th interfaces. Infinite ratios (not detected in NC) are presented as pseudo-values in blue box. GO:RBP = GO annotated RNA binding protein. (c) Top 10 molecular function GO terms over-represented in proteins enriched by CL in the 3rd interface. BH adj p-value = Benjamini-Hochberg adjusted p-value. P-value obtained from a modified hypergeometric test to account for protein abundance (see online methods). (d) As per (c) for proteins not enriched by CL in the 3rd interface. (e) Schematic representation of the SILAC experiment to determine protein abundance in the 3rd interface and 4th organic phase following RNase treatment. Equal quantities of cells were UV crosslinked and RNA-protein adducts enriched by OOPS +/- RNase before combining the samples for a final phase separation in which both the interface and the organic phase are collected. Proteins from RNase treated cells will be depleted from the interface and enriched in the organic phase. (f) Protein CL vs NC ratio and RNase vs control ratio in the interface. Red box denotes proteins which are not CL-enriched and not depleted by RNase. The blue regions surrounding the graph denote ratios which cannot be accurately estimated as the protein was only detected in one condition and therefore a pseudo-value is presented. (g) RNase vs control ratio in the interface for GO annotated RBPs and other OOPS RBPs (h) Protein RNase vs control ratio in the interfaces for proteins identified in the 4th step organic phase. Red line = equal intensity in RNase-treated and control. (i) Proportion of proteins enriched in the organic phase following RNase treatment. Proteins detected in both +/- RNase conditions but with insufficient peptides to test for significant enrichment are excluded.
Figure 3
Figure 3. RBPs identified using OOPS.
(a) Overlap between OOPS, RBP-Capture and GO-annotated proteins for U2OS cells. Proteins were restricted to those expressed in U2OS. (b) Overlap between proteins identified with OOPS from U2OS, HEK293 and MCF10A. Proteins were restricted to those expressed in all cell lines. (c) Overlap between the union of OOPS RBPs identified in the 3 cell lines in (b), all published RBP-Capture studies, and GO annotated RBPs. Proteins were restricted to those expressed in all 3 OOPS cell lines. (d) Top 10 molecular function GO terms over-represented in the proteins identified in U2OS OOPS. BH adj p-value = Benjamini-Hochberg adjusted p-value. P-value obtained from a modified hypergeometric test to account for protein abundance (see online methods). (e) As per (d) for novel U2OS RBPs identified by OOPS. (f) HyperLOPIT projections of protein steady state localisation. Left: Canonical subcellular localisation markers indicated in colour as shown. Right: Highlighted RBPs shown as black asterisks. GO RBP = GO annotated RBP. Lm = Light membrane-enriched fraction. C/o = Cytoplasm/Other fraction. Annotated proteins in each fraction were detected in at least one of 5 repeat experiments.
Figure 4
Figure 4. Crosslink site analyses validates OOPS RBPs.
(a) Schematic representation of the sequential digestion method used to identify the RNA-binding site. RNA-protein adducts are extracted from the interface and digested with Lys-C to yield RNA-peptides which are subsequently enriched by silica affinity column or ethanol precipitation. Enriched RNA-peptides are treated with RNases followed by trypsin digestion. Peptides containing the UV-crosslinked nucleotide/RNA are retained by a TiO2 affinity column and the unbound fraction containing the peptide sequences adjacent to RNA crosslinking site is analysed by LC-MS/MS. Red=peptides containing site of crosslinking. Green=peptides adjacent to the RNA-binding site peptide. (b) Proportion of OOPS RBPs in which a putative RNA-binding site was identified. Proteins separated into GO annotated RBPs and novel RBPs, and by their abundance at the OOPS interface. (c) Distance of putative RNA-binding sites to the nearest RRM. Smaller putative RNA-binding sites are closer to RRM. Counts for each size range shown above bars. Analysis restricted to proteins with an RRM. (d) Crystal structure of Glycyl-tRNA synthetase in complex with tRNA-Gly (PDB ID 4KR2). RNA is shown as transparent lime ribbon; Glycyl-tRNA synthetase is shown in a cyan transparent cartoon representation. The putative RNA binding peptide is shown in an opaque representation and RNA and protein residues at 4 Å or less from each other are shown as lime and cyan sticks respectively. (e) The number of putative RNA-binding site which intersect an Interpro-annotated protein domain. Domains classified as RNA or nucleotide binding or other. (f) Crystal structure of GAPDH complexed with NAD (PDB ID 4WNC). GAPDH is shown as a cyan transparent cartoon; putative RNA binding peptide is shown in an opaque representation. Residues at 4 Å or less from NAD (yellow sticks and surface representation) are shown as cyan sticks.
Figure 5
Figure 5. RBP-ome after nocodazole arrest.
(a) Left: schematic representation of the nocodazole arrest/release experiment. Cells were analysed after 18 h nocodazole arrest and after a 6 h or 23 h release from the treatment release. Right: relative proportions of cells in G1, S and M phase for cells synchronised at each time-point (shown as the mean +/- SD of 3 independent experiments) (b) Schematic representation of protein extraction for nocodazole-arrest experiment. Total proteomes were extracted from cell lysates and RBPs were extracted following OOPS proteome method. (c) Protein abundance from total proteome and OOPS extractions. Abundance z-score normalised within each extraction type. Proteins hierarchically clustered across all samples as shown on left (d) Protein abundance for groups of overlapping KEGG pathways over-represented in proteins with a significant increase in RNA-binding at 6 h vs 0 h. Individual proteins with a significant increase in RNA binding in 6 h vs 0 h are highlighted in green
Figure 6
Figure 6. E. coli bacterial RBPome.
(a) Overlap between RBPs identified in 5 independent OOPS replicates. (b) Overlap between E.coli OOPS RBPs and GO annotated RBPs. (c) Top 10 molecular function GO terms over-represented in E.coli OOPS RBPs. BH adj p-value = Benjamini-Hochberg adjusted p-value. P-value obtained from a modified hypergeometric test to account for protein abundance (see online methods). (d) As per (c) for all GO terms over-represented in novel E.coli OOPS RBPs. (e) Schematic representation of OOPS novel RBPs that follow 4 distinct localisation patterns in which RNA has been found. (f) RNA-binding capacity of glycolysis/gluconeogenesis proteins. Proteins coloured by pathways; blue text = only glycolysis, orange text = only gluconeogenesis. Asterisks = increased RNA-binding after release from nocodazole arrest. GO:RBP=GO-annotated RBP. Orange filled circle = protein observed in the dataset indicated. Dark blue fill = protein in human RBP-Capture experiments but listed as a lower-confidence “candidate” RBP. Empty circle = protein present in species but not observed in dataset. Where paralogs exist, filled circles indicate the detection of at least one paralog. Thick black line indicates an RNA-binding site was identified in the sequential digestion experiment.

Similar articles

Cited by

References

    1. García-Mauriño SM, et al. RNA Binding Protein Regulation and Cross-Talk in the Control of AU-rich mRNA Fate. Front Mol Biosci. 2017;4:71. - PMC - PubMed
    1. Müller-Mcnicoll M, Neugebauer KM. How cells get the message: Dynamic assembly and function of mRNA-protein complexes. RNA Biol. 2013;14:275–287. - PubMed
    1. Huntzinger E, Izaurralde E. Gene silencing by microRNAs: contributions of translational repression and mRNA decay. Nat Rev Genet. 2011;12:99–110. - PubMed
    1. Engreitz JM, et al. Local regulation of gene expression by lncRNA promoters, transcription and splicing. Nature. 2016;539:452–455. - PMC - PubMed
    1. Wang KC, et al. A long noncoding RNA maintains active chromatin to coordinate homeotic gene expression. Nature. 2011;472:120–126. - PMC - PubMed

Publication types

MeSH terms