

Lipid metabolism of phenol-tolerant Rhodococcus opacus strains for lignin bioconversion
- PMID: 30607174
- PMCID: PMC6309088
- DOI: 10.1186/s13068-018-1337-z
Lipid metabolism of phenol-tolerant Rhodococcus opacus strains for lignin bioconversion
Abstract
Background: Lignin is a recalcitrant aromatic polymer that is a potential feedstock for renewable fuel and chemical production. Rhodococcus opacus PD630 is a promising strain for the biological upgrading of lignin due to its ability to tolerate and utilize lignin-derived aromatic compounds. To enhance its aromatic tolerance, we recently applied adaptive evolution using phenol as a sole carbon source and characterized a phenol-adapted R. opacus strain (evol40) and the wild-type (WT) strain by whole genome and RNA sequencing. While this effort increased our understanding of the aromatic tolerance, the tolerance mechanisms were not completely elucidated.
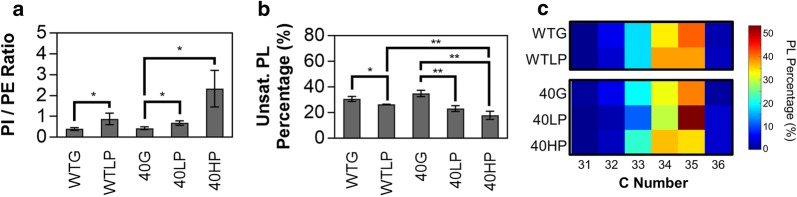
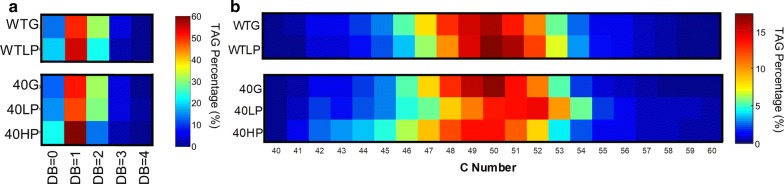
Results: We hypothesize that the composition of lipids plays an important role in phenol tolerance. To test this hypothesis, we applied high-resolution mass spectrometry analysis to lipid samples obtained from the WT and evol40 strains grown in 1 g/L glucose (glucose), 0.75 g/L phenol (low phenol), or 1.5 g/L phenol (high phenol, evol40 only) as a sole carbon source. This analysis identified > 100 lipid species of mycolic acids, phosphatidylethanolamines (PEs), phosphatidylinositols (PIs), and triacylglycerols. In both strains, mycolic acids had fewer double bond numbers in phenol conditions than the glucose condition, and evol40 had significantly shorter mycolic acid chain lengths than the WT strain in phenol conditions. These results indicate that phenol adaptation affected mycolic acid membrane composition. In addition, the percentage of unsaturated phospholipids decreased for both strains in phenol conditions compared to the glucose condition. Moreover, the PI content increased for both strains in the low phenol condition compared to the glucose condition, and the PI content increased further for evol40 in the high phenol condition relative to the low phenol condition.
Conclusions: This work represents the first comprehensive lipidomic study on the membrane of R. opacus grown using phenol as a sole carbon source. Our results suggest that the alteration of the mycolic acid and phospholipid membrane composition may be a strategy of R. opacus for phenol tolerance.
Keywords: Mass spectrometry; Mycolic acid; Phenol; Phospholipid; Rhodococcus opacus; Triacylglycerol.
Figures


Similar articles
-
Comparative transcriptomics elucidates adaptive phenol tolerance and utilization in lipid-accumulating Rhodococcus opacus PD630.Nucleic Acids Res. 2016 Mar 18;44(5):2240-54. doi: 10.1093/nar/gkw055. Epub 2016 Feb 2. Nucleic Acids Res. 2016. PMID: 26837573 Free PMC article.
-
A key O-demethylase in the degradation of guaiacol by Rhodococcus opacus PD630.Appl Environ Microbiol. 2023 Oct 31;89(10):e0052223. doi: 10.1128/aem.00522-23. Epub 2023 Oct 6. Appl Environ Microbiol. 2023. PMID: 37800939 Free PMC article.
-
A concerted systems biology analysis of phenol metabolism in Rhodococcus opacus PD630.Metab Eng. 2019 Sep;55:120-130. doi: 10.1016/j.ymben.2019.06.013. Epub 2019 Jul 2. Metab Eng. 2019. PMID: 31271774
-
Bioconversion of renewable feedstocks by Rhodococcus opacus.Curr Opin Biotechnol. 2020 Aug;64:10-16. doi: 10.1016/j.copbio.2019.08.013. Epub 2019 Sep 30. Curr Opin Biotechnol. 2020. PMID: 31580993 Review.
-
Development of Rhodococcus opacus as a chassis for lignin valorization and bioproduction of high-value compounds.Biotechnol Biofuels. 2019 Aug 5;12:192. doi: 10.1186/s13068-019-1535-3. eCollection 2019. Biotechnol Biofuels. 2019. PMID: 31404385 Free PMC article. Review.
Cited by
-
Effect of Chronic Exposure to Textile Wastewater Treatment Plant Effluents on Growth Performance, Oxidative Stress, and Intestinal Microbiota in Adult Zebrafish (Danio rerio).Front Microbiol. 2021 Nov 25;12:782611. doi: 10.3389/fmicb.2021.782611. eCollection 2021. Front Microbiol. 2021. PMID: 34899664 Free PMC article.
-
Rhodococcus as Biofactories for Microbial Oil Production.Molecules. 2021 Aug 11;26(16):4871. doi: 10.3390/molecules26164871. Molecules. 2021. PMID: 34443455 Free PMC article. Review.
-
Diversity of Mercury-Tolerant Microorganisms.Microorganisms. 2025 Jun 10;13(6):1350. doi: 10.3390/microorganisms13061350. Microorganisms. 2025. PMID: 40572238 Free PMC article. Review.
-
Robust microorganisms for biofuel and chemical production from municipal solid waste.Microb Cell Fact. 2020 Mar 16;19(1):68. doi: 10.1186/s12934-020-01325-0. Microb Cell Fact. 2020. PMID: 32178677 Free PMC article.
-
Genetic "expiry-date" circuits control lifespan of synthetic scavenger bacteria for safe bioremediation.Nucleic Acids Res. 2025 Jul 19;53(14):gkaf703. doi: 10.1093/nar/gkaf703. Nucleic Acids Res. 2025. PMID: 40705927 Free PMC article.
References
-
- Bozell JJ, Petersen GR. Technology development for the production of biobased products from biorefinery carbohydrates-the US Department of Energy’s “Top 10” revisited. Green Chem. 2010;12(4):539–554.
-
- Hahn-Hagerdal B, Galbe M, Gorwa-Grauslund MF, Liden G, Zacchi G. Bio-ethanol—the fuel of tomorrow from the residues of today. Trends Biotechnol. 2006;24(12):549–556. - PubMed
-
- Lynd LR, Liang X, Biddy MJ, Allee A, Cai H, Foust T, Himmel ME, Laser MS, Wang M, Wyman CE. Cellulosic ethanol: status and innovation. Curr Opin Biotechnol. 2017;45:202–211. - PubMed
-
- Sorek N, Yeats TH, Szemenyei H, Youngs H, Somerville CR. The implications of lignocellulosic biomass chemical composition for the production of advanced biofuels. Bioscience. 2014;64(3):192–201.
-
- Li Y, Tschaplinski TJ, Engle NL, Hamilton CY, Rodriguez M, Jr, Liao JC, Schadt CW, Guss AM, Yang Y, Graham DE. Combined inactivation of the Clostridium cellulolyticum lactate and malate dehydrogenase genes substantially increases ethanol yield from cellulose and switchgrass fermentations. Biotechnol Biofuels. 2012;5(1):2. - PMC - PubMed
Grants and funding
LinkOut - more resources
Full Text Sources
Other Literature Sources
Research Materials
Miscellaneous
