

Dynamic changes of CX3CL1/CX3CR1 axis during microglial activation and motor neuron loss in the spinal cord of ALS mouse model
- PMID: 30607245
- PMCID: PMC6309063
- DOI: 10.1186/s40035-018-0138-4
Dynamic changes of CX3CL1/CX3CR1 axis during microglial activation and motor neuron loss in the spinal cord of ALS mouse model
Abstract
Background: Neuron-microglia communication plays a crucial role in the motor neurons (MNs) death in amyotrophic lateral sclerosis (ALS). Neurons can express chemokine (C-X3-C motif) ligand 1 (CX3CL1), which mediates microglial activation via interacting with its sole receptor CX3CR1 in microglia. In the present study, we aimed to investigate the dynamic changes of CX3CL1/CX3CR1 axis during microglial activation and MNs loss in SOD1G93A mouse model of ALS.
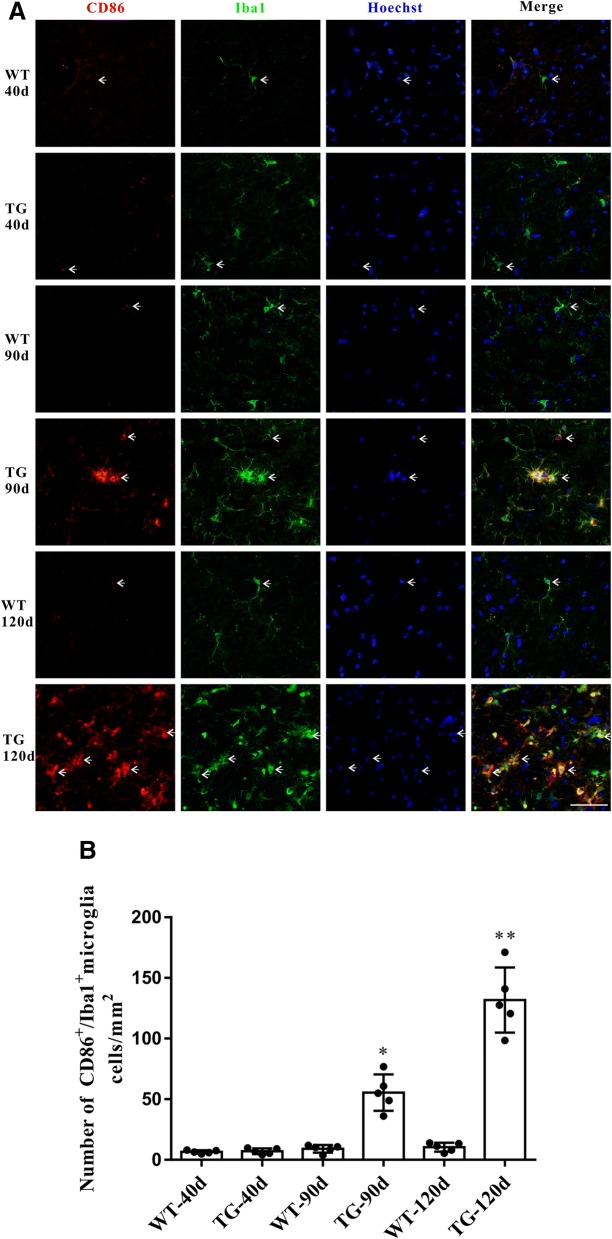
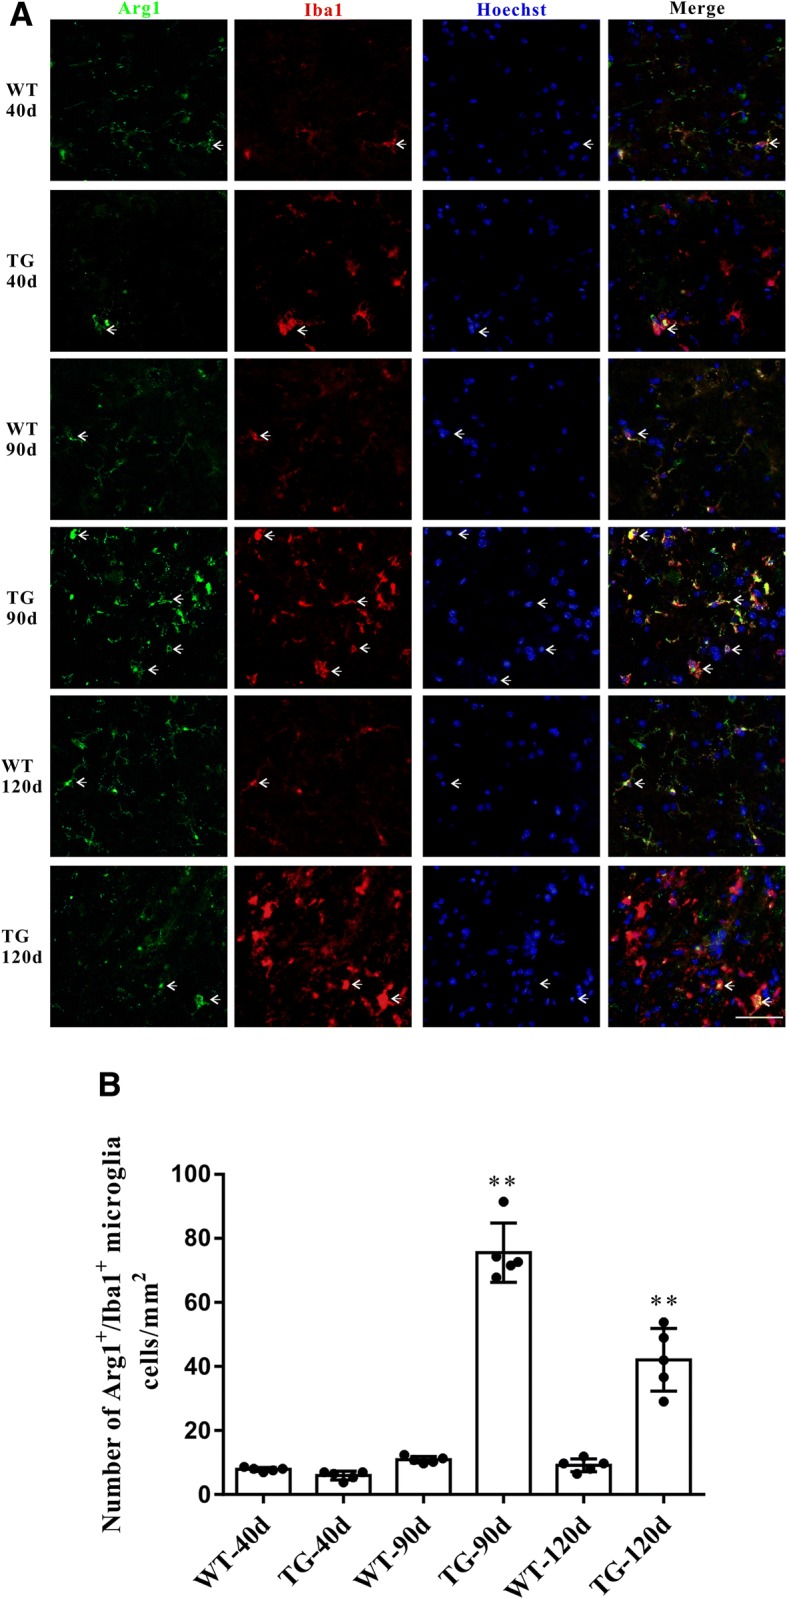
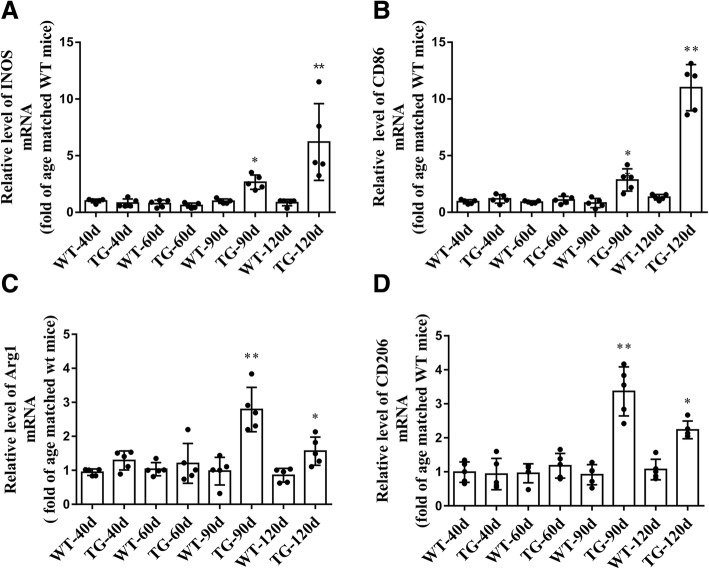
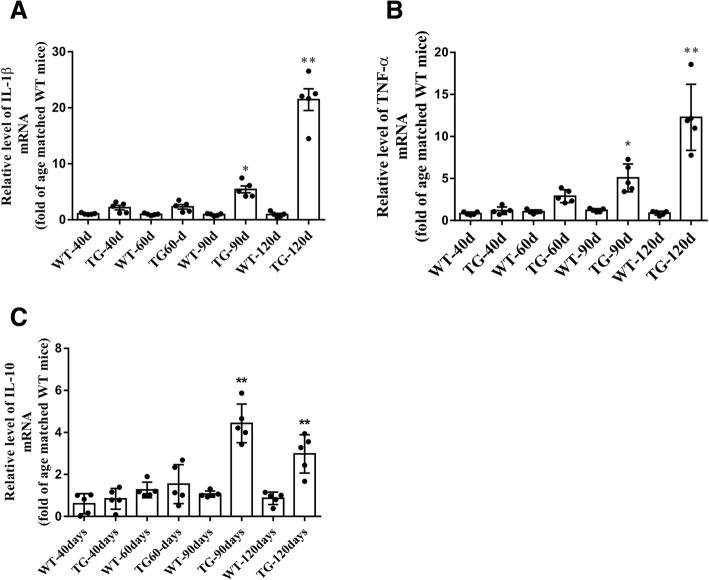
Methods: qPCR, western blot and immunofluorescent staining were used to examine the mRNA and protein levels and localization of CX3CL1/CX3CR1 in the anterior horn region of spinal cord in both SOD1G93A mice and their age-matched wild type (WT) littermates at 40, 60, 90 and 120 days of age. The M1/M2 microglial activation in the spinal cord tissues of SOD1G93A mice and WT mice were evaluated by immunofluorescent staining of M1/M2 markers and further confirmed by qPCR analysis of M1/M2-related cytokines.
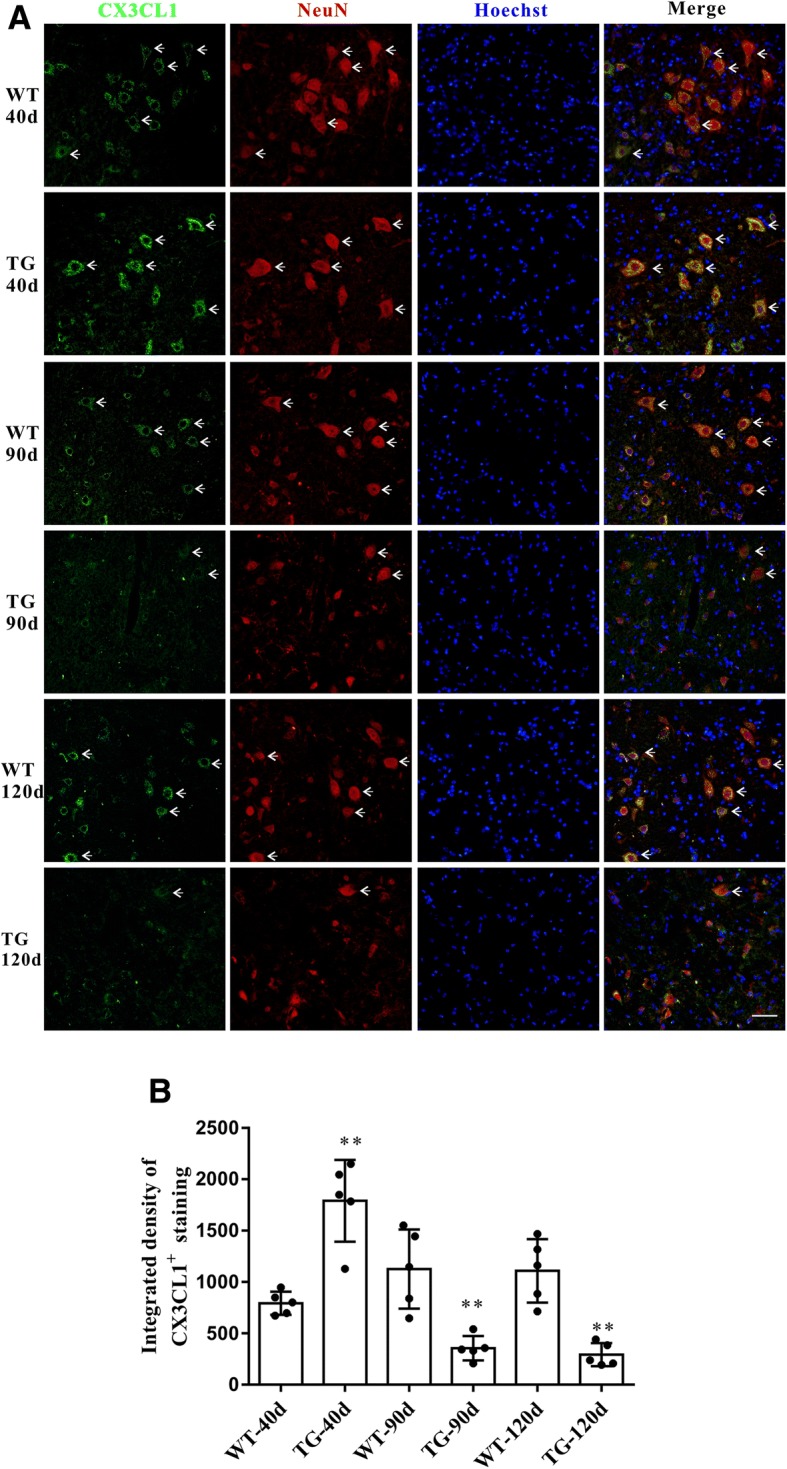
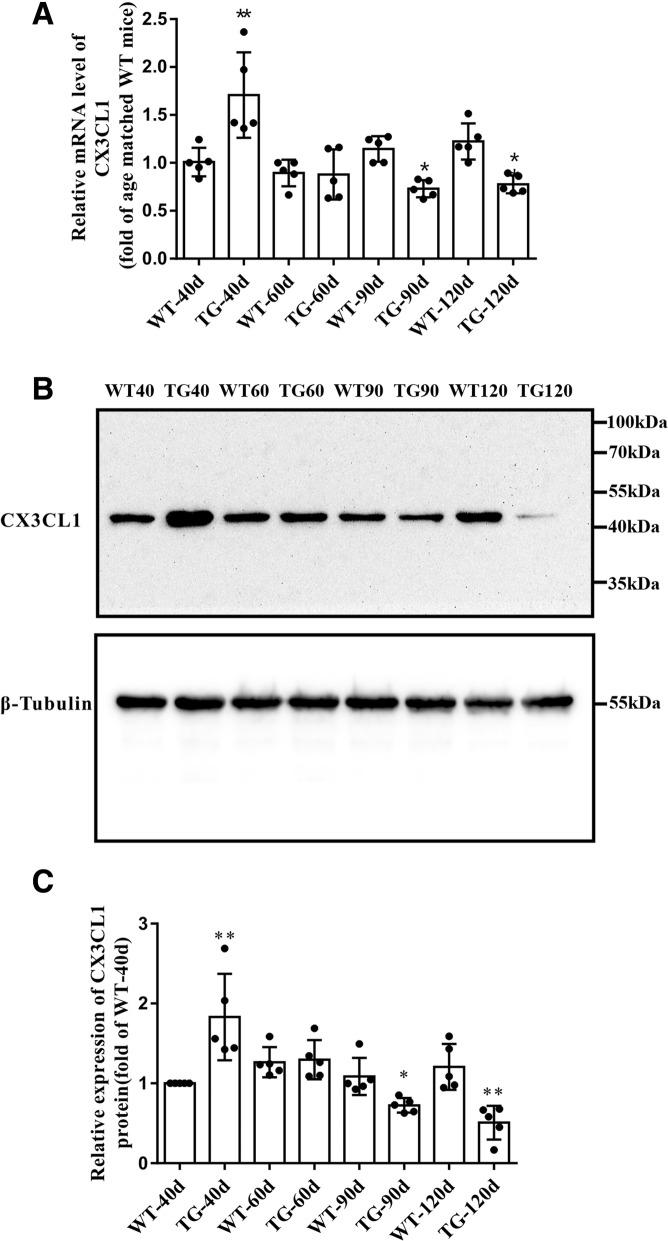
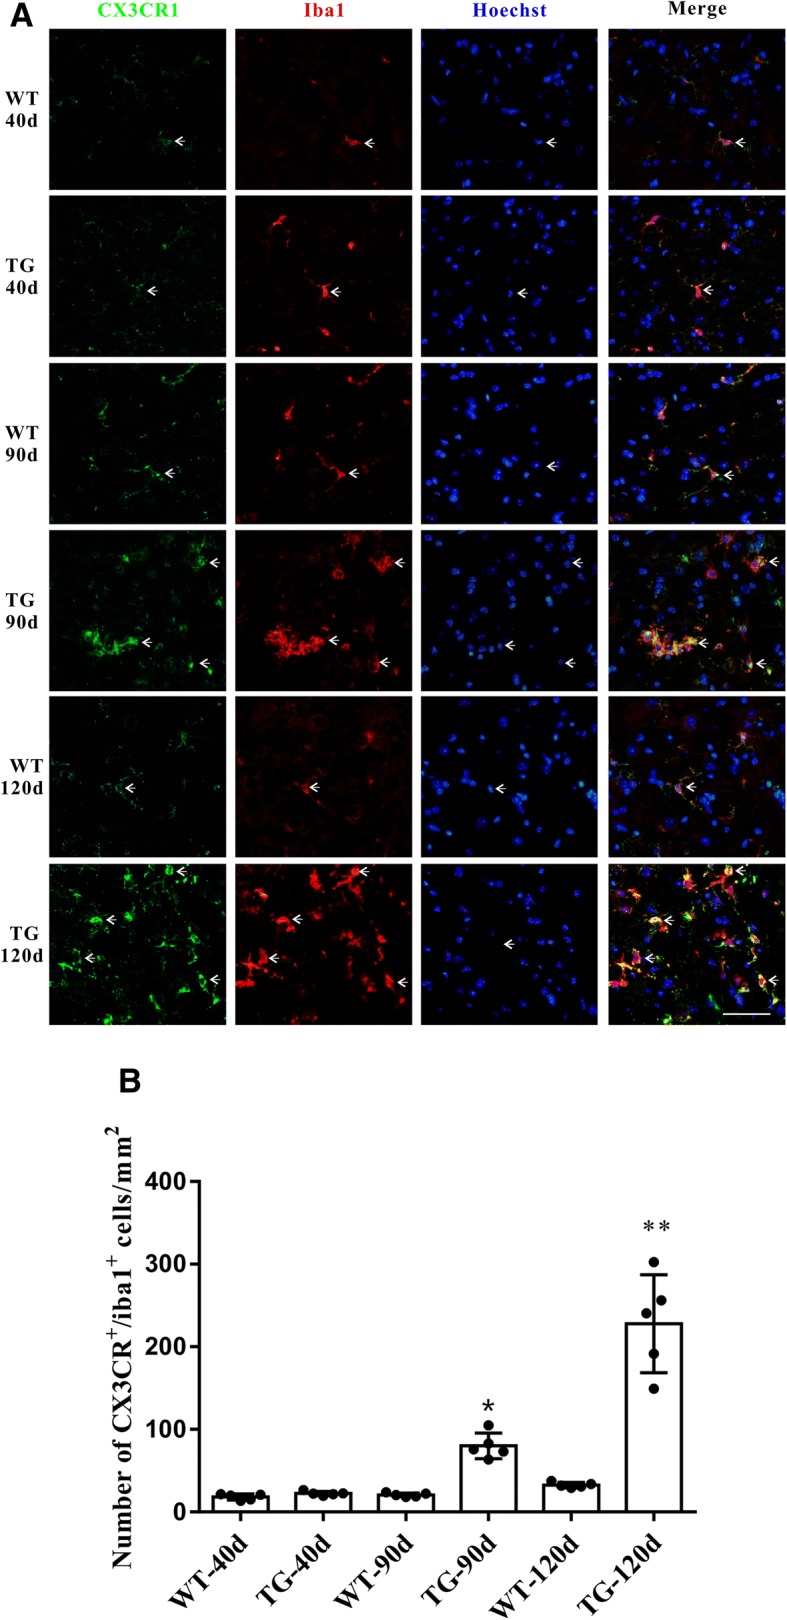
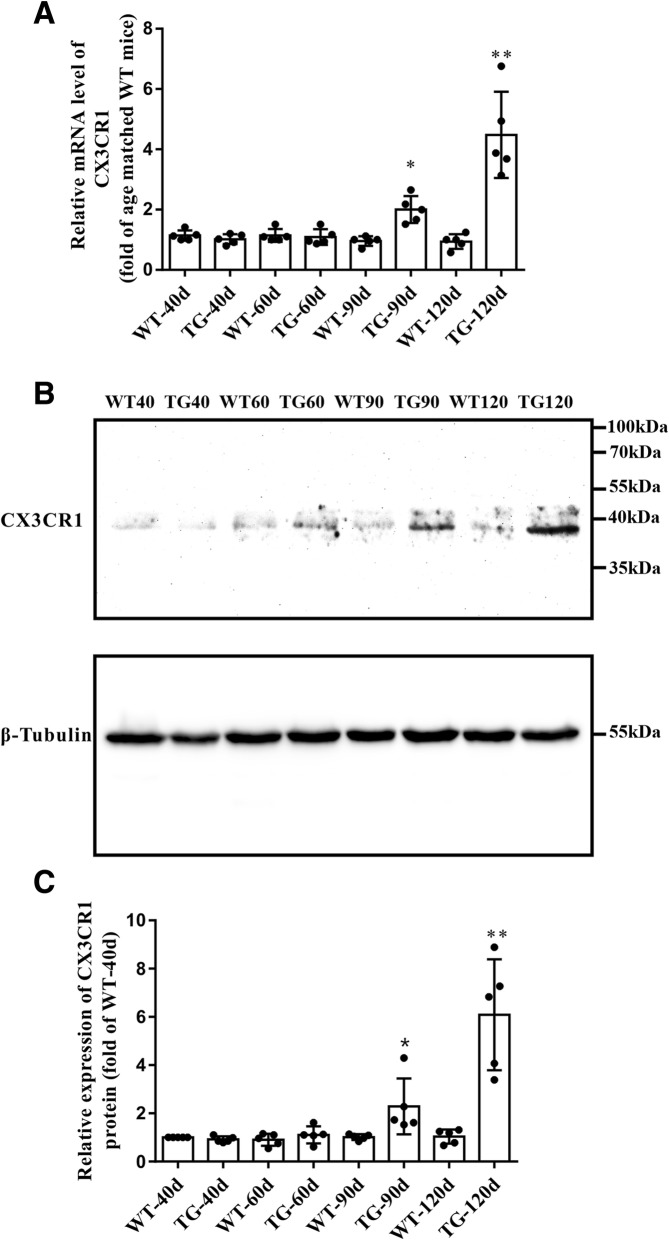
Results: The immunofluorescent staining revealed that CX3CL1 was predominately expressed in MNs, while CX3CR1 was highly expressed in microglia in the anterior horn region of spinal cord. Compared with age-matched WT mice, CX3CL1 mRNA level was elevated at 40 days but decreased at 90 and 120 days in the anterior horn region of spinal cords in ALS mice. Consistently, CX3CR1 mRNA level was increased at 90 and 120 days. Western blot assay further confirmed the dynamic changes of CX3CL1/CX3CR1 axis in ALS mice. Additionally, the levels of M1/M2 markers of microglia and their related cytokines in the anterior horn region of spinal cord in ALS mice were increased at 90 and 120 days. Moreover, while M1-related cytokines in ALS mice were persistently increased at 120 days, the upregulated M2-related cytokines started to decline at 120 days, suggesting an altered microglial activation.
Conclusions: Our data revealed the dynamic changes of CX3CL1/CX3CR1 axis and an imbalanced M1/M2 microglial activation during ALS pathological progression. These findings may help identify potential molecular targets for ALS therapy.
Keywords: ALS; CX3CL1/CX3CR1 axis; Microglial activation; SOD1G93A mice.
Conflict of interest statement
All experimental procedures on animals in this study were conducted in accordance with the laboratory animals care guidelines and approved by institutional animal care committee at Dalian Medical University.Not applicable.The authors declare that they have no competing interests.
Figures
Similar articles
-
IRAK-M Plays A Role in the Pathology of Amyotrophic Lateral Sclerosis Through Suppressing the Activation of Microglia.Mol Neurobiol. 2024 Oct;61(10):7603-7610. doi: 10.1007/s12035-024-04065-z. Epub 2024 Feb 29. Mol Neurobiol. 2024. PMID: 38421467
-
Evidence for a protective role of the CX3CL1/CX3CR1 axis in a model of amyotrophic lateral sclerosis.Biol Chem. 2019 Apr 24;400(5):651-661. doi: 10.1515/hsz-2018-0204. Biol Chem. 2019. PMID: 30352020
-
Toll-Like Receptor-4 Inhibitor TAK-242 Attenuates Motor Dysfunction and Spinal Cord Pathology in an Amyotrophic Lateral Sclerosis Mouse Model.Int J Mol Sci. 2017 Aug 1;18(8):1666. doi: 10.3390/ijms18081666. Int J Mol Sci. 2017. PMID: 28763002 Free PMC article.
-
CX3CL1/CX3CR1 signaling targets for the treatment of neurodegenerative diseases.Pharmacol Ther. 2022 Mar;231:107989. doi: 10.1016/j.pharmthera.2021.107989. Epub 2021 Sep 4. Pharmacol Ther. 2022. PMID: 34492237 Review.
-
Analysis of the Role of CX3CL1 (Fractalkine) and Its Receptor CX3CR1 in Traumatic Brain and Spinal Cord Injury: Insight into Recent Advances in Actions of Neurochemokine Agents.Mol Neurobiol. 2017 Apr;54(3):2167-2188. doi: 10.1007/s12035-016-9787-4. Epub 2016 Mar 1. Mol Neurobiol. 2017. PMID: 26927660 Free PMC article. Review.
Cited by
-
Amyotrophic lateral sclerosis, a neurodegenerative motor neuron disease with retinal involvement.Neural Regen Res. 2022 May;17(5):1011-1012. doi: 10.4103/1673-5374.324841. Neural Regen Res. 2022. PMID: 34558524 Free PMC article. No abstract available.
-
CCR2 is localized in microglia and neurons, as well as infiltrating monocytes, in the lumbar spinal cord of ALS mice.Mol Brain. 2020 Apr 29;13(1):64. doi: 10.1186/s13041-020-00607-3. Mol Brain. 2020. PMID: 32349774 Free PMC article.
-
Overexpression of miR-124 in Motor Neurons Plays a Key Role in ALS Pathological Processes.Int J Mol Sci. 2021 Jun 7;22(11):6128. doi: 10.3390/ijms22116128. Int J Mol Sci. 2021. PMID: 34200161 Free PMC article.
-
Inflammatory-Mediated Neuron-Glia Communication Modulates ALS Pathophysiology.J Neurosci. 2021 Feb 10;41(6):1142-1144. doi: 10.1523/JNEUROSCI.1970-20.2020. J Neurosci. 2021. PMID: 33568447 Free PMC article. No abstract available.
-
CX3CL1/CX3CR1 axis attenuates early brain injury via promoting the delivery of exosomal microRNA-124 from neuron to microglia after subarachnoid hemorrhage.J Neuroinflammation. 2020 Jul 14;17(1):209. doi: 10.1186/s12974-020-01882-6. J Neuroinflammation. 2020. PMID: 32664984 Free PMC article.
References
LinkOut - more resources
Full Text Sources
Molecular Biology Databases
Research Materials
Miscellaneous
