. 2018 Nov 6;7(21):e010283.
doi: 10.1161/JAHA.118.010283.

Faster Hypothermia Induced by Esophageal Cooling Improves Early Markers of Cardiac and Neurological Injury After Cardiac Arrest in Swine

Affiliations

Faster Hypothermia Induced by Esophageal Cooling Improves Early Markers of Cardiac and Neurological Injury After Cardiac Arrest in Swine

Jiefeng Xu et al. J Am Heart Assoc. .

Abstract

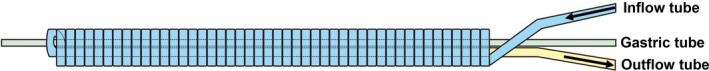
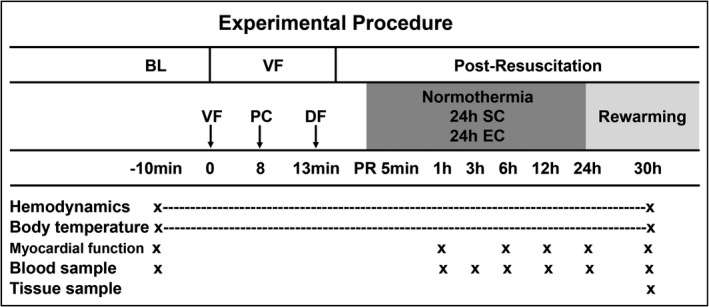
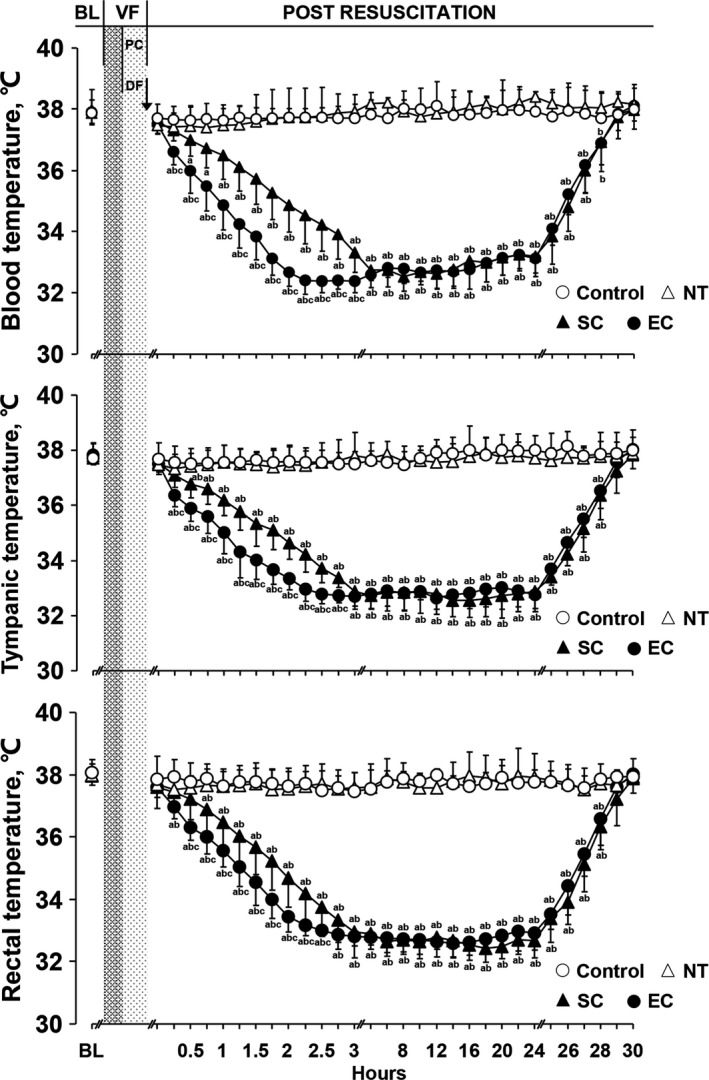
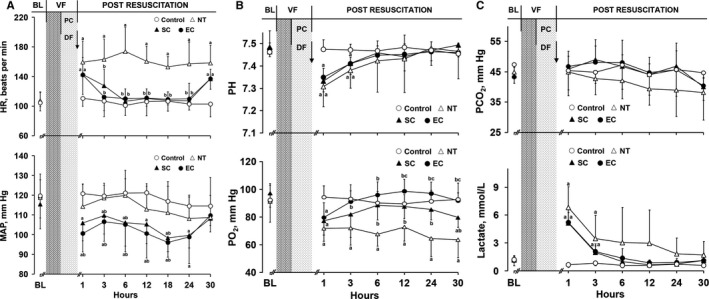
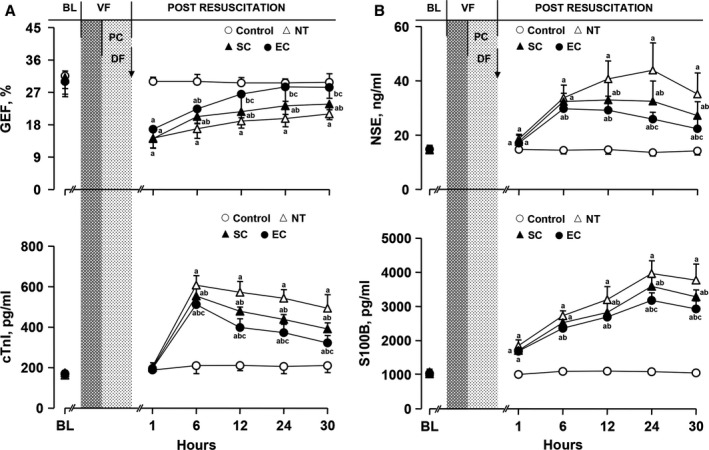
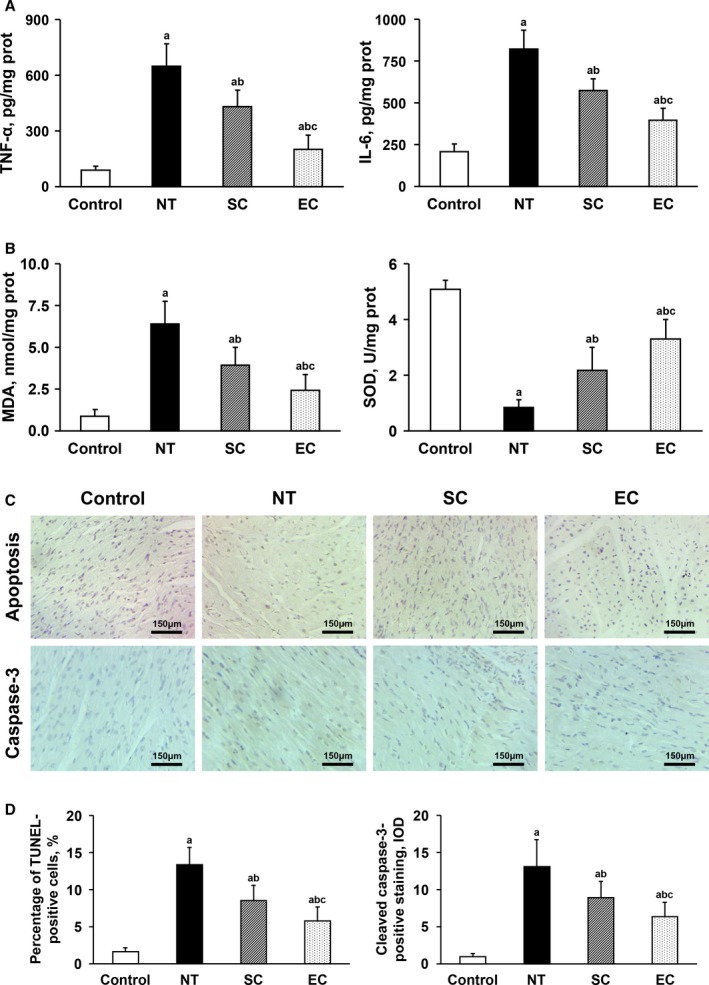
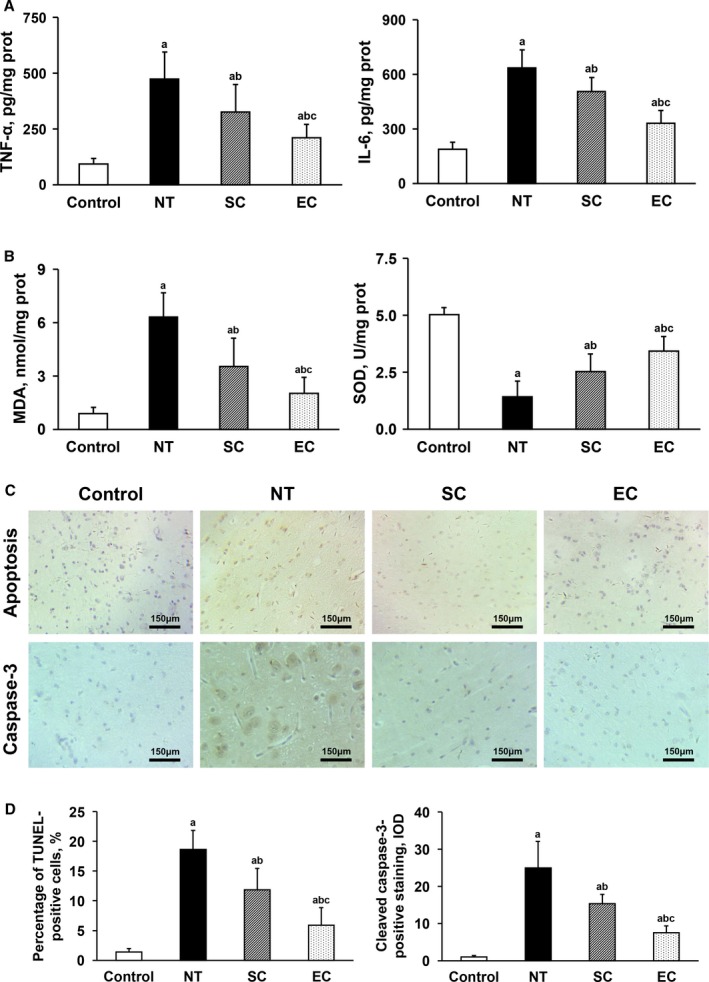
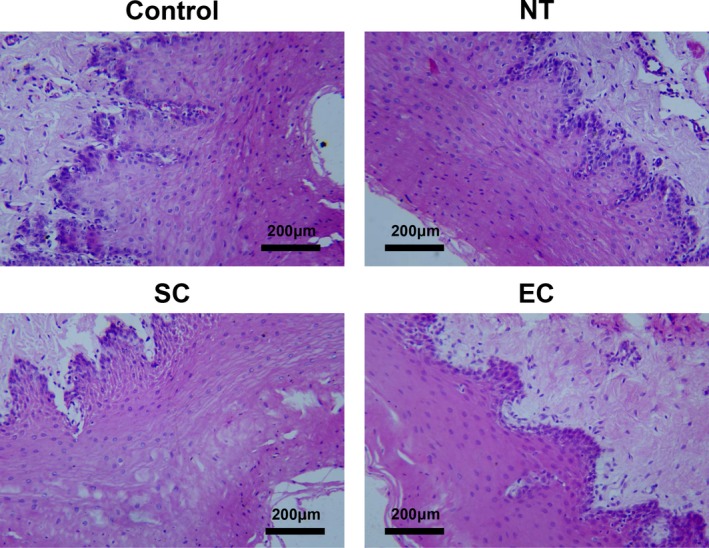
Background After cardiopulmonary resuscitation, the protective effects of therapeutic hypothermia induced by conventional cooling are limited. Recently, esophageal cooling ( EC ) has been shown to be an effective, easily performed approach to induce therapeutic hypothermia. In this study we investigated the efficacy of EC and its effects on early markers of postresuscitation cardiac and neurological injury in a porcine model of cardiac arrest. Methods and Results Thirty-two male domestic swine were randomized into 4 groups: sham control, normothermia, surface cooling, and EC . Sham animals underwent the surgical preparation only. Ventricular fibrillation was induced and untreated for 8 minutes while defibrillation was attempted after 5 minutes of cardiopulmonary resuscitation. At 5 minutes after resuscitation, therapeutic hypothermia was induced by either EC or surface cooling to reach a target temperature of 33°C until 24 hours postresuscitation, followed by a rewarming rate of 1°C/h for 5 hours. The temperature was normally maintained in the control and normothermia groups. After resuscitation, a significantly faster decrease in blood temperature was observed in the EC group than in the surface cooling group (2.8±0.7°C/h versus 1.5±0.4°C/h; P<0.05). During the maintenance and rewarming phases the temperature was maintained at an even level between the 2 groups. Postresuscitation cardiac and neurological damage was significantly improved in the 2 hypothermic groups compared with the normothermia group; however, the protective effects were significantly greater in the EC group. Conclusions In a porcine model of cardiac arrest, faster hypothermia successfully induced by EC was significantly better than conventional cooling in improving early markers of postresuscitation cardiac and neurological injury.

Keywords: cardiac arrest; cardiopulmonary resuscitation; esophageal cooling; organ protection; therapeutic hypothermia.


Figures

Figure 1
Figure 1
The design of the esophageal cooling device.
Figure 2
Figure 2
Experimental outline and procedure. BL indicates baseline; DF, defibrillation; EC, esophageal cooling; PC, precordial compression; PR, post resuscitation; SC, surface cooling; VF, ventricular fibrillation.
Figure 3
Figure 3
The changes of blood, tympanic, and rectal temperatures in the different groups (note: except the control group containing 5 swine, the other groups have 8 swine each). a P<0.05 vs Control group, b P<0.05 vs NT group, c P<0.05 vs SC group. The bar length represents the standard deviation. BL indicates baseline; DF, defibrillation; EC, esophageal cooling; NT, normothermia; PC, precordial compression; SC, surface cooling; VF, ventricular fibrillation.
Figure 4
Figure 4
The changes of hemodynamics, blood gases, and lactate in the different groups (note: the control group contained 5 swine; the other groups had 8 swine each). A, Heart rate (HR) and mean arterial pressure (MAP). B, Arterial pH and po 2. C, Arterial pco 2 and lactate. a P<0.05 vs Control group, b P<0.05 vs NT group, c P<0.05 vs SC group. The bar length represents the standard deviation. BL indicates baseline; DF, defibrillation; EC, esophageal cooling; NT, normothermia; PC, precordial compression; SC, surface cooling; VF, ventricular fibrillation.
Figure 5
Figure 5
Changes of myocardial function and serum cardiac and cerebral biomarkers in the different groups (note: the control group contained 5 swine; the other groups had 8 swine each). A, Global ejection fraction (GEF) and serum cardiac troponin I (cTnI). B, Serum neuron‐specific enolase (NSE) and S100B protein (S100B). a P<0.05 vs Control group, b P<0.05 vs NT group, c P<0.05 vs SC group. The bar length represents the standard deviation. BL indicates baseline; DF, defibrillation; EC, esophageal cooling; NT, normothermia; PC, precordial compression; SC, surface cooling; VF, ventricular fibrillation.
Figure 6
Figure 6
Comparisons of tissue inflammation, oxidative stress, and cell apoptosis in the heart among the 4 groups (note: the control group contained 5 swine; the other groups had 8 swine each). A, Tumor necrosis factor‐α (TNF‐α) and interleukin‐6 (IL‐6). B, Malondialdehyde (MDA) and superoxide dismutase (SOD). C, Representative photomicrographs of TdT‐mediated dUTP nick end labeling (TUNEL) assay and cleaved caspase‐3 immunostaining (×200 magnification). D, The percentage of TUNEL‐positive cells and the integrated optical density (IOD) values of cleaved caspase‐3–positive staining. a P<0.05 vs Control group, b P<0.05 vs NT group, c P<0.05 vs SC group. The bar length represents the standard deviation. EC indicates esophageal cooling; NT, normothermia; SC, surface cooling.
Figure 7
Figure 7
Comparisons of tissue inflammation, oxidative stress, and cell apoptosis in the brain among the 4 groups (note: the control group contained 5 swine; the other groups had 8 swine each). A, Tumor necrosis factor‐α (TNF‐α) and interleukin‐6 (IL‐6). B, Malondialdehyde (MDA) and superoxide dismutase (SOD). C, Representative photomicrographs of TdT‐mediated dUTP nick end labeling (TUNEL) assay and cleaved caspase‐3 immunostaining (×200 magnification). D, The percentage of TUNEL‐positive cells and the integrated optical density (IOD) values of cleaved caspase‐3–positive staining. a P<0.05 vs Control group, b P<0.05 vs NT group, c P<0.05 vs SC group. The bar length represents the standard deviation. EC indicates esophageal cooling; NT, normothermia; SC, surface cooling.
Figure 8
Figure 8
Representative photomicrographs of tissue pathology of lower esophagus in the different groups. EC indicates esophageal cooling; NT, normothermia; SC, surface cooling.

Similar articles

Cited by

References

    1. Laurent I, Monchi M, Chiche JD, Joly LM, Spaulding C, Bourgeois B, Cariou A, Rozenberg A, Carli P, Weber S, Dhainaut JF. Reversible myocardial dysfunction in survivors of out‐of‐hospital cardiac arrest. J Am Coll Cardiol. 2002;40:2110–2116. - PubMed
    1. Laver S, Farrow C, Turner D, Nolan J. Mode of death after admission to an intensive care unit following cardiac arrest. Intensive Care Med. 2004;30:2126–2128. - PubMed
    1. Lu X, Ma L, Sun S, Xu J, Zhu C, Tang W. The effects of the rate of postresuscitation rewarming following hypothermia on outcomes of cardiopulmonary resuscitation in a rat model. Crit Care Med. 2014;42:e106–e113. - PubMed
    1. Chenoune M, Lidouren F, Adam C, Pons S, Darbera L, Bruneval P, Ghaleh B, Zini R, Dubois‐Randé JL, Carli P, Vivien B, Ricard JD, Berdeaux A, Tissier R. Ultrafast and whole‐body cooling with total liquid ventilation induces favorable neurological and cardiac outcomes after cardiac arrest in rabbits. Circulation. 2011;124:901–911, 1–7. - PMC - PubMed
    1. Lin S, Scales DC, Dorian P, Kiss A, Common MR, Brooks SC, Goodman SG, Salciccioli JD, Morrison LJ. Targeted temperature management processes and outcomes after out‐of‐hospital cardiac arrest: an observational cohort study. Crit Care Med. 2014;42:2565–2574. - PubMed

Publication types