

Drivers of Variation in 90-Day Episode Payments After Percutaneous Coronary Intervention
- PMID: 30608883
- PMCID: PMC6857730
- DOI: 10.1161/CIRCINTERVENTIONS.118.006928
Drivers of Variation in 90-Day Episode Payments After Percutaneous Coronary Intervention
Abstract
Background: Percutaneous coronary intervention (PCI) is a common and expensive procedure that has become a target for bundled payment initiatives. We described the magnitude and determinants of variation in 90-day PCI episode payments across a diverse array of patients and hospitals.
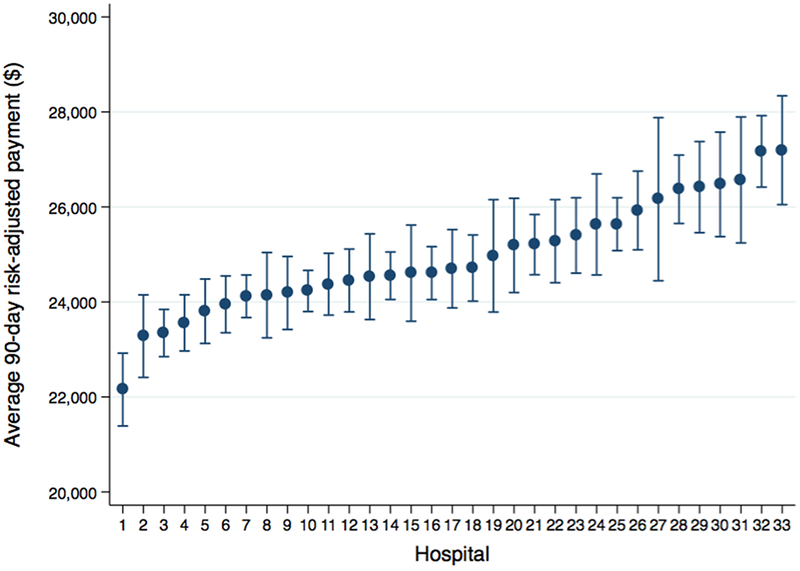
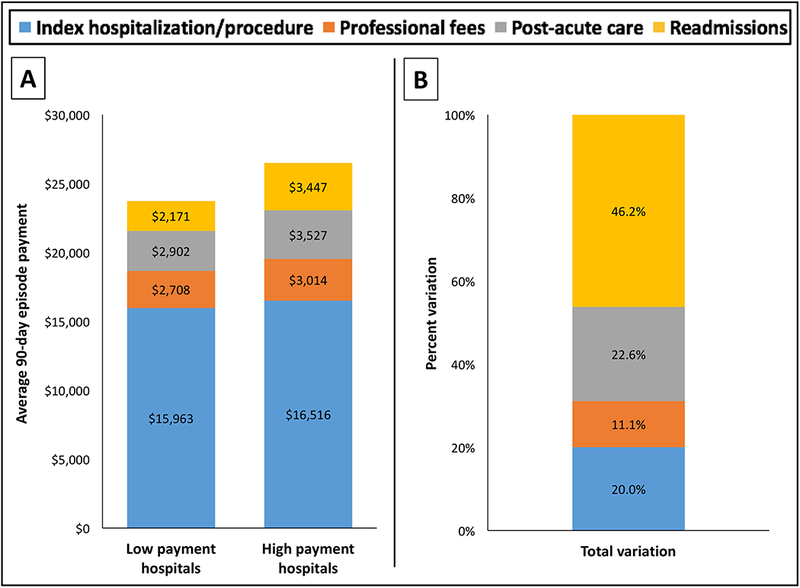
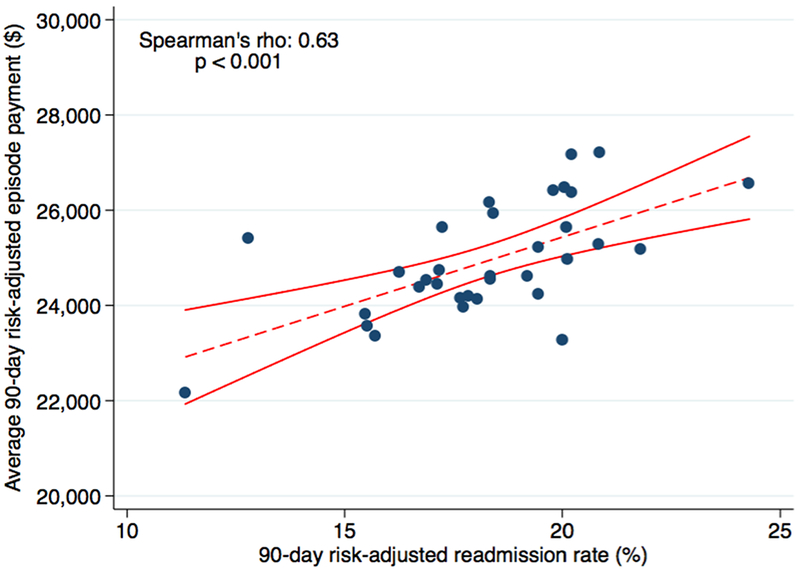
Methods and results: We linked clinical registry data from PCIs performed at 33 Michigan hospitals to 90-day episodes of care constructed using Medicare fee-for-service and commercial insurance claims from January 2012 to October 2016. Payments were price standardized and risk adjusted using clinical and administrative variables in an observed-over-expected framework. Hospitals were stratified into quartiles based on average episode payments. Payment components between the highest and the lowest quartiles were compared with identified drivers of variation (ie, index hospitalization/procedure, readmissions, postacute care, and professional fees). Among 40 925 90-day PCI episodes, the average risk-adjusted 90-day episode payment by hospital ranged between $22 154 and $27 205 with a median of $24 696 (interquartile range, $24 190-$25 643). Hospitals in the lowest and the highest quartiles had average episode payments of $23 744 and $26 504, respectively (difference, $2760). Readmission payments were the primary driver of this variation (46.2%), followed by postacute care (22.6%). Readmissions remained the primary driver of variation in key subgroups, including inpatient and outpatient PCI, as well as PCI for acute myocardial infarction and nonacute myocardial infarction indications.
Conclusions: Substantial hospital-level variation exists in 90-day PCI episode payments. Over half the variation between high- and low-payment hospitals was related to care after the index procedure, primarily because of readmissions and postacute care. Hospitals and policymakers should consider targeting these components when developing initiatives to reduce PCI-related spending.
Keywords: episode of care; health expenditures; hospitals; myocardial infarction; patient readmission; percutaneous coronary intervention.
Figures
Similar articles
-
Impact of Medicare's Bundled Payments Initiative on Patient Selection, Payments, and Outcomes for Percutaneous Coronary Intervention and Coronary Artery Bypass Grafting.Circ Cardiovasc Qual Outcomes. 2020 Sep;13(9):e006171. doi: 10.1161/CIRCOUTCOMES.119.006171. Epub 2020 Sep 1. Circ Cardiovasc Qual Outcomes. 2020. PMID: 32867514 Free PMC article.
-
Drivers of Payment Variation in 90-Day Coronary Artery Bypass Grafting Episodes.JAMA Surg. 2018 Jan 1;153(1):14-19. doi: 10.1001/jamasurg.2017.2881. JAMA Surg. 2018. PMID: 28832865 Free PMC article.
-
Exploring the Healthcare Value of Percutaneous Coronary Intervention: Appropriateness, Outcomes, and Costs in Michigan Hospitals.Circ Cardiovasc Qual Outcomes. 2018 Jun;11(6):e004328. doi: 10.1161/CIRCOUTCOMES.117.004328. Circ Cardiovasc Qual Outcomes. 2018. PMID: 29853465 Free PMC article.
-
Paying for Performance Improvement in Quality and Outcomes of Cardiovascular Care: Challenges and Prospects.Methodist Debakey Cardiovasc J. 2020 Jul-Sep;16(3):225-231. doi: 10.14797/mdcj-16-3-225. Methodist Debakey Cardiovasc J. 2020. PMID: 33133359 Free PMC article. Review.
-
The Impact Of Bundled Payment On Health Care Spending, Utilization, And Quality: A Systematic Review.Health Aff (Millwood). 2020 Jan;39(1):50-57. doi: 10.1377/hlthaff.2019.00784. Health Aff (Millwood). 2020. PMID: 31905061
Cited by
-
Evaluation of Risk-Adjusted Home Time After Acute Myocardial Infarction as a Novel Hospital-Level Performance Metric for Medicare Beneficiaries.Circulation. 2020 Jul 7;142(1):29-39. doi: 10.1161/CIRCULATIONAHA.119.044765. Epub 2020 May 15. Circulation. 2020. PMID: 32408764 Free PMC article.
-
Challenges and Burdens in the Coronary Artery Disease Care Pathway for Patients Undergoing Percutaneous Coronary Intervention: A Contemporary Narrative Review.Int J Environ Res Public Health. 2023 Apr 25;20(9):5633. doi: 10.3390/ijerph20095633. Int J Environ Res Public Health. 2023. PMID: 37174152 Free PMC article. Review.
-
Assessment of Patterns of Atherectomy Use.J Am Heart Assoc. 2022 Nov 15;11(22):e023356. doi: 10.1161/JAHA.121.023356. Epub 2022 Oct 27. J Am Heart Assoc. 2022. PMID: 36300666 Free PMC article.
-
Impact of Medicare's Bundled Payments Initiative on Patient Selection, Payments, and Outcomes for Percutaneous Coronary Intervention and Coronary Artery Bypass Grafting.Circ Cardiovasc Qual Outcomes. 2020 Sep;13(9):e006171. doi: 10.1161/CIRCOUTCOMES.119.006171. Epub 2020 Sep 1. Circ Cardiovasc Qual Outcomes. 2020. PMID: 32867514 Free PMC article.
-
Hospital Heart Failure Medical Therapy Score and Associated Clinical Outcomes and Costs.JAMA Cardiol. 2024 Nov 1;9(11):1029-1038. doi: 10.1001/jamacardio.2024.2969. JAMA Cardiol. 2024. PMID: 39320905
References
-
- Benjamin EJ, Blaha MJ, Chiuve SE, Cushman M, Das SR, Deo R, de Ferranti SD, Floyd J, Fornage M, Gillespie C, Isasi CR, Jimenez MC, Jordan LC, Judd SE, Lackland D, Lichtman JH, Lisabeth L, Liu S, Longenecker CT, Mackey RH, Matsushita K, Mozaffarian D, Mussolino ME, Nasir K, Neumar RW, Palaniappan L, Pandey DK, Thiagarajan RR, Reeves MJ, Ritchey M, Rodriguez CJ, Roth GA, Rosamond WD, Sasson C, Towfighi A, Tsao CW, Turner MB, Virani SS, Voeks JH, Willey JZ, Wilkins JT, Wu JH, Alger HM, Wong SS, Muntner P, American Heart Association Statistics C and Stroke Statistics S. Heart Disease and Stroke Statistics-2017 Update: A Report From the American Heart Association. Circulation. 2017;135:e146–e603. - PMC - PubMed
-
- Advisory Board. Commercial bundled payment tracker. 2013. Available at: https://www.advisory.com/Research/Health-Care-Advisory-Board/Resources/2.... Accessed November 28, 2017.
-
- Integrated Healthcare Association. Bundled Payment. Available at: http://www.iha.org/our-work/insights/bundled-payment. Accessed November 29, 2017.
-
- CMS.gov. Centers for Medicare & Medicaid Services. Bundled Payments for Care Improvement (BPCI) initiative. April 18, 2016. Available at: https://innovation.cms.gov/initiatives/bundled-payments/. Accessed November 15, 2017.
Publication types
MeSH terms
Grants and funding
LinkOut - more resources
Full Text Sources
Medical
Miscellaneous
