. 2019 Jan 4;14(1):e0204197.
doi: 10.1371/journal.pone.0204197. eCollection 2019.

Transcriptomic characterization of signaling pathways associated with osteoblastic differentiation of MC-3T3E1 cells

Affiliations

Transcriptomic characterization of signaling pathways associated with osteoblastic differentiation of MC-3T3E1 cells

Louis M Luttrell et al. PLoS One. .

Abstract

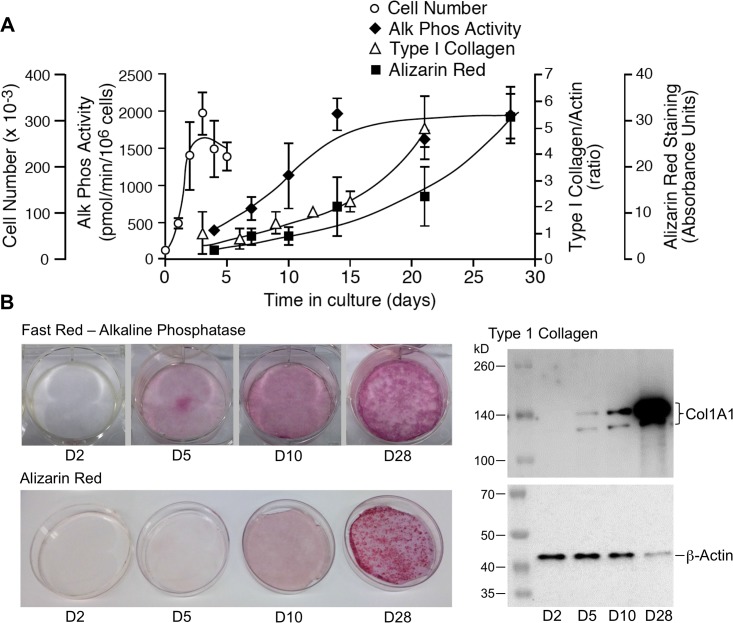
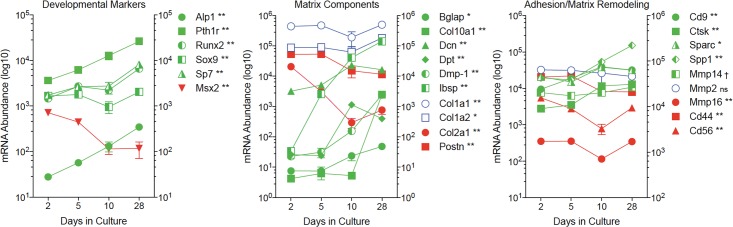
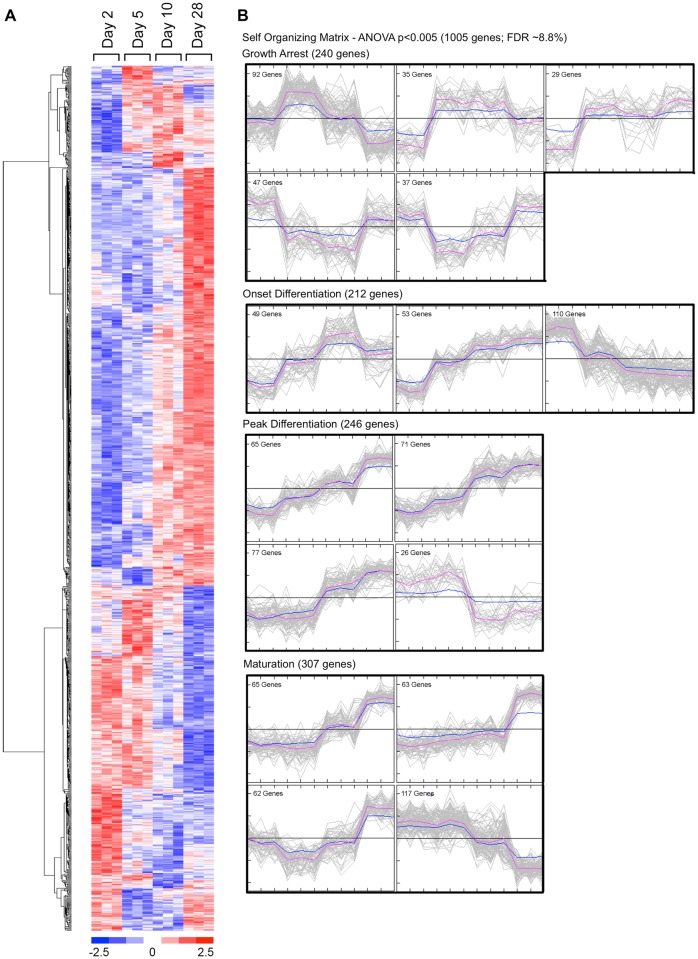
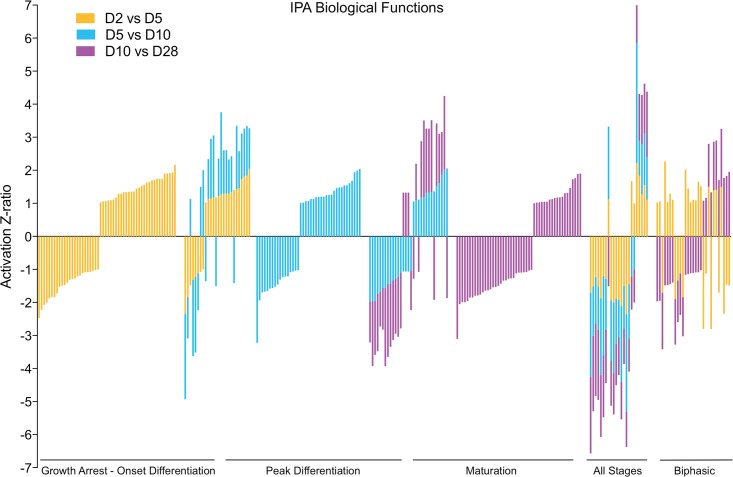
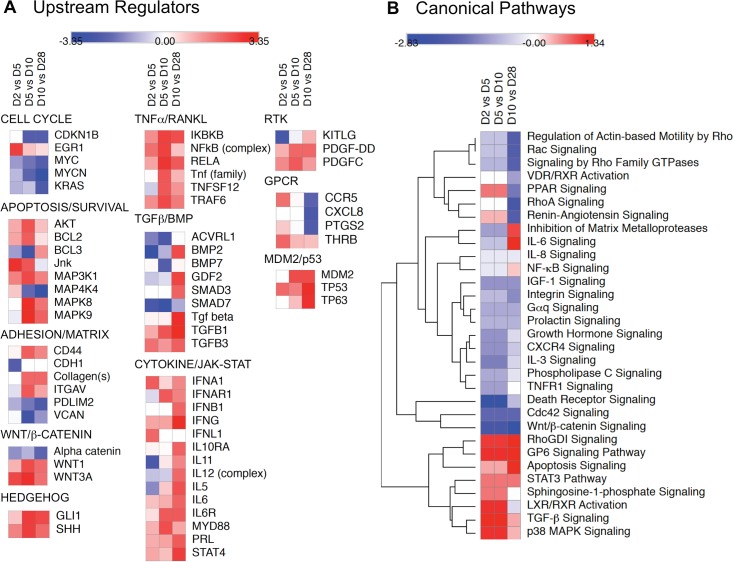
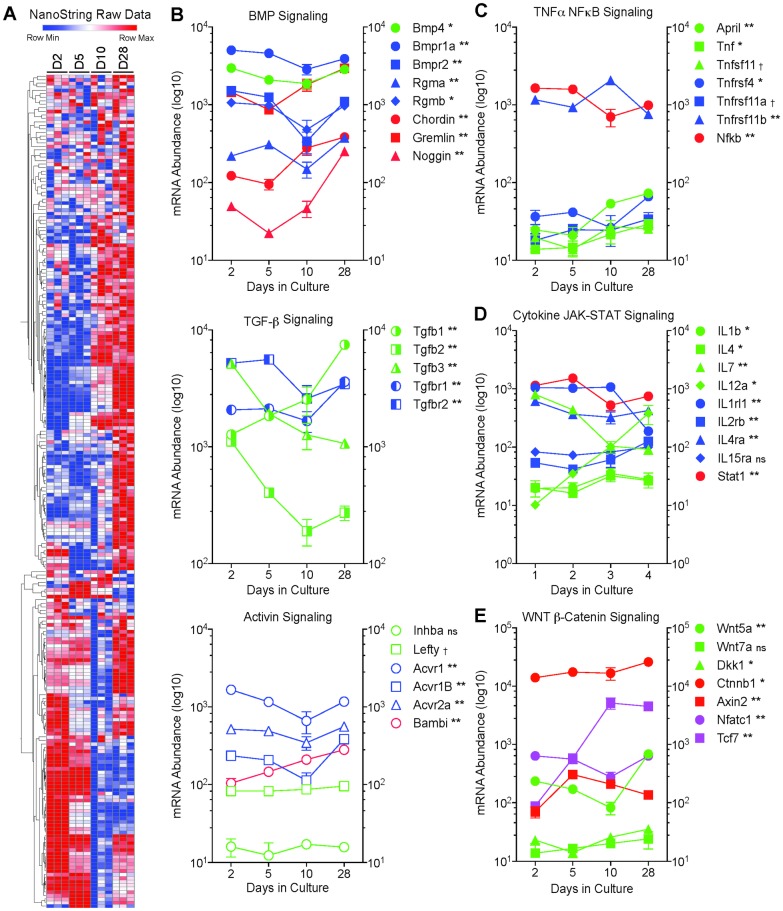
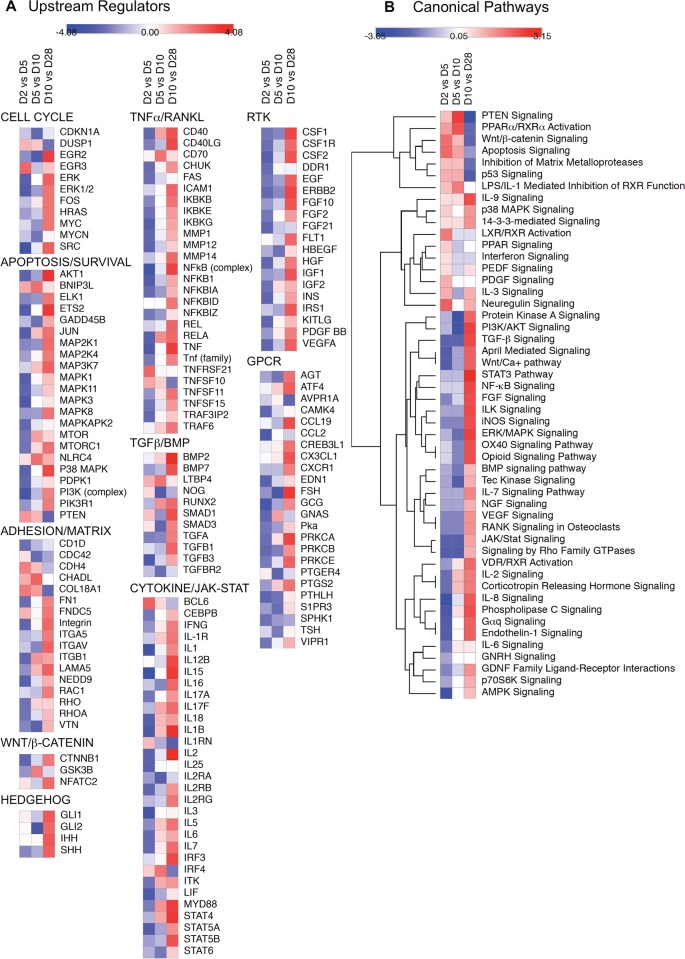
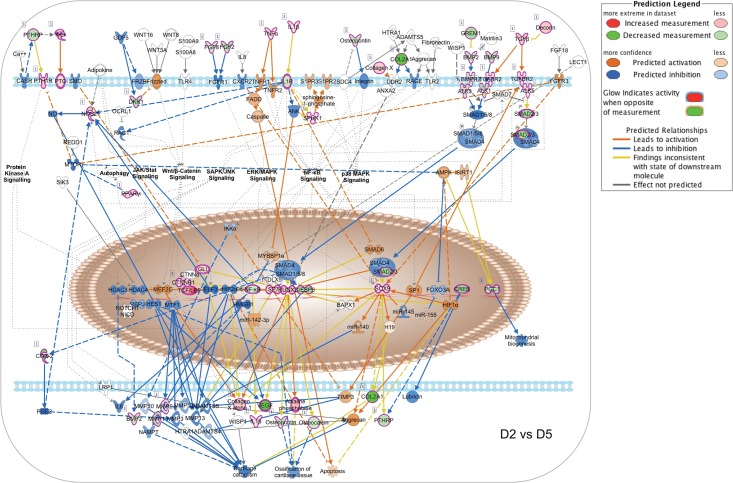
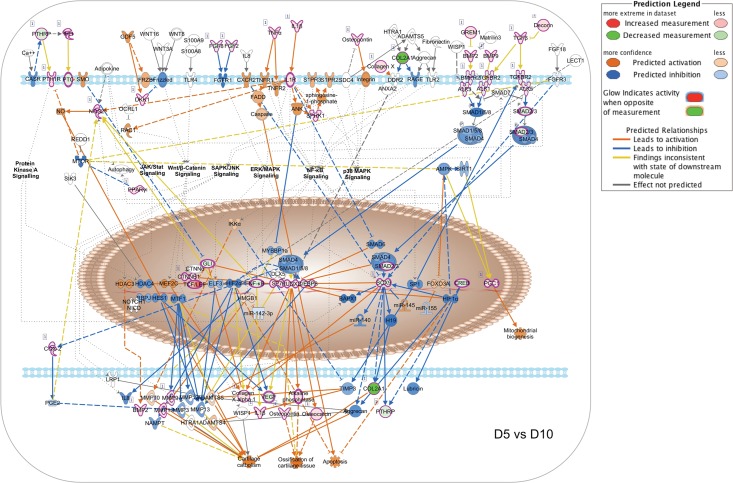
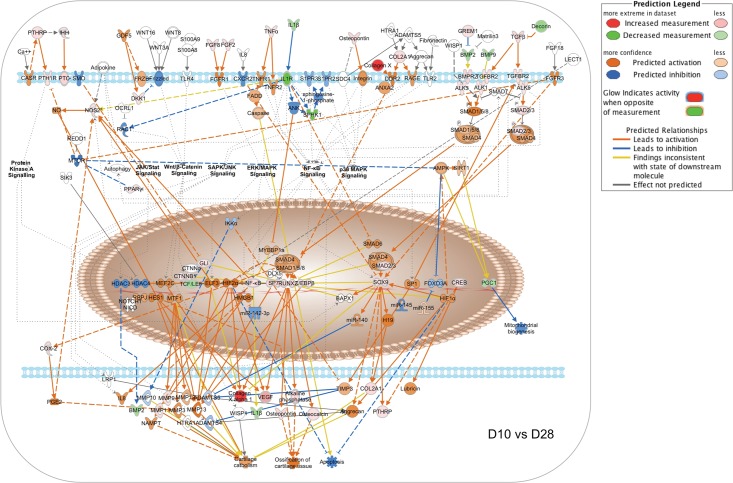
Bone remodeling involves the coordinated actions of osteoclasts, which resorb the calcified bony matrix, and osteoblasts, which refill erosion pits created by osteoclasts to restore skeletal integrity and adapt to changes in mechanical load. Osteoblasts are derived from pluripotent mesenchymal stem cell precursors, which undergo differentiation under the influence of a host of local and environmental cues. To characterize the autocrine/paracrine signaling networks associated with osteoblast maturation and function, we performed gene network analysis using complementary "agnostic" DNA microarray and "targeted" NanoString nCounter datasets derived from murine MC3T3-E1 cells induced to undergo synchronized osteoblastic differentiation in vitro. Pairwise datasets representing changes in gene expression associated with growth arrest (day 2 to 5 in culture), differentiation (day 5 to 10 in culture), and osteoblast maturation (day 10 to 28 in culture) were analyzed using Ingenuity Systems Pathways Analysis to generate predictions about signaling pathway activity based on the temporal sequence of changes in target gene expression. Our data indicate that some pathways involved in osteoblast differentiation, e.g. Wnt/β-catenin signaling, are most active early in the process, while others, e.g. TGFβ/BMP, cytokine/JAK-STAT and TNFα/RANKL signaling, increase in activity as differentiation progresses. Collectively, these pathways contribute to the sequential expression of genes involved in the synthesis and mineralization of extracellular matrix. These results provide insight into the temporal coordination and complex interplay between signaling networks controlling gene expression during osteoblast differentiation. A more complete understanding of these processes may aid the discovery of novel methods to promote osteoblast development for the treatment of conditions characterized by low bone mineral density.


Conflict of interest statement

The authors have declared that no competing interests exist.

Figures

Fig 1
Fig 1. MC3T3-E1 osteoblast maturation in vitro.
MC3T3-E1 cells were seeded in 6-well tissue culture plates at an initial density of 20,000 cells/well and maintained in culture for up to 28 days. A. Graph depicting change in cell number (days 1–5), secreted alkaline phosphatase activity (days 4–28), type 1 collagen synthesis (days 3–21), and matrix mineralization (days 4–28) associated with MC3T3-E1 differentiation. Data shown are the Mean ± SE of three biological replicates at each time point. These data were used to select time points representing proliferating preosteoblasts (day 2), early and late differentiating osteoblasts (days 5 and 10), and active osteoblasts (day 28), for subsequent mRNA isolation. B. Representative Fast Red staining for alkaline phosphatase (top left), type 1 collagen:β-actin western blotting (right), and Alizarin Red staining for matrix mineralization (bottom left) performed at days 2, 5, 10 and 28 to illustrate the differentiation state of cells at the time points used for RNA isolation. Note that as MC3T3-E1 osteoblasts mature, extracellular matrix, e.g. type 1 collagen, becomes an increasingly large fraction of the total protein in the sample.
Fig 2
Fig 2. Temporal changes in the abundance of mRNA encoding bone marker proteins.
Total RNA was isolated from triplicate cultures of MC3T3-E1 cells at days 2, 5, 10 and 28 in culture, and mRNA abundance quantified by NanoString nCounter using a bone focused probe set (S1 Table). Developmental markers shown are: alkaline phosphatase (Alp1); parathyroid hormone receptor (Pthr1); the transcription factors Runx2, Sox9 and Sp7; and the transcriptional repressor Msx2. Matrix components shown are: bone gamma-carboxyglutamate protein (Bglap); collagen types 1A1 (Col1a1), 1A2 (Col1a2), 2A1 (Col2a1) and 10A1 (Col10a1); decorin (Dcn); dermatopontin (Dpt); dentin matrix protein-1 (Dmp-1); integrin-binding sialoprotein (Ibsp); and periostin (Postn). Proteins associated with cell adhesion and matrix remodeling are: tetraspanin (Cd9); cathepsin K (Ctsk); osteonectin (Sparc); osteopontin (Spp1); matrix metalloproteinases 2 (Mmp2), 14 (Mmp14), and 16 (Mmp16); hyaluronic acid receptor (Cd44); and neural cell adhesion molecule 1 (Cd56). Data shown represent the Mean ± SD of three biological replicates at each time point. Error bars not shown are smaller than the symbol. † P < 0.05; * P < 0.01; ** P < 0.001 different in abundance between at least two time points by two-way ANOVA with Tukey’s multiple comparisons test; ns, not significant.
Fig 3
Fig 3. Temporal patterns of change in the MC3T3-E1 transcriptome during differentiation.
Total RNA was isolated from three independent MC3T3-E1 cell cultures following 2, 5, 10 or 28 days in culture. Each biological replicate was hybridized to an Operon version 2.0 spotted oligonucleotide array (12 microarrays). Triplicate microarray data at each time point were used to identify significantly regulated mRNAs at different phases of osteoblast differentiation by ANOVA (p<0.005; estimated false discovery rate 8.8%). A. Heat map representing observed mRNA abundance of 1005 genes identified by ANOVA as demonstrating a significant difference between any two time points. Hierarchical clustering was used to identify coordinated patterns of change. B. Sixteen cluster SOM representing temporal changes in mRNA abundance associated with MC3T3-E1 differentiation. Expression data were subjected to z-standardization and SOM assembled using MeV software. The resulting 16 SOM clusters are shown grouped in relation to the differentiation state of MC3T3-E1 cells. Growth arrest was associated with abrupt changes (increase or decrease) in mRNA levels between days 2 and 5 (240 genes). The onset of differentiation was associated with progressive changes in mRNA levels between days 2 and 10 (212 genes). Peak differentiation was associated with prominent changes in mRNA levels between days 5 and 10 (246 genes). Osteoblast maturation was associated with prominent changes in mRNA levels between days 10 and 28 (307 genes).
Fig 4
Fig 4. Temporal changes in mRNA abundance reflect evolving biological processes during MC3T3-E1 differentiation.
The mRNA abundance of 976 significantly regulated genes identified by ANOVA as changing during MC3T3-E1 differentiation was used to calculate expression ratios comparing D2 vs D5, D5 vs D10, and D10 vs D28. For each pairwise comparison, the earlier time point was used as the denominator and later time point as the numerator, such that expression ratios reflect increases/decreases in mRNA abundance as differentiation proceeds. IPA Downstream Effects Analysis was performed to identify biological process terms associated with each interval and filtered to include terms only with –log(p value) >1.3, minimum of two genes, and z-score >1 or <-1. The graph depicts z-score values for terms associated with the period of growth arrest and onset of differentiation (gold bars), active differentiation (blue bars), and osteoblast maturation (lavender bars). The descriptive annotations associated with each term are omitted for simplicity but presented in S3 Table.
Fig 5
Fig 5. Temporal changes in predicted upstream regulators and canonical signaling pathways associated with MC3T3-E1 cell differentiation.
Microarray data on the 976 significantly regulated mRNA species were used to calculate change in expression ratio between D2 vs D5, D5 vs D10, and D10 vs D28. Expression ratios were analyzed using IPA Upstream Regulator and Canonical Pathways Analysis software and heat maps reflecting the changes in predicted activity during each interval were generated using Morpheus software. A. Heat maps depicting changes in selected upstream regulators (rows) with activation z-scores >2 (red) or <-2 (blue) during at least one phase of differentiation (columns). Upstream regulators were arbitrarily grouped based on their involvement is biological processes or signaling pathways related to osteoblast differentiation. B. Heat maps depicting changes in z-score for selected canonical signaling pathways (rows) during each phase of differentiation (columns). Z-scores were subjected to Euclidean hierarchical clustering in Morpheus to group pathways based on similarity in temporal change.
Fig 6
Fig 6. NanoString analysis of bone-related mRNAs during MC3T3-E1 cell differentiation.
Total RNA was isolated from three independent cultures of MC3T3-E1 cells at days 2, 5, 10 and 28, and mRNA abundance quantified by NanoString nCounter using a bone specific Code Set (S1 Table). A. Heat map depicting changes in mRNA abundance for individual mRNA species (rows) over time in culture (columns) for day 2 (D2), day 5 (D5), day 10 (D10), and day 28 (D28). Expression data, after log2 adjustment, were subjected to Euclidean heirarchical clustering in Morpheus to group genes based on similarity in temporal change. mRNA abundance of selected ligands, receptors, modulators, and mediators related to BMP/TGFβ/Activin (B), TNFα/NFκB (C), IL/JAK-STAT (D), and WNT/β-catenin (E) signaling. BMP pathway components shown are: BMP 4 (Bmp4); BMP receptor 1A (Bmpr1a); BMP receptor 2 (Bmpr2); the BMP co-receptors, repulsive guidance molecule (RGM) A (Rgma) and RGM B (Rgmb); the BMP negative regulators, Chordin and Noggin; and the DAN family BMP antagonist, Gremlin. TGFβ pathway components shown are: TGFβ1 (Tgfb1); TGFβ2 (Tgfb2); TGFβ3 (Tgfb3); TGFβ receptor 1 (Tgfbr1); and TGFβ receptor 2 (Tgfbr2). Activin pathway components shown are: inhibin subunit βA (Inhba); activin A receptor type 1 (Acvr1); activin A receptor type 1B (Acvr1b); activin A receptor type 2A (Acvr2a); BMP and activin membrane bound inhibitor (Bambi); and the activin and TGFβ receptor ligand, left-right determination factor 1 (Lefty). TNFα pathway components shown are: TNF ligand superfamily member 13-like (April); TNF (Tnf); RANKL (Tnfsf11); TNF-receptor superfamily member 4 (Tnfrsf4); receptor activator of NFκB (Tnfrsf11a); TNF receptor superfamily member 11b (Tnfrsf11b); and NFκB (Nfkb). Interleukin pathway components shown are: IL1B (Il1b); IL4 (Il4); IL7 (Il7); IL12A (Il12a); IL1 receptor-like 1 (Il1rl1); IL2 receptor β subunit (Il2rb); IL4 receptor α subunit (Il4ra); IL15 receptor α subunit (Il15ra); and STAT1 (Stat1). WNT pathway components shown are: WNT 5A (Wnt5a); Wnt 7A (Wnt7a); the WNT signaling pathway inhibitor, Dickkopf (Dkk1); β-catenin (Ctnnb1); the regulator of β-catenin stability, Axin 2 (Axin2); and the β-catenin regulated transcription factors, nuclear factor of activated T cells 1 (Nfatc1) and transcription factor 7 (Tcf7). In each graph, symbols representing ligands are shown in green, receptor subunits in blue, intracellular mediators and modulators in red, and transcription factors in lavender. Data shown represent the Mean ± SD of triplicate samples. Error bars not shown are smaller than the symbol. † P<0.05; * P<0.01; ** P<0.001 different in abundance between at least two time points by two-way ANOVA with Tukey’s multiple comparisons test; ns, not significant.
Fig 7
Fig 7. Upstream regulators and canonical signaling pathways analysis of a focused NanoString dataset.
NanoString nCounter data on the abundance of 237 bone-related mRNA species were used to calculate change in expression ratio between D2 vs D5, D5 vs D10, and D10 vs D28. Expression ratios were analyzed using IPA Upstream Regulator and Canonical Pathways Analysis software and heat maps reflecting the changes in predicted activity during each interval were generated using Morpheus software. A. Heat maps depicting changes in selected upstream regulators (rows) with activation z-scores >2 (red) or <-2 (blue) during at least one phase of differentiation (columns). Upstream regulators were arbitrarily grouped based on their relationship to biological processes or signaling pathways involved in osteoblast differentiation. B. Heat maps depicting changes in z-score for selected canonical signaling pathways (rows) during each phase of differentiation (columns). Z-scores were subjected to Euclidean hierarchical clustering in Morpheus to group pathways based on similarity in temporal change.
Fig 8
Fig 8. Changes in canonical signaling pathway activity in MC3T3-E1 cells between days 2 and 5.
Expression ratios representing the changing abundance of 237 bone-related mRNA species in MC3T3-E1 cells between days 2 and 5 in culture were used to populate the IPA osteoarthritis pathway network and signaling pathway activation state was assessed using the IPA molecular pathway predictor tool. As indicated in the prediction legend, observed upregulation and downregulation of mRNAs are shown in red and green, respectively, while predicted activation or inhibition of signaling intermediates and pathways are shown in orange and blue.
Fig 9
Fig 9. Changes in canonical signaling pathway activity in MC3T3-E1 cells between days 5 and 10.
Expression ratios representing the changing abundance of 237 bone-related mRNA species in MC3T3-E1 cells between days 5 and 10 in culture were used to populate the IPA osteoarthritis pathway network and signaling pathway activation state was assessed using the IPA molecular pathway predictor tool. Observed upregulation and downregulation of mRNAs are shown in red and green, respectively, while predicted activation or inhibition of signaling intermediates and pathways are shown in orange and blue.
Fig 10
Fig 10. Changes in canonical signaling pathway activity in MC3T3-E1 cells between days 10 and 28.
Expression ratios representing the changing abundance of 237 bone-related mRNA species in MC3T3-E1 cells between days 10 and 28 in culture were used to populate the IPA osteoarthritis pathway network and signaling pathway activation state was assessed using the IPA molecular pathway predictor tool. Observed upregulation and downregulation of mRNAs are shown in red and green, respectively, while predicted activation or inhibition of signaling intermediates and pathways are shown in orange and blue.

Similar articles

Cited by

References

    1. Raisz LG. Physiology and pathophysiology of bone remodeling. Clin Chem. 1999;45:1353–8. - PubMed
    1. Hadjidakis DJ, Androulakis II. Bone remodeling. Ann N Y Acad Sci. 2006;1092:385–96. 10.1196/annals.1365.035 - DOI - PubMed
    1. Raisz LG. Pathogenesis of osteoporosis: concepts, conflicts, and prospects. J Clin Invest. 2005;115:3318–25. 10.1172/JCI27071 - DOI - PMC - PubMed
    1. Wu M, Chen G, Li YP. TGF-β and BMP signaling in osteoblast, skeletal development, and bone formation, homeostasis and disease. Bone Res. 2016;4:16009 10.1038/boneres.2016.9 - DOI - PMC - PubMed
    1. Allison DB, Cui X, Page GP, Sabripour M. Microarray data analysis: from disarray to consolidation and consensus. Nat Rev Genet. 2006;7:55–65. 10.1038/nrg1749 - DOI - PubMed

Publication types