. 2019 Jan 4;14(1):e0209573.
doi: 10.1371/journal.pone.0209573. eCollection 2019.

Glycosaminoglycans from Alzheimer's disease hippocampus have altered capacities to bind and regulate growth factors activities and to bind tau

Affiliations

Glycosaminoglycans from Alzheimer's disease hippocampus have altered capacities to bind and regulate growth factors activities and to bind tau

Minh Bao Huynh et al. PLoS One. .

Abstract

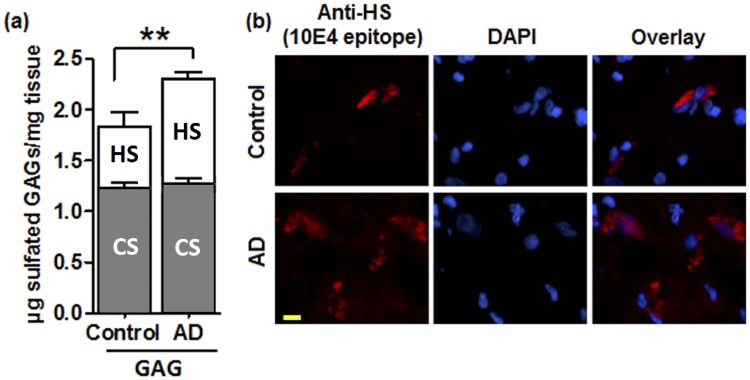
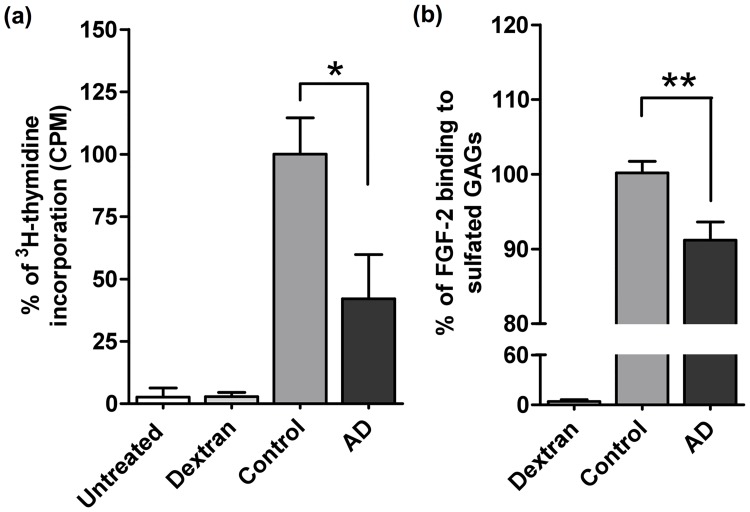
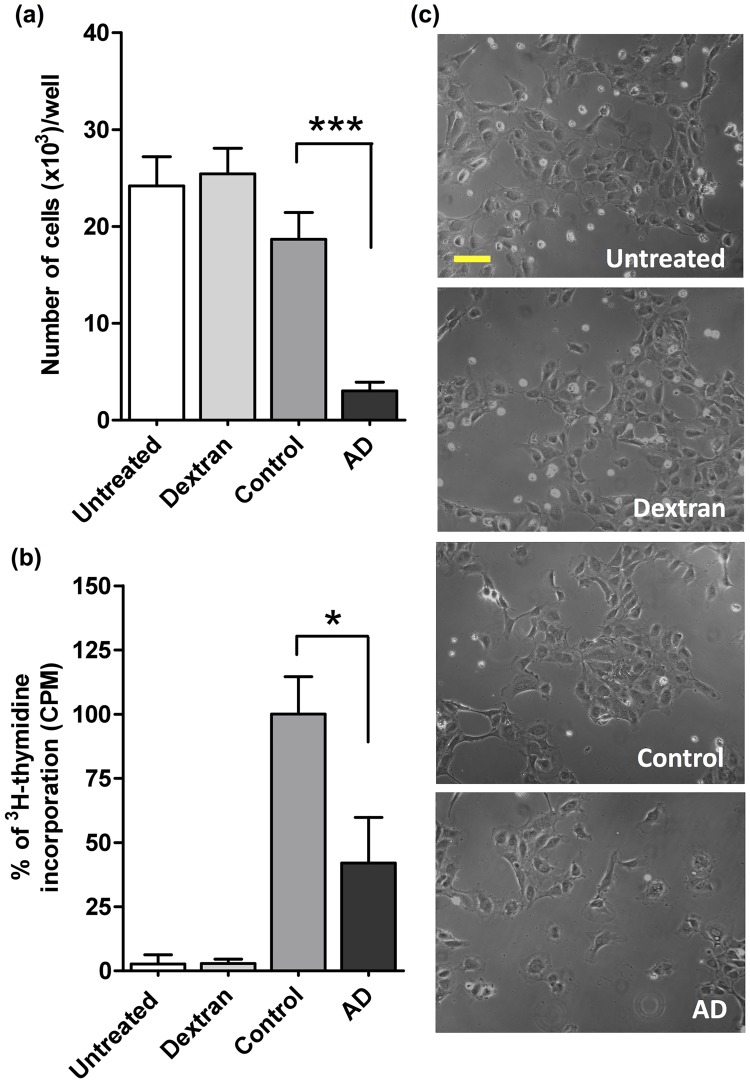
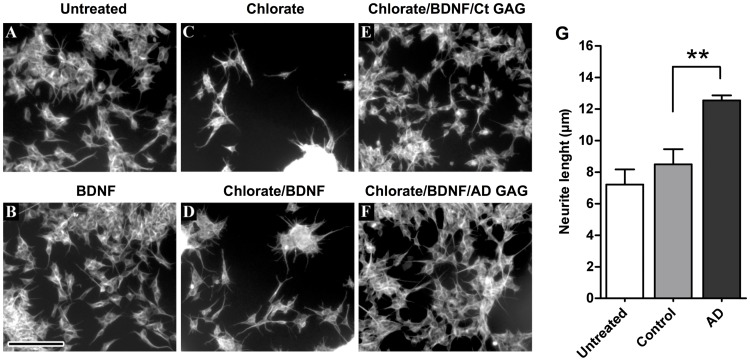
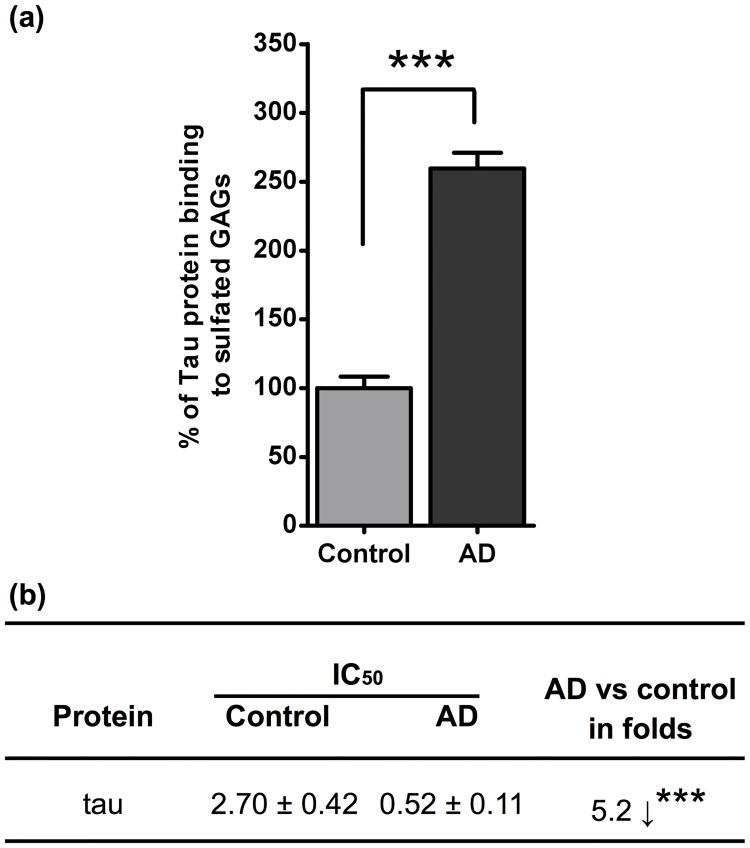
Glycosaminoglycans (GAGs), including heparan sulfates and chondroitin sulfates, are major components of the extracellular matrix. Upon interacting with heparin binding growth factors (HBGF), GAGs participate to the maintaintenance of tissue homeostasis and contribute to self-healing. Although several processes regulated by HBGF are altered in Alzheimer's disease, it is unknown whether the brain GAG capacities to bind and regulate the function of HBGF or of other heparin binding proteins, as tau, are modified in this disease. Here, we show that total sulfated GAGs from hippocampus of Alzheimer's disease have altered capacities to bind and potentiate the activities of growth factors including FGF-2, VEGF, and BDNF while their capacity to bind to tau is remarkable increased. Alterations of GAG structures and capacities to interact with and regulate the activity of heparin binding proteins might contribute to impaired tissue homeostasis in the Alzheimer's disease brain.


Conflict of interest statement

The authors have declared that no competing interests exist.

Figures

Fig 1
Fig 1. Sulfated GAGs levels are increased in AD hippocampus.
a) GAGs were extracted from AD and control hippocampus and quantified by the DMMB method. HS and CS levels were measured after Chase ABC or nitrous acid digestion. Values represent mean ± s.e.m. (n = 5); t-test was used for statistical analysis, ** p ≤ 0.01. b) Immunostaining of HS was performed with the 10E4 antibody. Cell nuclei were stained by DAPI. Scale bar 10 μm.
Fig 2
Fig 2. GAGs from AD hippocampus show lower capacities to bind FGF-2 and to potentiate its mitogenic activity.
a) GAG dependent FGF-2 mitogenic activity was assayed on BaF32 cells and detected by 3H-thymidine incorporation after stimulation with AD and control hippocampal GAGs. The reference effect (100%) was assigned to the FGF-2 (5 ng/mL) dependent mitogenic response obtained from cells treated with 1 μg/mL of control GAGs (determined by dose-response experiments). Cells non-supplemented with GAGs or supplemented with dextran were used as negative controls. b) AD vs control hippocampal GAGs relative binding to FGF-2 assessed by the ELISA competition assay in where extracted GAGs (50 ng/mL) competed with immobilized heparin to bind the growth factor (50 ng/mL). A reference GAG-protein binding (100%) was assigned to the competitive loss of signal obtained with the control GAGs. Basal signal was assigned to the 0% competition in the absence of competitor. The amount of protein in the heparin-immobilized plate was determined by using a calibration curve. Values represent mean ± s.e.m. (n = 5); one-way ANOVA was used to determine significance, * p ≤ 0.05 and ** p ≤ 0.01.
Fig 3
Fig 3. GAGs from AD hippocampus have lower capacities to bind VEGF and to potentiate its activity.
a) VEGF165 induced HUVEC proliferation after stimulation of GAG extracts from AD and control hippocampus. VEGF165 (3 ng/mL) was added to cells in combination with GAG extracts (3 ng/mL). Cell densities were evaluated by crystal violet [21] after 24 h. The VEGF165 and GAG concentrations were determined by dose-response experiments. Cells non-supplemented with GAGs or supplemented with dextran were used as negative controls. b) AD vs control GAG relative binding to VEGF were analyzed by an ELISA competition assay. GAG extracts competed with immobilized heparin to bind VEGF165 (180 ng/mL). The signal was recorded when control hippocampal GAGs (50 ng/mL, determined by dose-response experiments) was considered as control reference (100%). c) Phase contrast images of HUVECs stimulated with extracted AD or control GAGs in the presence of VEGF165. Images were taken by an Axiovert 10 microscope (Zeiss). Scale bar: 50 μm. Values represent mean ± s.e.m. (n = 5); one-way ANOVA was used to determine significance, *** p ≤ 0.001.
Fig 4
Fig 4. GAGs from AD hippocampus capacities to potentiate BDNF neuritogenic activity.
SH-SY5Y cells were differentiated with sodium chlorate (75 nM) and stimulated with BDNF (200 ng/mL) or in combination with hippocampal GAGs (1 μg/mL). Sodium chlorate was used to inhibit endogenous GAGs sulfation. Sodium chlorate, BDNF, and GAG concentrations were fixed by dose-effect experiments. Fixed cells were permeabilized and stained by β-tubulin III. a) Control untreated SH-SY5Y cells. b) BDNF only treated cells. c) Sodium chlorate only treated cells. d) Sodium chlorate/BDNF co-treated cells. e) Sodium chlorate/BDNF/control GAGs co-treated cells. f) Sodium chlorate/BDNF/AD GAGs (1 μg/mL) co-treated cells. g) Neurogenic effect, expressed by neurite length, in BDNF/chlorate treated cells supplemented with AD or control GAGs. Image processing was done by measuring the neurite length (NeuronJ software). Scale bar: 50 μm. Zoom factor for the inset is 2X. Values represent mean ± s.e.m. (n = 5);, one-way ANOVA was used to determine significance,** p ≤ 0.01.
Fig 5
Fig 5. Sulfated GAGs from AD hippocampus show increased capacities to bind tau.
a) Sulfated GAGs binding to tau was determined by the ELISA competition assay. Tau (100 ng/mL) and GAGs (0.1 ng/mL) concentrations were determined with dose-response experiments. The signal given by control GAGs was considered as 100% effect. b) IC50 changes in tau binding capacities with GAGs. IC50 stands for the GAG concentration necessary to inhibit 50% of tau binding to immobilized heparin. Values represent mean ± s.e.m. (n = 3); t-test was used to determine significance, ** p ≤ 0.01.
Fig 6
Fig 6. HS sulfotransferases are increased in AD hippocampus.
a) The expression of the main HS sulfotransferases responsible of N-, 2-O-, 3-O- and 6-O-sulfation were examined by RTqPCR. Other genes were analyzed including C5-epimerase (GLCE), heparanase (HPSE) and carbohydrate sulfotransferase 8 (CHST8). Two reference genes (TUBA1A and TBP) were used as endogenous controls. Expression on control individuals was set to one to visualize over and down expressions. Significant change in transcript expression * p < 0.05 or ** p < 0.01. b) Sulfation positions of HS chains in a representative HS disaccharide. N-, 2-O-, 3-O-, and 6-O-sulfation of HS are respectively assured by NDSTs, HS2STs, HS3STs and HS6STs.

Similar articles

Cited by

References

    1. Alafuzoff I. Alzheimer’s disease-related lesions. Journal of Alzheimer’s disease: JAD. 2013;33 Suppl 1:S173–9. 10.3233/JAD-2012-129024 . - DOI - PubMed
    1. Bonneh-Barkay D, Wiley CA. Brain extracellular matrix in neurodegeneration. Brain Pathol. 2009;19(4):573–85. 10.1111/j.1750-3639.2008.00195.x . - DOI - PMC - PubMed
    1. Marastoni S, Ligresti G, Lorenzon E, Colombatti A, Mongiat M. Extracellular matrix: a matter of life and death. Connect Tissue Res. 2008;49(3):203–6. Epub 2008/07/29. 10.1080/03008200802143190 . - DOI - PubMed
    1. Bottaro DP. The role of extracellular matrix heparan sulfate glycosaminoglycan in the activation of growth factor signaling pathways. Ann N Y Acad Sci. 2002; 961:158 . - PubMed
    1. Shute J. Glycosaminoglycan and chemokine/growth factor interactions. Handbook of experimental pharmacology. 2012;(207):307–24. 10.1007/978-3-642-23056-1_13 . - DOI - PubMed

Publication types

MeSH terms