. 2019 Jan 4;14(1):e0210184.
doi: 10.1371/journal.pone.0210184. eCollection 2019.

High-fat diet accelerates extreme obesity with hyperphagia in female heterozygous Mecp2-null mice

Affiliations

High-fat diet accelerates extreme obesity with hyperphagia in female heterozygous Mecp2-null mice

Shota Fukuhara et al. PLoS One. .

Abstract

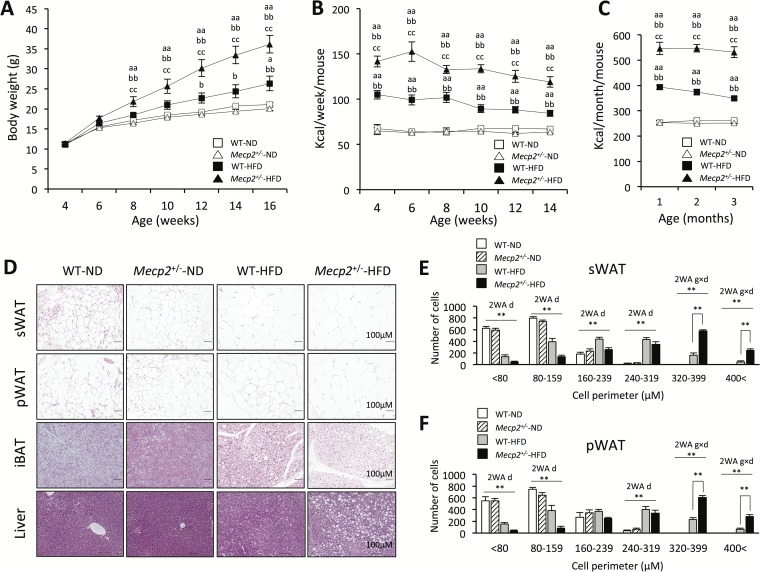
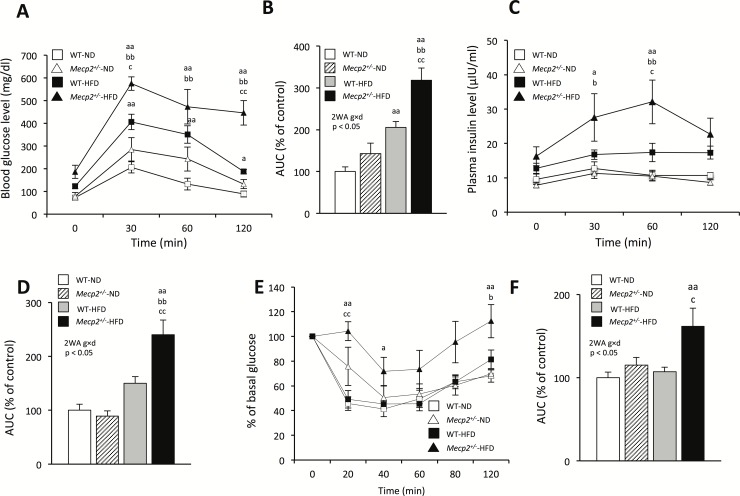
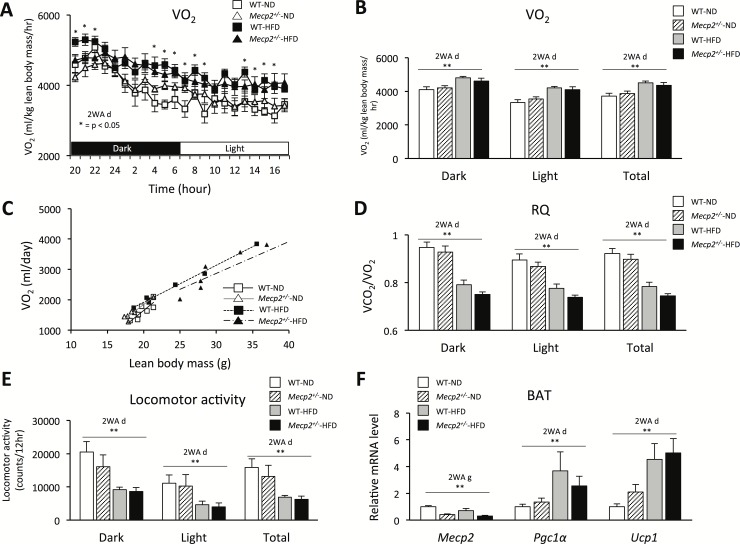
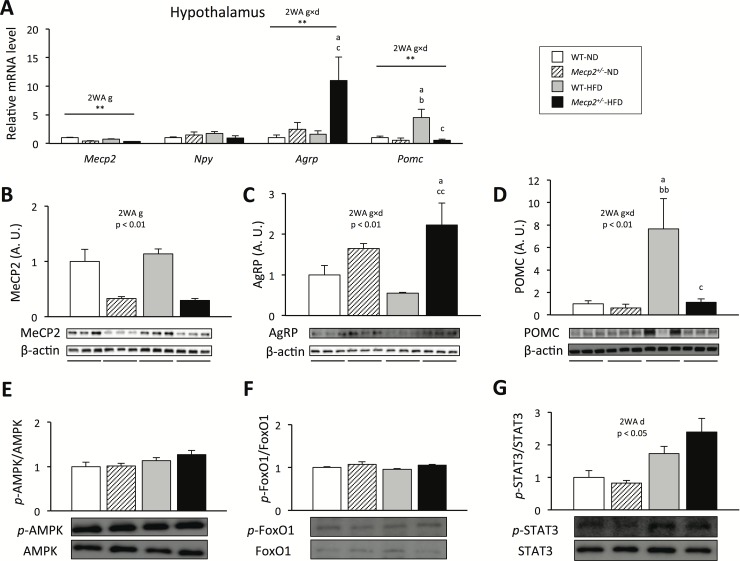
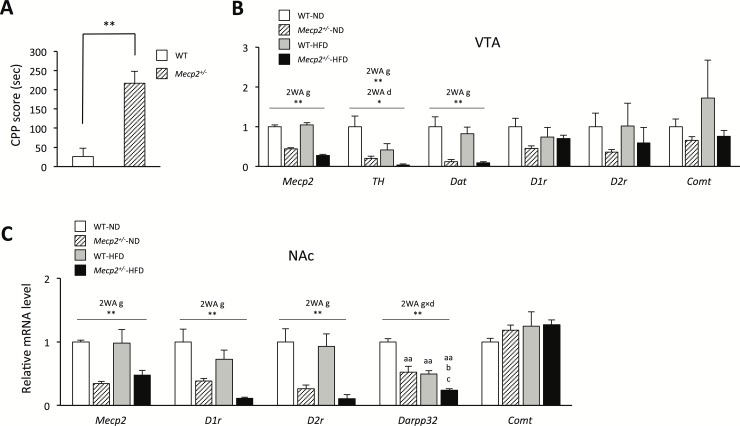
Rett syndrome (RTT) is an X-linked neurodevelopmental disorder caused by mutation of the methyl-CpG-binding protein 2 (MECP2) gene. Although RTT has been associated with obesity, the underlying mechanism has not yet been elucidated. In this study, female heterozygous Mecp2-null mice (Mecp2+/- mice), a model of RTT, were fed a normal chow diet or high-fat diet (HFD), and the changes in molecular signaling pathways were investigated. Specifically, we examined the expression of genes related to the hypothalamus and dopamine reward circuitry, which represent a central network of feeding behavior control. In particular, dopamine reward circuitry has been shown to regulate hedonic feeding behavior, and its disruption is associated with HFD-related changes in palatability. The Mecp2+/- mice that were fed the normal chow showed normal body weight and food consumption, whereas those fed the HFD showed extreme obesity with hyperphagia, an increase of body fat mass, glucose intolerance, and insulin resistance compared with wild-type mice fed the HFD (WT-HFD mice). The main cause of obesity in Mecp2+/--HFD mice was a remarkable increase in calorie intake, with no difference in oxygen consumption or locomotor activity. Agouti-related peptide mRNA and protein levels were increased, whereas proopiomelanocortin mRNA and protein levels were reduced in Mecp2+/--HFD mice with hyperleptinemia, which play an essential role in appetite and satiety in the hypothalamus. The conditioned place preference test revealed that Mecp2+/- mice preferred the HFD. Tyrosine hydroxylase and dopamine transporter mRNA levels in the ventral tegmental area, and dopamine receptor and dopamine- and cAMP-regulated phosphoprotein mRNA levels in the nucleus accumbens were significantly lower in Mecp2+/--HFD mice than those of WT-HFD mice. Thus, HFD feeding induced dysregulation of food intake in the hypothalamus and dopamine reward circuitry, and accelerated the development of extreme obesity associated with addiction-like eating behavior in Mecp2+/- mice.


Conflict of interest statement

The authors have declared that no competing interests exist.

Figures

Fig 1
Fig 1. Body weight gain, food intake, and adiposity in Mecp2+/- mice fed a high-fat diet.
(A) Body weight change. (B) Weekly food intake. (C) Monthly food intake. Values are the mean ± SEM for 9–11 mice. (D) Histology of the subcutaneous white adipose tissue (sWAT), perigonadal white adipose tissue (pWAT), brown adipose tissue, and liver. (E) Distribution of adipocyte perimeters in the sWAT. (F) Distribution of adipocyte perimeters in the pWAT. (A–F) Mice were tested at 16 weeks of age; values are the mean ± SEM for 7–8 mice. * = p < 0.05, ** = p < 0.01, ap < 0.05, aap < 0.01 vs. WT mice fed a normal chow diet (WT-ND). bp < 0.05, bbp < 0.01 vs. Mecp2+/- mice fed a normal chow diet (Mecp2+/--ND). cp < 0.05, ccp < 0.01 vs. WT mice fed a high-fat diet (WT-HFD). 2WA = Two-way ANOVA, g = genotype, d = diet, Two-way ANOVA followed by post-hoc Tukey-Kramer Multiple-Comparison test.
Fig 2
Fig 2. Glucose intolerance and insulin resistance in Mecp2+/- mice.
(A) Intra-peritoneal glucose tolerance tests (IPGTTs) to determine blood glucose levels. (B) Quantification of the area under the curve (AUC) in (A). (C) IPGTTs for determining plasma insulin levels. (D) Quantification of the AUC in (C). (E) Insulin tolerance tests (ITTs). (F) Quantification of the AUC in (E). Mice were tested at 16 weeks of age; values are the mean ± SEM for 6–7 mice. ap < 0.05, aap < 0.01 vs. WT mice fed a normal chow diet (WT-ND). bp < 0.05, bbp < 0.01 vs. Mecp2+/- mice fed a normal chow diet (Mecp2+/--ND). cp < 0.05, ccp < 0.01 vs. WT mice fed a high-fat diet (WT-HFD). 2WA = Two-way ANOVA, g = genotype, d = diet, Two-way ANOVA followed by post-hoc Tukey-Kramer Multiple-Comparison test.
Fig 3
Fig 3. Oxygen consumption, locomotor activity, and brown adipose tissue-related gene expression in Mecp2+/- mice.
(A) Twenty-two-hour oxygen consumption adjusted by lean body mass. (B) Oxygen consumption in dark and light phase. (C) Oxygen consumption analyzed by ANCOVA. (D) Respiratory quotient (VCO2/VO2). (E) Locomotor activity. (F) Mecp2, Ucp1 and Pgc1α mRNA expression in the BAT using qPCR. (A–F) Mice were tested at 16 weeks of age; values are the mean ± SEM for 7–8 mice. * = p < 0.05, ap < 0.05, ** = p < 0.01, 2WA = Two-way ANOVA, g = genotype, d = diet, Two-way ANOVA followed by post-hoc Tukey-Kramer Multiple-Comparison test.
Fig 4
Fig 4. Hypothalamic dysregulation of food intake in Mecp2+/- mice.
(A) mRNA expression levels of food intake regulation-related genes in the hypothalamus, determined using qPCR. (B) MeCP2, (C) AgRP, and (D) POMC protein expression in the hypothalamus, determined using western blot analysis. Phosphorylation of (E) AMPK, (F) FoxO1, and (G) STAT3 in the hypothalamus, using western blot analysis. (A–F) Mice were tested at 16 weeks of age; values are the mean ± SE for 5 mice. ** = p < 0.01, ap < 0.05, vs. WT mice fed a normal chow diet (WT-ND). bp < 0.05, bbp < 0.01 vs. Mecp2+/- mice fed a normal chow diet (Mecp2+/--ND). cp < 0.05, ccp < 0.01 vs. WT mice fed a high-fat diet (WT-HFD). 2WA = Two-way ANOVA, g = genotype, d = diet, Two-way ANOVA followed by post-hoc Tukey-Kramer Multiple-Comparison test.
Fig 5
Fig 5. Dysregulation of the mesolimbic dopamine circuitry in Mecp2+/- mice.
(A) Conditioned place preference (CPP) test; mice were tested at 10–12 weeks of age. Values are the mean ± SEM for 8 mice. **p < 0.01 vs. WT mice. (B) Mecp2 and dopamine-related gene expression in the VTA, determined using qPCR. (C) Dopamine-related gene expression in the NAc, determined using qPCR. (B–C) Mice were tested at 16 weeks of age; values are the mean ± SEM for five mice. * = p < 0.05, ap < 0.05, ** = p < 0.01, aap < 0.01 vs. WT mice fed a normal chow diet (WT-ND). bp < 0.05, vs. Mecp2+/- mice fed a normal chow diet (Mecp2+/--ND). cp < 0.05, vs. WT mice fed a high-fat diet (WT-HFD). 2WA = Two-way ANOVA, g = genotype, d = diet, Two-way ANOVA followed by post-hoc Tukey-Kramer Multiple-Comparison test.

Similar articles

Cited by

References

    1. Smeets EEJ, Pelc K, Dan B. Rett syndrome. Mol Syndromol. 2012;2: 113–127. 10.1159/000337637 - DOI - PMC - PubMed
    1. Nan X, Meehan RR, Bird A. Dissection of the metyl-CpG binding domain from the chromosomal protein MeCP2. Nucleic Acids Res. 1993; 21: 4886–4892. - PMC - PubMed
    1. Nan X, Ng HH, Johnson CA, Laherty CD, Turner BM, Eisenman RN, et al. Transcriptional repression by the methyl-CpG-binding protein MeCP2 involves a histone deacetylase complex. Nature 1998; 393: 386–389. 10.1038/30764 - DOI - PubMed
    1. Chahrour M, Jung SY, Shaw C, Zhou X, Wong STC, Qin J, et al. MeCP2, a key contributor to neurological disease, activates and represses transcription. Science 2008; 320: 1224–1229. 10.1126/science.1153252 - DOI - PMC - PubMed
    1. Kleefstra T, Yntema HG, Oudakker AR, Romein T, Sistermans E, Nillessen W, et al. De novo MeCP2 frameshift mutation in a boy with moderate mental retardation, obesity and gynaecomstia. Clin Genet. 2002; 61: 359–362. - PubMed

Publication types

MeSH terms