. 2019 Jan 4;15(1):e1007456.
doi: 10.1371/journal.ppat.1007456. eCollection 2019 Jan.

Thymic expression of IL-4 and IL-15 after systemic inflammatory or infectious Th1 disease processes induce the acquisition of "innate" characteristics during CD8+ T cell development

Affiliations

Thymic expression of IL-4 and IL-15 after systemic inflammatory or infectious Th1 disease processes induce the acquisition of "innate" characteristics during CD8+ T cell development

Natalia S Baez et al. PLoS Pathog. .

Abstract

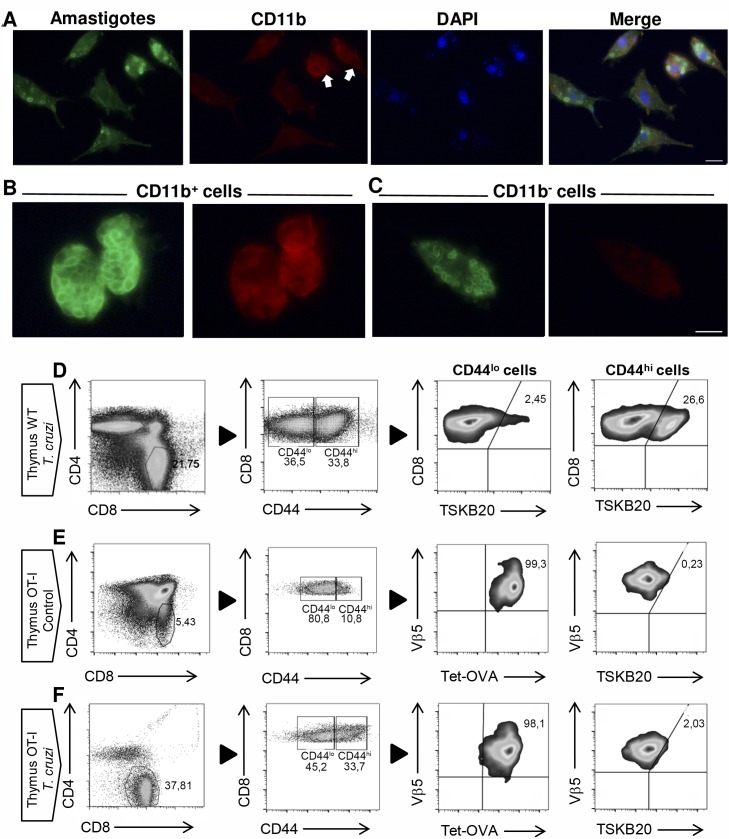
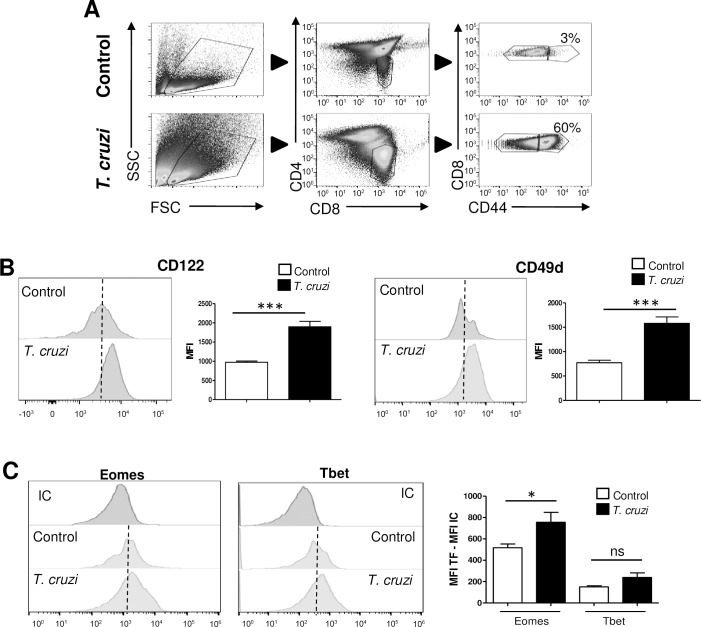
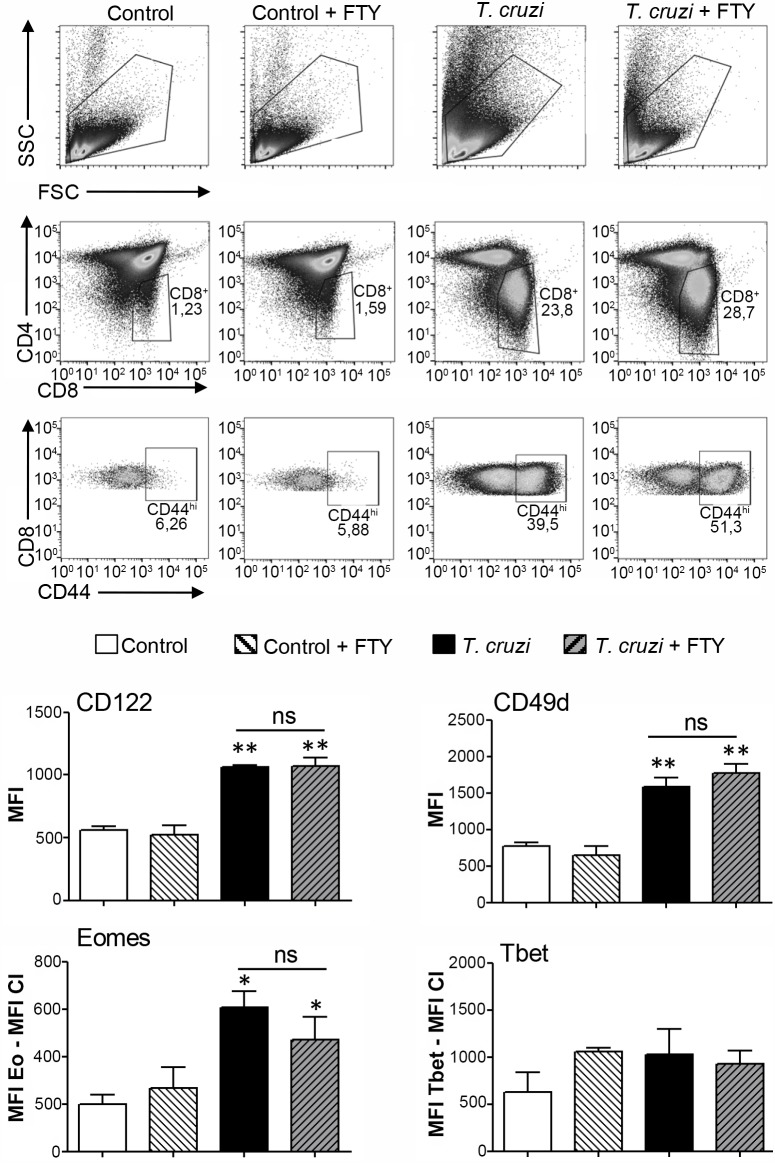
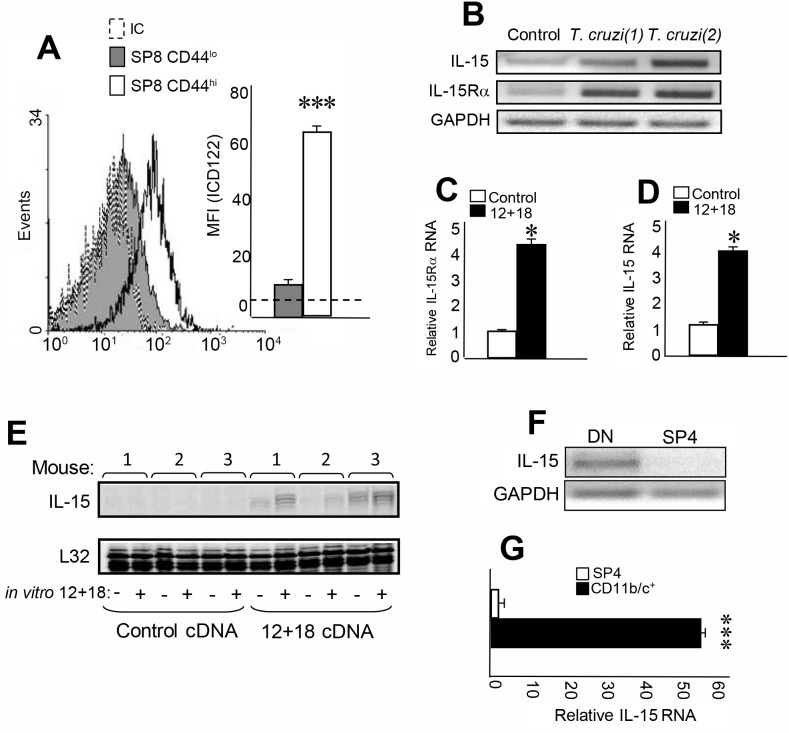
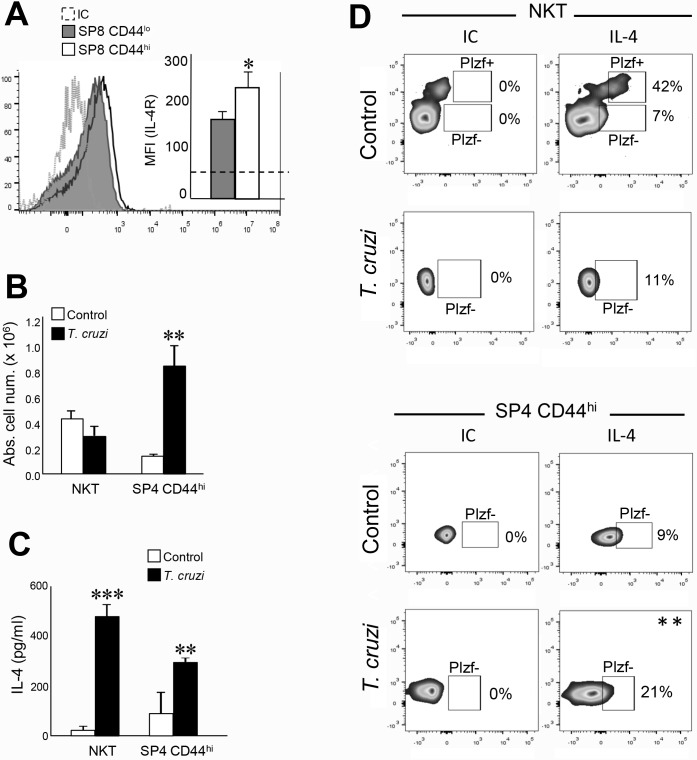
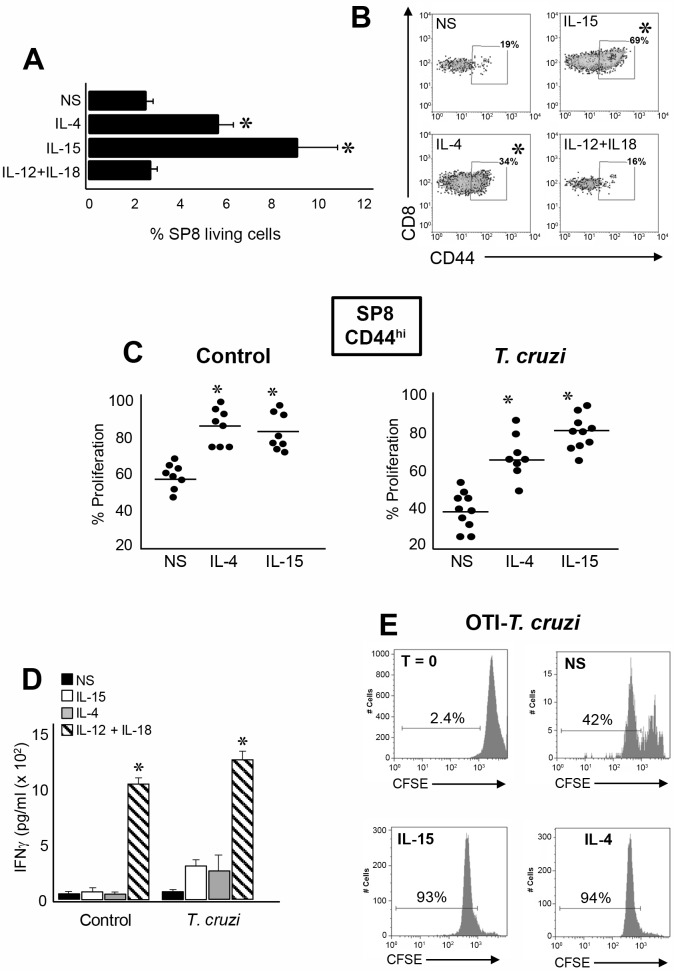
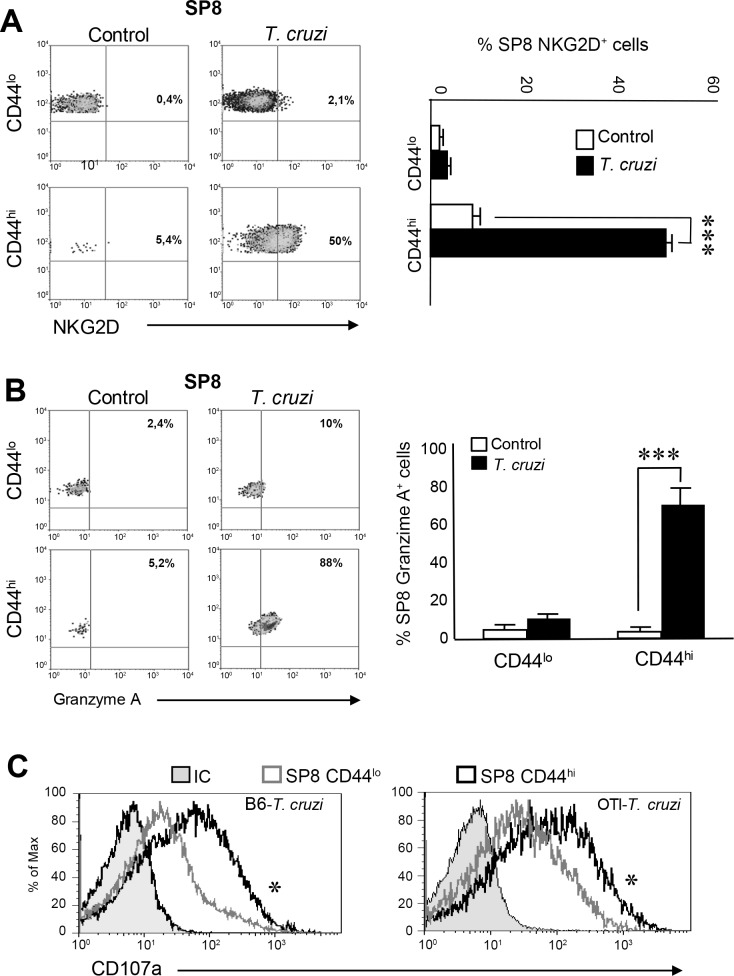
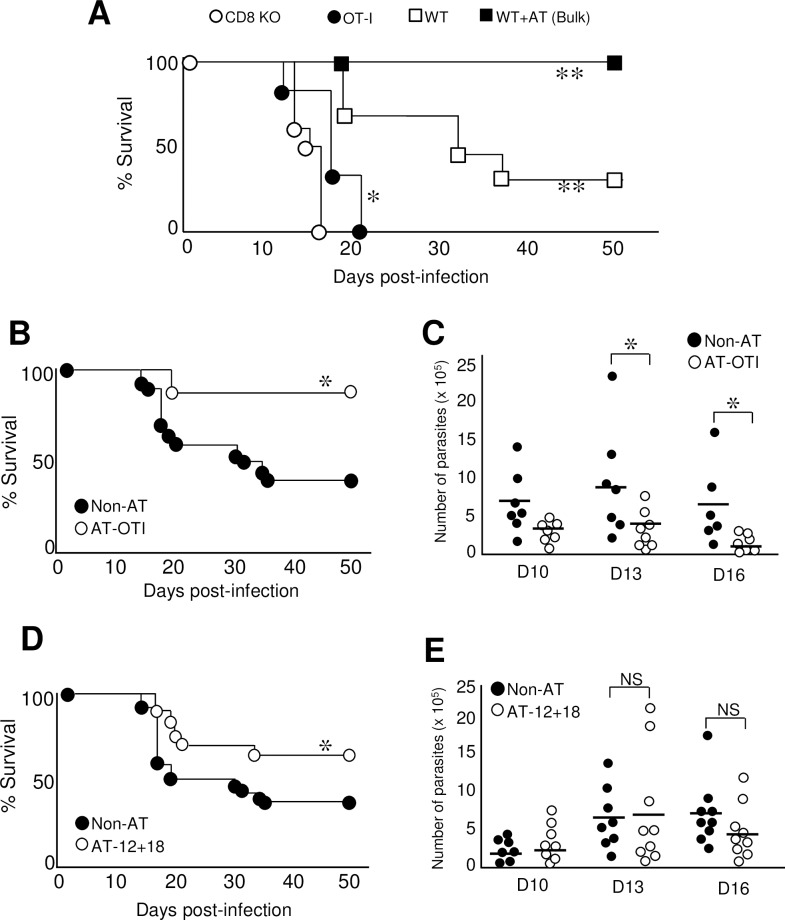
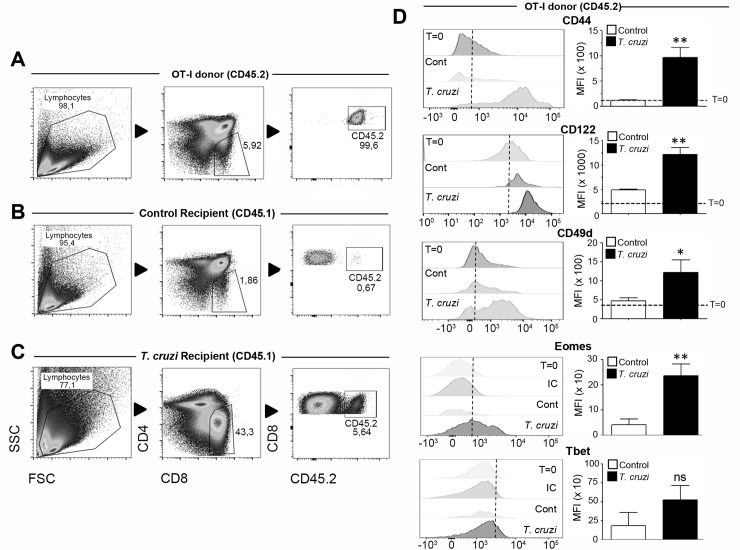
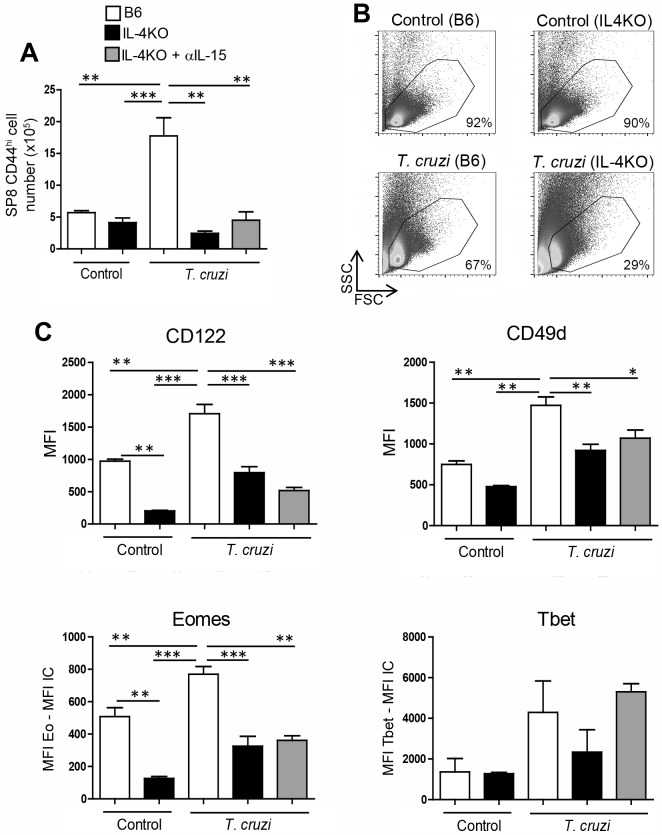
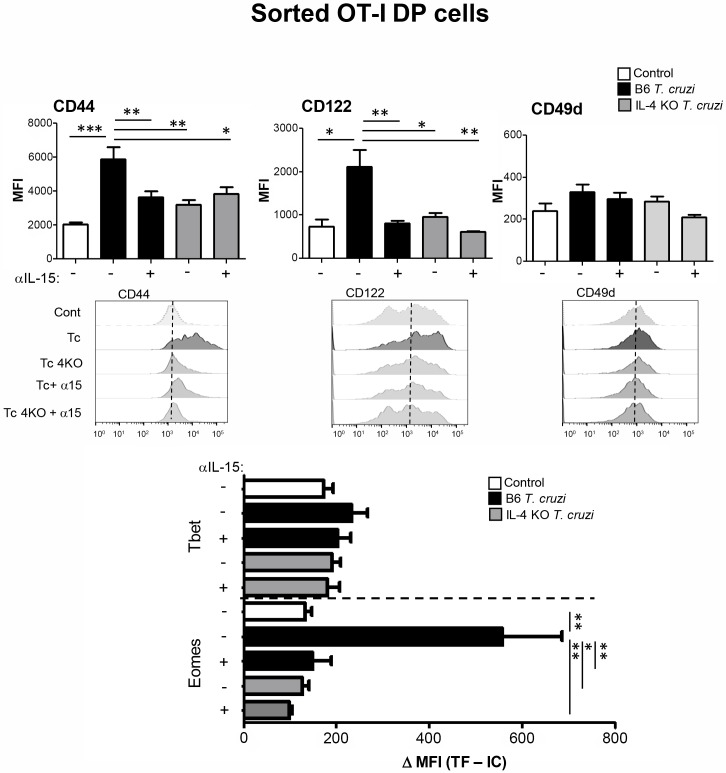
Innate CD8+ T cells express a memory-like phenotype and demonstrate a strong cytotoxic capacity that is critical during the early phase of the host response to certain bacterial and viral infections. These cells arise in the thymus and depend on IL-4 and IL-15 for their development. Even though innate CD8+ T cells exist in the thymus of WT mice in low numbers, they are highly enriched in KO mice that lack certain kinases, leading to an increase in IL-4 production by thymic NKT cells. Our work describes that in C57BL/6 WT mice undergoing a Th1 biased infectious disease, the thymus experiences an enrichment of single positive CD8 (SP8) thymocytes that share all the established phenotypical and functional characteristics of innate CD8+ T cells. Moreover, through in vivo experiments, we demonstrate a significant increase in survival and a lower parasitemia in mice adoptively transferred with SP8 thymocytes from OT I-T. cruzi-infected mice, demonstrating that innate CD8+ thymocytes are able to protect against a lethal T. cruzi infection in an Ag-independent manner. Interestingly, we obtained similar results when using thymocytes from systemic IL-12 + IL-18-treated mice. This data indicates that cytokines triggered during the acute stage of a Th1 infectious process induce thymic production of IL-4 along with IL-15 expression resulting in an adequate niche for development of innate CD8+ T cells as early as the double positive (DP) stage. Our data demonstrate that the thymus can sense systemic inflammatory situations and alter its conventional CD8 developmental pathway when a rapid innate immune response is required to control different types of pathogens.


Conflict of interest statement

The authors have declared that no competing interests exist.

Figures

Fig 1
Fig 1. Ag-specific CD8+ T cells correlates with the presence of amastigotes in the thymus of T. cruzi-infected mice.
WT mice were infected with T. cruzi (Tulahuen) and thymic cell suspensions were obtained 14 days post-infection. (A-C) Adherent cells were stained with an antiserum from a chagasic patient and subsequently with an anti-human IgG conjugated with Alexafluor 488. Shown in green are the T. cruzi parasites, in red (Alexafluor 546) CD11b positive cells and in blue are the nuclei labeled with DAPI. Scale 10 μm. (D) Thymi from T. cruzi-infected (Tulahuen) WT mice or (E-F) thymi from control or T. cruzi-infected (Tulahuen) OT-I mice were obtained and surface stained with anti-CD4, anti-CD8, anti-CD44, anti-Vβ5 and an OVA-tetramer or TSKB20-tetramer as described in Material and Methods. Representative dot plots from 2 independent experiments with 5 mice per group are shown.
Fig 2
Fig 2. SP8 CD44hi thymocytes from T. cruzi-infected mice adopt an innate phenotype.
(A) Representative dot plots of the gate strategy for SP8 CD44hi thymocytes analysis are shown. The expression of (B) CD122 and CD49d along with (C) Eomes and Tbet was evaluated by flow cytometry in SP8 CD44hi cells from control and T. cruzi-infected (Tulahuen) WT mice. In (C) transcription factor (TF) expression was expressed as the difference of the mean fluorescence intensity (MFI) of Eomes or Tbet vs the MFI of the corresponding isotype control (IC) in the SP8 CD44hi cells. Student’s unpaired t test was used for statistical analysis. Data is representative of 3 repetitions of the same experiment with 3–5 animals per group. Bar graph data are shown as the mean ± SEM. Control versus T. cruzi-infected mice, *p<0.05, ***p<0.001, NS: non-significant.
Fig 3
Fig 3. Innate CD8+ cells in the thymus of T. cruzi-infected mice are not derived from SLO.
Control or T. cruzi-infected (Tulahuen) WT mice were treated with FTY720. Individual mice from both groups received 3 25μg injections of FTY720 in 200ul of saline solution on days 8, 10 and 13 post-infection. Control mice received saline only injections on the indicated days. Thymocytes from control or T. cruzi-infected mice, with and without FTY720 treatment, were obtained 14 days post-infection. The expression of CD122 and CD49d was evaluated by flow cytometry in SP8 CD44hi cells. Eomes and Tbet expression was measured by intranuclear staining using Flow cytometry analysis in the SP8 CD44hi cells and expressed as described in Fig 2. One-way ANOVA was used for statistical analysis. Data are shown as the mean ± SEM. Control versus T. cruzi-infected mice, *p<0.05, **p<0.01. FTY = FTY720.
Fig 4
Fig 4. IL-15 is produced in the thymus and its receptors are expressed by SP8 CD44hi thymocytes.
Thymocytes from T. cruzi-infected (Tulahuen) WT mice were obtained 14 days after infection. The expression of (A) IL-2/IL-15 β chain (CD122) in SP8 CD44hi and CD44lo thymocytes was evaluated by Flow cytometry. Histograms are representative from 3 independent experiments with 3–5 mice each. Results are shown as mean ± SEM. The statistical test applied was Student’s unpaired t test. SP8 CD44hi versus SP8 CD44lo cells, ***p<0.001. (B) IL-15 and IL-15Rα chain RNA expression was evaluated by RT PCR in total thymus from control or T. cruzi-infected mice. Figure shows one representative control mouse and 2 T. cruzi-infected mice (1) and (2). (C) IL-15Rα chain and (D) IL-15 RNA expression was evaluated by real time PCR in total thymus from control cDNA or IL-12+IL-18 cDNA-treated mice. Results are shown as mean ± SEM. The statistical test applied was Student’s unpaired t test. Control versus IL-12+IL-18 treatment, *p<0.05. (E) IL-15 expression was evaluated by RPA in total thymus from control cDNA or IL-12+IL-18 cDNA-treated mice after in vitro stimulation (or not) with rIL-12 (10μg/ml) + rIL-18 (50 μg/ml). (F) IL-15 RNA expression was evaluated by RT PCR in the sorted DN or SP4 thymocytes or by (G) Real-time PCR in the sorted CD11b+/CD11c+ or SP4 cell subset obtained from thymi of T. cruzi-infected mice. Results are shown as mean ± SEM. The statistical test applied was a Student’s unpaired t test, ***p<0.001.
Fig 5
Fig 5. IL-4 is produced in the thymus by several cell subsets and its receptors are expressed by SP8 CD44hi thymocytes.
Thymocytes from T. cruzi-infected (Tulahuen) WT mice were obtained 14 days after infection. The expression of (A) IL-4R in SP8 CD44hi and CD44lo thymocytes was evaluated by Flow cytometry. Histograms are representative from 3 independent experiments with 3–5 mice each. Results are shown as mean ± SEM. The statistical test applied was Student’s unpaired t test. SP8 CD44hi versus SP8 CD44lo cells, *p<0.05. (B) The absolute cell numbers of thymic NKT and SP4 CD44hi were calculated in control and T. cruzi-infected mice. Control versus T. cruzi-infected mice **p<0.01. (C) NKT and SP4 CD44hi thymocytes were isolated by cell sorting from thymi of control or T. cruzi-infected mice (see gate strategy in S3 Fig used to sort cells). Cells were cultured for 5h in complete medium in the presence of PMA (50ng/ml) and Ionomycin (1μg/ml). Production of IL-4 was evaluated in the supernatants by ELISA. IL-4 concentration ± SEM shown is the result of 2 independent experiments. The statistical test applied was a one-way ANOVA. Control versus T. cruzi-infected mice, **p<0.01, ***p<0.001. (D) The intracellular expression of IL-4 was evaluated in thymic NKT and SP4 CD44hi thymocytes (see gate strategy in S3 Fig) by Flow cytometry. Dot plots are representative from 3 independent experiments with 2–3 mice each. Results are shown as percentage of IL-4+ cells. The statistical test applied was Student’s unpaired t test. **p<0.01.
Fig 6
Fig 6. Preferential expansion/selection of innate CD8+ thymocytes in the thymus of T. cruzi-infected mice.
Thymocytes from T. cruzi-infected (Tulahuen) WT mice were cultured with 150 ng/ml of rIL-15, 20 ng/ml of rIL-4 or 10 ng/ml of rIL-12 plus 50 ng/ml of rIL-18. After 72h of culture cells were harvested and Flow cytometry analysis was performed. The percentage of (A) SP8 cells in the living gate of total thymocytes or (B) SP8 CD44hi thymocytes were calculated. In (A) data was expressed as mean ± SEM of 2 independent experiments with 4–5 mice per group, Histograms are representative of one out of 2 independent experiments. NS versus IL-4 or IL-15, *p<0.05. (C) Cells from thymi of control or T. cruzi-infected (Tulahuen) WT mice were stained with 4μM CFSE dye and percent proliferation in the SP8 CD44hi subset was calculated by the CSFE dilution compared to the expression at T = 0 (before the cultures) and analyzed by flow cytometry. (D) IFNγ production was analyzed by ELISA in the culture supernatant from each condition. Results are shown as mean ± SEM, 12+18 versus NS, IL-4 or IL-15, *p<0.05. (E) Thymocytes from T. cruzi-infected (Tulahuen) OT-I mice were stained with 4μM CFSE dye and then cultured with 150 ng/ml of rIL-15, or 20 ng/ml of rIL-4. After 72h, the percentage of proliferation was calculated based on the CSFE dilution analyzed by flow cytometry as explained above and compared with T = 0. Histograms are representative of one OT-I T. cruzi-infected mouse from two independent experiments with 4–5 mice/group. The statistical test applied was a One-way ANOVA.
Fig 7
Fig 7. SP8 CD44hi thymocytes from T. cruzi-infected mice adopt cytotoxic features.
(A) The percentage of SP8 NKG2D+ cells or (B) SP8 Granzyme A+ cells were analyzed by Flow cytometry in CD44hi and CD44lo thymocytes isolated from control or T. cruzi-infected (Tulahuen) WT mice. Dot plots are representative of one mouse per group from three independent experiments with 4–6 mice per group. The statistical test applied was a One-way ANOVA. Control versus T. cruzi-infected mice, ***p<0.001. (C) Thymi from WT T. cruzi-infected (Tulahuen) or OT-I T. cruzi-infected (Tulahuen) mice (at 14 dpi) were isolated and thymocytes were cultured in the presence of PMA/ionomycin, Brefeldin A and an anti-CD107a Ab for 5h in complete media. Flow cytometry analysis was performed to evaluate the expression of CD107a in the subpopulations SP8 CD44hi (black line) and SP8 CD44lo (gray line), *p<0.05. The statistical test applied was a One-way ANOVA. Histograms are representative of two independent experiments with 3–5 mice/group.
Fig 8
Fig 8. Innate CD8+ thymocytes induce protection during T. cruzi infection in an Ag-independent manner.
(A) CD8αKO, OT-I and WT mice were infected with 5000 T. cruzi parasites (Tulahuen) (recipient mice). In the WT-AT group, a bulk suspension of 10 x 106 thymocytes from T. cruzi- infected mice was adoptively transferred (AT) to WT B6 mice 24h prior to infection with 5000 T. cruzi parasites. Survival was compared between groups and monitored at different time points after infection. WT+AT, WT or OT-I vs CD8KO, *p<0.05, **p<0.01 (B) WT mice were not AT (Non-AT) or AT with sorted 5–6 x 10⁶ SP8 thymocytes from OT-I T. cruzi-infected (Tulahuen) mice (AT-OTI) 24h prior to the infection with 5000 T. cruzi parasites and monitored for survival daily post infection (C) Parasitemia (number of parasites per ml of blood) of non-AT or AT-OTI was evaluated on days 10, 13 and 16 post infection. (D) Non-AT mice or mice AT with a bulk suspension of 10 x106 thymocytes from IL-12+IL-18 cDNA-treated mice (AT-12+18) were monitored for survival in the days post infection with 5000 T. cruzi parasites. (E) Parasitemia of non-AT or AT-12+18 was evaluated on days 10, 13 and 16 post infection. Data represent two replicates of the same experiment with 6–8 animals per group. The number of parasites was compared with a One-way ANOVA test and survival data were analyzed with the Wilcoxon-Gehan-Brelow test. Non-AT versus OTI-AT or AT-12+18, *p<0.05. NS: not significant. WT = conventional C57BL/6 mice.
Fig 9
Fig 9. Innate CD8+ cells appearance in the thymus is a SP8 lineage decision.
CD45.1+ Control or T. cruzi-infected (Tulahuen) WT mice at day 12 post-infection (recipient mice) were anaesthetized and i.t. injected with 10 x 106 CD45.2+ thymocytes from the same control OT-I mouse (donor). After 48h, mice were sacrificed and the thymi were harvested. Dot plot shows the gate strategy for analysis of: (A) CD45.2+ SP8 OT-I thymocytes before being injected and after 48 h of being injected in (B) control or (C) T. cruzi-infected mice. Two days post i.t. injections (D) CD44, CD122, CD49d, Eomes and Tbet expression were analyzed by Flow cytometry in the CD45.2+ SP8 gated OT-I thymocytes. Changes in Eomes and Tbet levels were expressed as the difference between the MFI of Eomes or Tbet and the MFI from the corresponding Isotype control (IC). Histograms are representative of 2 independent experiments with 4–6 mice/group. The statistical test applied was a Student’s unpaired t test, Control vs T-cruzi *p<0.05 and **p<0.01.
Fig 10
Fig 10. IL-4 expression is important to generate innate CD8+ thymocytes after T. cruzi infection.
WT and IL-4KO mice were infected with T. cruzi (Tulahuen) and sacrificed 14 days post-infection (dpi). IL-4KO T. cruzi-infected mice were separated in 2 different groups, one with no treatment and the other was treated with 2 i.p. injections of anti-IL15 antibody (25 μg of IL-15 per injection) at 10 and 12 dpi. Thymocytes were obtained on day 14 dpi and (A) the total number of SP8 CD44hi cells was calculated. (B) Representative density plots of one mouse per group that shows the percentage of total viable cells. (C) The expression of CD122 and CD49d was evaluated by flow cytometry in SP8 CD44hi cells. Eomes or Tbet were measured by intranuclear staining using Flow cytometry analysis expression and were expressed as the difference of the mean fluorescence intensity (MFI) of Eomes or Tbet vs the MFI of the correspondent isotype control (IC) in the SP8 CD44hi subset. Data are shown as the mean ± SEM. The statistical test applied was a One-way ANOVA. T. cruzi vs the rest of the groups, *p<0.05,**p<0.01 and ***p<0.001.
Fig 11
Fig 11. Blockage of IL-4 and IL-15 inhibits the induction of the innate phenotype in DP thymocytes.
A bulk population of CD45.2+ thymocytes either from WT control, WT T. cruzi-infected (Tulahuen) or IL-4KO T. cruzi-infected (Tulahuen) mice were obtained at day 14 post-infection and cultured for 2h at 37°C in the presence of PMA/ionomycin. Cells were washed twice and co-cultured with sorted DP cells from OT-I (Vβ5+ OVA-tetramer+) control mice at a 1:1 ratio in the presence or absence of a neutralizing anti-IL-15 Ab. After 48h, thymocytes were obtained and CD44, CD122, CD49d, Eomes and Tbet expression were analyzed by Flow cytometry only in DP CD8 OVA-specific OT-I thymocytes. Eomes or Tbet were measured by intranuclear staining using Flow cytometry analysis and were expressed as the difference of the mean fluorescence intensity (MFI) of Eomes or Tbet vs the MFI of the correspondent isotype control (IC). Histograms are representative of two independent experiments with 3–6 mice/experiment. The statistical test applied was a One-way ANOVA. T. cruzi vs the rest of the groups, *p<0.05, **p<0.01 and ***p<0.001. Tc = T. cruzi; Tc+α15 = T. cruzi + anti-IL-15 neutralizing Ab; Tc4KO = IL-4 KO T. cruzi; Tc4KO+α15 = IL-4 KO T. cruzi + anti-IL-15 neutralizing Ab.

References

    1. Boehm T. Thymus development and function. Current opinion in immunology. 2008;20(2):178–84. 10.1016/j.coi.2008.03.001 . - DOI - PubMed
    1. Ciofani M, Zuniga-Pflucker JC. The thymus as an inductive site for T lymphopoiesis. Annual review of cell and developmental biology. 2007;23:463–93. 10.1146/annurev.cellbio.23.090506.123547 . - DOI - PubMed
    1. Ohigashi Izumi, Kozai Mina, Development Takahama Y. and developmental potential of cortical thymic epithelial cells. Immunological Reviews. 2016;271:10–22. 10.1111/imr.12404 - DOI - PubMed
    1. Bosco N, Kirberg J, Ceredig R, Agenes F. Peripheral T cells in the thymus: have they just lost their way or do they do something? Immunology and cell biology. 2009;87(1):50–7. 10.1038/icb.2008.83 . - DOI - PubMed
    1. Hale JS, Fink PJ. Back to the thymus: peripheral T cells come home. Immunology and cell biology. 2009;87(1):58–64. 10.1038/icb.2008.87 ; PubMed Central PMCID: PMC2679673. - DOI - PMC - PubMed

Publication types

MeSH terms