. 2019 Jan 3;104(1):94-111.
doi: 10.1016/j.ajhg.2018.11.017.

Mutations in NCAPG2 Cause a Severe Neurodevelopmental Syndrome that Expands the Phenotypic Spectrum of Condensinopathies

Collaborators, Affiliations

Mutations in NCAPG2 Cause a Severe Neurodevelopmental Syndrome that Expands the Phenotypic Spectrum of Condensinopathies

Tahir N Khan et al. Am J Hum Genet. .

Abstract

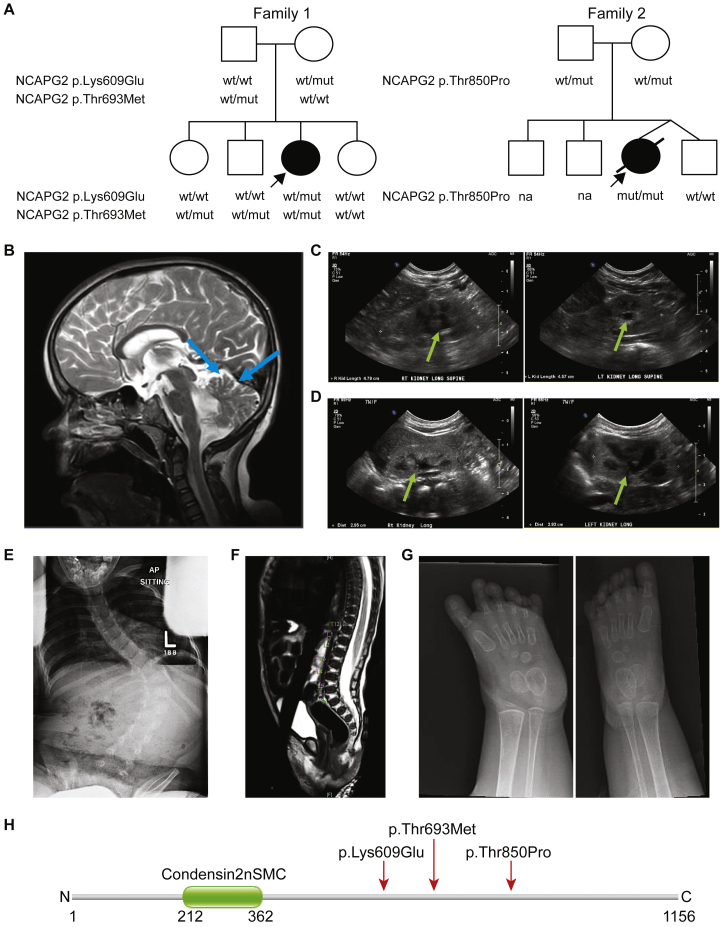
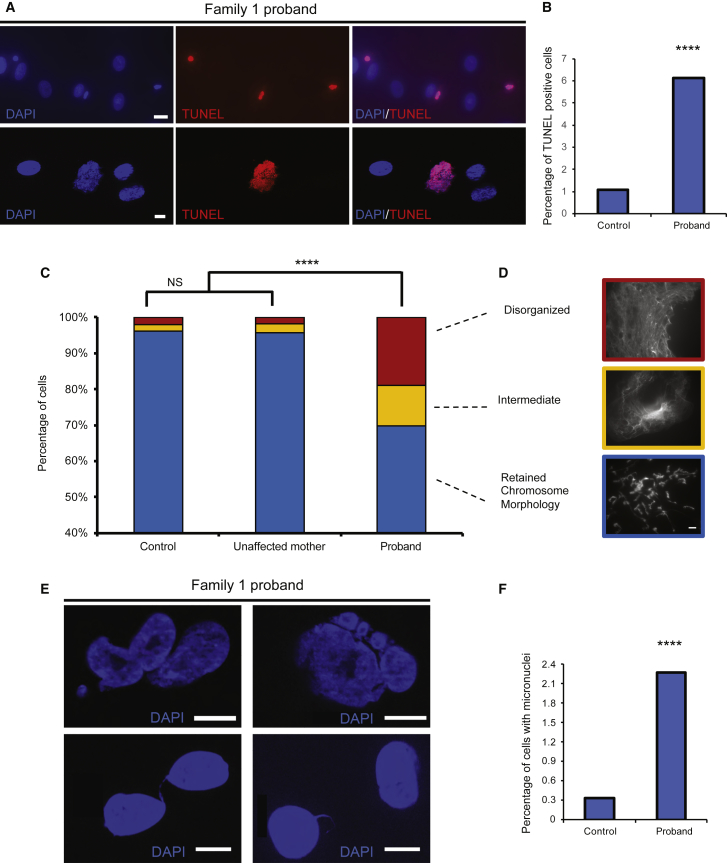
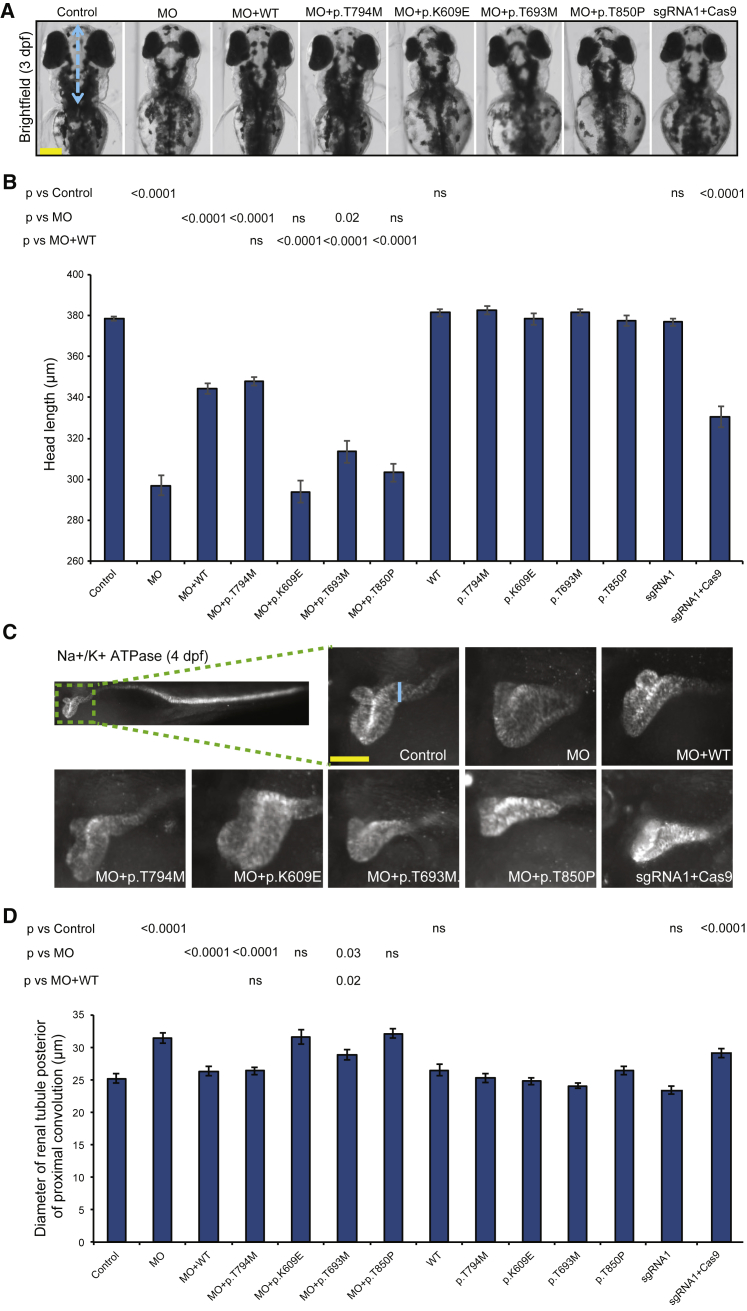
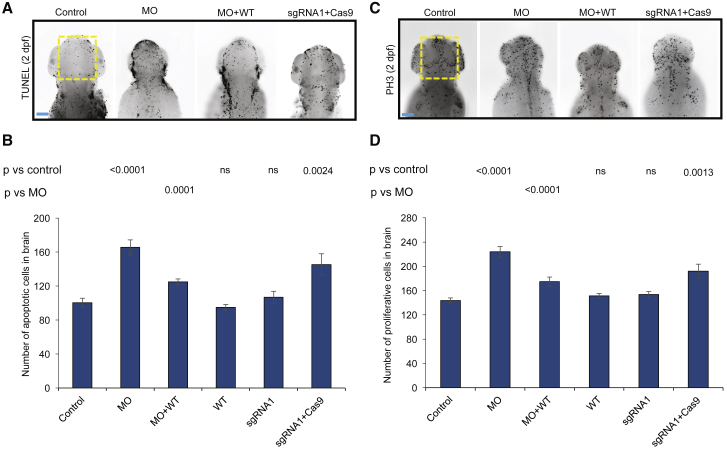
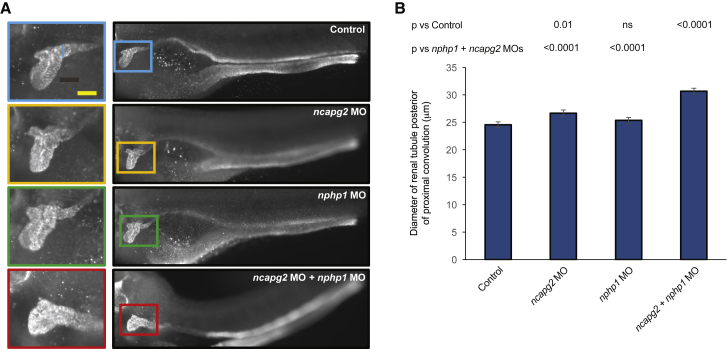
The use of whole-exome and whole-genome sequencing has been a catalyst for a genotype-first approach to diagnostics. Under this paradigm, we have implemented systematic sequencing of neonates and young children with a suspected genetic disorder. Here, we report on two families with recessive mutations in NCAPG2 and overlapping clinical phenotypes that include severe neurodevelopmental defects, failure to thrive, ocular abnormalities, and defects in urogenital and limb morphogenesis. NCAPG2 encodes a member of the condensin II complex, necessary for the condensation of chromosomes prior to cell division. Consistent with a causal role for NCAPG2, we found abnormal chromosome condensation, augmented anaphase chromatin-bridge formation, and micronuclei in daughter cells of proband skin fibroblasts. To test the functional relevance of the discovered variants, we generated an ncapg2 zebrafish model. Morphants displayed clinically relevant phenotypes, such as renal anomalies, microcephaly, and concomitant increases in apoptosis and altered mitotic progression. These could be rescued by wild-type but not mutant human NCAPG2 mRNA and were recapitulated in CRISPR-Cas9 F0 mutants. Finally, we noted that the individual with a complex urogenital defect also harbored a heterozygous NPHP1 deletion, a common contributor to nephronophthisis. To test whether sensitization at the NPHP1 locus might contribute to a more severe renal phenotype, we co-suppressed nphp1 and ncapg2, which resulted in significantly more dysplastic renal tubules in zebrafish larvae. Together, our data suggest that impaired function of NCAPG2 results in a severe condensinopathy, and they highlight the potential utility of examining candidate pathogenic lesions beyond the primary disease locus.

Keywords: NCAPD3; NCAPH2; NPHP1; cell cycle delay; chromosome condensation; genetic interaction; microcephaly; micronuclei; renal cyst; zebrafish.


Figures

Figure 1
Figure 1
Two Unrelated Pedigrees with Complex Syndromic Features Harbor Recessive NCAPG2 Mutations (A) Pedigrees of two families harboring NCAPG2 missense mutations. Family 1 has one affected female with compound-heterozygous missense NCAPG2 mutations, c.1825A>G (p.Lys609Glu) and c.2078C>T (p.Thr693Met); three healthy siblings are either wild-type (WT) or heterozygous for the mutations (mut). An affected female from an unrelated pedigree (family 2) inherited a homozygous missense NCAPG2 mutation, c.2548A>C (p.Thr850Pro), from carrier parents. The healthy dizygotic twin sibling of the proband is homozygous for the WT allele. Affected individuals (shaded symbols) are denoted with an arrow in each pedigree; NA = sample not available. (B) Brain MRI without contrast (family 1 proband, 9 years of age) indicates cerebellar vermian hypoplasia (blue arrows). (C) A renal ultrasound (US; family 1 proband, 1 year of age) shows bilateral grade I hydronephrosis (green arrows); right kidney, 4.8 cm; left kidney, 4.6 cm. (D) A renal US (family 2 proband, 2 months of age) shows bilateral grade II hydronephrosis (green arrows); right kidney, 3.0 cm; left kidney, 2.9 cm. (E) A radiograph (family 1 proband, 5 years of age) indicates thoracolumbar S-shaped scoliosis. L = left. (F) A radiograph (family 2 proband, 1 month of age) shows a low-lying conus medullaris terminating at the bottom of L3; there is no evidence of a thickened filum terminale or spinal dysraphism. (G) Radiographs (family 1 proband, 19 months of age) show bilateral polydactyly of the feet. There are 6 digits in each foot and each has a proximal, middle, and distal phalanx. (H) Schematic of the NCAPG2 protein (GenBank: NP_060230.5) showing domain structure and localization of mutations identified in affected individuals (indicated by red arrow). Numbers indicate amino acid position; N = amino-terminus; C = carboxyl-terminus.
Figure 2
Figure 2
Primary Fibroblasts from the Family 1 Proband Display Augmented Apoptosis, Possibly Due to Mitotic Chromosome Condensation Defects (A) Representative epifluorescent images of TUNEL positive nuclei; DAPI = blue; TUNEL positive nuclei = red. Top: scale bar, 20 μm (40x objective). Bottom: scale bar, 10 μm (63x objective). (B) Qualitative scoring of TUNEL positive nuclei in control and proband-derived fibroblasts; n = 2,504–4,794 nuclei per condition, repeated. (C) Qualitative scoring of primary skin fibroblast cells subjected to the ICS assay. DAPI-stained nuclei originating from an ethnically matched unrelated healthy control, the unaffected mother, and the proband of family 1 were scored according to objective criteria. Blue = retained chromosome morphology, yellow = lost lateral compaction, and red = were totally disorganized; n = 53–115 nuclei per condition, repeated. Statistical comparisons were performed with a χ2 test; NS = not significant (D) Epifluorescent images of mitotic chromosomes representative of different qualitative categories; the scale bar represents 10 μm. (E) Representative epifluorescent images of DAPI stained nuclei with displaying various abnormalities subsequent to aberrant chromosome condensation; these include micronuclei (top), lagging chromatin and chromatin bridges (bottom); scale bar, 10 μm. (F) Qualitative scoring of micronuclei in control and proband derived fibroblasts stained with DAPI; n=3513-6946 nuclei per condition, repeated. Statistical comparisons were performed using a χ2 test; ∗∗∗∗, p < 0.0001.
Figure 3
Figure 3
Morpholino-Induced Suppression and CRISPR-Cas9 Mutation of ncapg2 Results in Neuroanatomical and Renal Phenotypes Relevant to Human Pathology (A) Representative bright-field dorsal images of zebrafish larvae at 3 days post-fertilization (dpf) show a reduction in head size (length from the pectoral fin attachment to the mouth, blue dotted line) in morphants (MO) and CRISPR-Cas9 F0 mutants (sgRNA1 + Cas9). The scale bar (yellow line) represents 100 μm. (B) Quantification of head-size measurements acquired for larvae at 3 dpf demonstrates pathogenicity of variants identified in affected individuals. NCAPG2 mRNA harboring a common variant was included so that specificity could be demonstrated (dbSNP: rs10248318: c.2381C>T [p.Thr794Met]; allele frequency 0.2% and present in five homozygous individuals in gnomAD). (n = 32–71 larvae/condition, repeated). (C) Representative lateral images of zebrafish larvae stained with Na+-K+ ATPase α-1 subunit antibody at 4 dpf. Larvae display an increase in the diameter of the renal tubule posterior to the proximal convolution (blue line) in morphants and CRISPR-Cas9 F0 mutants. The scale bar (yellow line) (represents 50 μm. (D) Quantification of renal-tubule measurements is consistent with assay results from head-size measurements (n = 26–50 larvae/condition, repeated). p values calculated with a Student’s t-test are shown on top of the bar charts; ns = not significant; error bars represent standard error of the mean (SEM).
Figure 4
Figure 4
Suppression and Mutation of ncapg2 Results in Apoptosis and Altered Mitotic Progression in Zebrafish Larvae (A) Representative dorsal images of zebrafish larvae marked by terminal deoxynucleotidyl transferase dUTP nick-end labeling (TUNEL) display increased apoptosis in the forebrain-midbrain region (yellow dotted rectangle) of morphants (MO) and ncapg2 F0 mutants (sgRNA1 + Cas9) at 2 dpf. WT = wild-type; the scale bar (blue line) represents 100 μm (B) Quantification of TUNEL-stained cells shows significantly increased apoptosis in morphants (MO) and F0 mutants (sgRNA1 + Cas9) compared to controls. Co-injection of MO with WT NCAPG2 mRNA (MO + WT) significantly rescues apoptotic-cell counts. n = 21–35 larvae/condition, repeated. (C) Representative dorsal images of zebrafish larvae stained at 2 dpf with phospho-histone H3 (PH3) antibody display aberrant cell-cycle progression as indicated by the G2/M cell-cycle transition marker in the forebrain-midbrain region (yellow dotted rectangle) of morphants (MO) and ncapg2 F0 mutants (sgRNA1 + Cas9). The scale bar (blue line) represents 100μm. (D) Quantification of PH3-stained cells in anterior structures indicates a significantly altered cell-cycle progression in ncapg2 zebrafish models. Co-injection of MO with WT NCAPG2 mRNA (MO + WT) significantly rescues PH3-cell count defects. n = 29–35 larvae/condition, repeated. p values calculated with a Student’s t-test are given on top of the bar charts; ns = not significant; error bars represent standard error of the mean (SEM).
Figure 5
Figure 5
Genetic Interaction Studies Indicate that Co-suppression of ncapg2 and nphp1 Results in Exacerbation of the Renal Phenotype (A) Representative images of zebrafish larvae immunostained with Na+-K+ ATPase α-1 subunit antibody at 4 dpf. Right, lateral images of zebrafish pronephric tubules; left, the proximal convolution tubule is magnified. The blue line on the top left image indicates the diameter. The scale bar (yellow line) represents 50 μm. (B) Quantification of the diameter of the renal tubule positioned just posterior to the proximal convolution (μm); n = 35–52 larvae/batch, repeated; p values were calculated with a Student’s t-test; ns = not significant; error bars represent standard error of the mean (SEM).

Similar articles

Cited by

References

    1. Hu W.F., Chahrour M.H., Walsh C.A. The diverse genetic landscape of neurodevelopmental disorders. Annu. Rev. Genomics Hum. Genet. 2014;15:195–213. - PMC - PubMed
    1. Thapar A., Cooper M., Rutter M. Neurodevelopmental disorders. Lancet Psychiatry. 2017;4:339–346. - PubMed
    1. Firth H.V., Richards S.M., Bevan A.P., Clayton S., Corpas M., Rajan D., Van Vooren S., Moreau Y., Pettett R.M., Carter N.P. DECIPHER: Database of chromosomal imbalance and phenotype in humans using ensembl resources. Am. J. Hum. Genet. 2009;84:524–533. - PMC - PubMed
    1. Krumm N., O’Roak B.J., Shendure J., Eichler E.E. A de novo convergence of autism genetics and molecular neuroscience. Trends Neurosci. 2014;37:95–105. - PMC - PubMed
    1. Sanders S.J., He X., Willsey A.J., Ercan-Sencicek A.G., Samocha K.E., Cicek A.E., Murtha M.T., Bal V.H., Bishop S.L., Dong S., Autism Sequencing Consortium Insights into autism spectrum disorder genomic architecture and biology from 71 risk loci. Neuron. 2015;87:1215–1233. - PMC - PubMed

Publication types

MeSH terms