Sphingosine-1-Phosphate Receptor 2 Controls Podosome Components Induced by RANKL Affecting Osteoclastogenesis and Bone Resorption
- PMID: 30609675
- PMCID: PMC6357083
- DOI: 10.3390/cells8010017
Sphingosine-1-Phosphate Receptor 2 Controls Podosome Components Induced by RANKL Affecting Osteoclastogenesis and Bone Resorption
Abstract
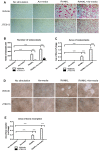
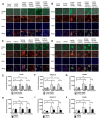
Proinflammatory cytokine production, cell chemotaxis, and osteoclastogenesis can lead to inflammatory bone loss. Previously, we showed that sphingosine-1-phosphate receptor 2 (S1PR2), a G protein coupled receptor, regulates inflammatory cytokine production and osteoclastogenesis. However, the signaling pathways regulated by S1PR2 in modulating inflammatory bone loss have not been elucidated. Herein, we demonstrated that inhibition of S1PR2 by a specific S1PR2 antagonist (JTE013) suppressed phosphoinositide 3-kinase (PI3K), mitogen-activated protein kinases (MAPKs), and nuclear factor kappa-B (NF-κB) induced by an oral bacterial pathogen, Aggregatibacter actinomycetemcomitans, and inhibited the release of IL-1β, IL-6, TNF-α, and S1P in murine bone marrow cells. In addition, shRNA knockdown of S1PR2 or treatment by JTE013 suppressed cell chemotaxis induced by bacteria-stimulated cell culture media. Furthermore, JTE013 suppressed osteoclastogenesis and bone resorption induced by RANKL in murine bone marrow cultures. ShRNA knockdown of S1PR2 or inhibition of S1PR2 by JTE013 suppressed podosome components, including PI3K, Src, Pyk2, integrin β3, filamentous actin (F-actin), and paxillin levels induced by RANKL in murine bone marrow cells. We conclude that S1PR2 plays an essential role in modulating proinflammatory cytokine production, cell chemotaxis, osteoclastogenesis, and bone resorption. Inhibition of S1PR2 signaling could be a novel therapeutic strategy for bone loss associated with skeletal diseases.
Keywords: bone loss; chemotaxis; cytokines; osteoclast; podosome; sphingosine-1-phosphate receptor 2.
Conflict of interest statement
The authors declare no potential conflicts of interest.
Figures


Similar articles
-
CD38 Inhibitor 78c Attenuates Pro-Inflammatory Cytokine Expression and Osteoclastogenesis in Macrophages.Cells. 2024 Nov 28;13(23):1971. doi: 10.3390/cells13231971. Cells. 2024. PMID: 39682719 Free PMC article.
-
Sphingosine-1-Phosphate Receptor 2 Regulates Proinflammatory Cytokine Production and Osteoclastogenesis.PLoS One. 2016 May 25;11(5):e0156303. doi: 10.1371/journal.pone.0156303. eCollection 2016. PLoS One. 2016. PMID: 27224249 Free PMC article.
-
FTY720 inhibited proinflammatory cytokine release and osteoclastogenesis induced by Aggregatibacter actinomycetemcomitans.Lipids Health Dis. 2015 Jul 4;14:66. doi: 10.1186/s12944-015-0057-7. Lipids Health Dis. 2015. PMID: 26138336 Free PMC article.
-
Targeting S1PRs as a Therapeutic Strategy for Inflammatory Bone Loss Diseases-Beyond Regulating S1P Signaling.Int J Mol Sci. 2021 Apr 23;22(9):4411. doi: 10.3390/ijms22094411. Int J Mol Sci. 2021. PMID: 33922596 Free PMC article. Review.
-
Integrin-associated molecules and signalling cross talking in osteoclast cytoskeleton regulation.J Cell Mol Med. 2020 Mar;24(6):3271-3281. doi: 10.1111/jcmm.15052. Epub 2020 Feb 11. J Cell Mol Med. 2020. PMID: 32045092 Free PMC article. Review.
Cited by
-
CD38 Inhibitor 78c Attenuates Pro-Inflammatory Cytokine Expression and Osteoclastogenesis in Macrophages.Cells. 2024 Nov 28;13(23):1971. doi: 10.3390/cells13231971. Cells. 2024. PMID: 39682719 Free PMC article.
-
Inhibition of Sphingosine-1-Phosphate Receptor 2 by JTE013 Promoted Osteogenesis by Increasing Vesicle Trafficking, Wnt/Ca2+, and BMP/Smad Signaling.Int J Mol Sci. 2021 Nov 8;22(21):12060. doi: 10.3390/ijms222112060. Int J Mol Sci. 2021. PMID: 34769490 Free PMC article.
-
Nitazoxanide, an Antiprotozoal Drug, Reduces Bone Loss in Ovariectomized Mice by Inhibition of RANKL-Induced Osteoclastogenesis.Front Pharmacol. 2021 Dec 9;12:781640. doi: 10.3389/fphar.2021.781640. eCollection 2021. Front Pharmacol. 2021. PMID: 34955850 Free PMC article.
-
Rescue of mitochondrial import failure by intercellular organellar transfer.Nat Commun. 2024 Feb 2;15(1):988. doi: 10.1038/s41467-024-45283-2. Nat Commun. 2024. PMID: 38307874 Free PMC article.
-
The Role of Sphingolipid Metabolism in Bone Remodeling.Front Cell Dev Biol. 2021 Nov 29;9:752540. doi: 10.3389/fcell.2021.752540. eCollection 2021. Front Cell Dev Biol. 2021. PMID: 34912800 Free PMC article. Review.
References
-
- Brincat S.D., Borg M., Camilleri G., Calleja-Agius J. The role of cytokines in postmenopausal osteoporosis. Minerva Ginecol. 2014;66:391–407. - PubMed
Publication types
MeSH terms
Substances
Grants and funding
LinkOut - more resources
Full Text Sources
Molecular Biology Databases
Miscellaneous

