

Use of Hyperspectral/Multispectral Imaging in Gastroenterology. Shedding Some⁻Different⁻Light into the Dark
- PMID: 30609685
- PMCID: PMC6352071
- DOI: 10.3390/jcm8010036
Use of Hyperspectral/Multispectral Imaging in Gastroenterology. Shedding Some⁻Different⁻Light into the Dark
Abstract
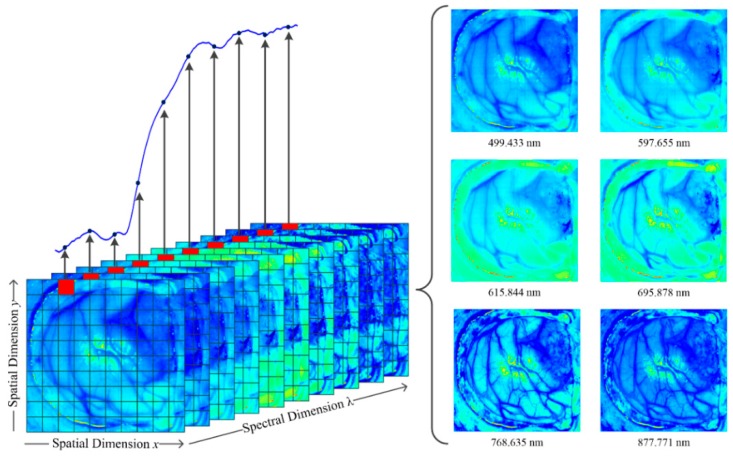
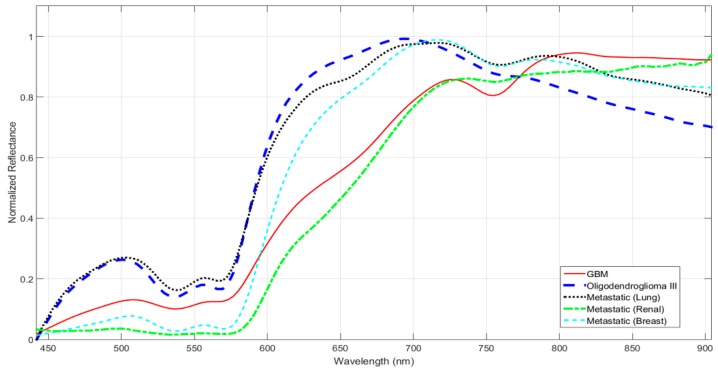
Hyperspectral/Multispectral imaging (HSI/MSI) technologies are able to sample from tens to hundreds of spectral channels within the electromagnetic spectrum, exceeding the capabilities of human vision. These spectral techniques are based on the principle that every material has a different response (reflection and absorption) to different wavelengths. Thereby, this technology facilitates the discrimination between different materials. HSI has demonstrated good discrimination capabilities for materials in fields, for instance, remote sensing, pollution monitoring, field surveillance, food quality, agriculture, astronomy, geological mapping, and currently, also in medicine. HSI technology allows tissue observation beyond the limitations of the human eye. Moreover, many researchers are using HSI as a new diagnosis tool to analyze optical properties of tissue. Recently, HSI has shown good performance in identifying human diseases in a non-invasive manner. In this paper, we show the potential use of these technologies in the medical domain, with emphasis in the current advances in gastroenterology. The main aim of this review is to provide an overview of contemporary concepts regarding HSI technology together with state-of-art systems and applications in gastroenterology. Finally, we discuss the current limitations and upcoming trends of HSI in gastroenterology.
Keywords: biomedical optical imaging; clinical diagnosis; gastroenterology; hyperspectral imaging; medical diagnostic imaging; multispectral imaging.
Conflict of interest statement
The authors declare no conflict of interest. The funders had no role in the design of the study; in the collection, analyses, or interpretation of data; in the writing of the manuscript, or in the decision to publish the results.
Figures
Similar articles
-
In-Vivo and Ex-Vivo Tissue Analysis through Hyperspectral Imaging Techniques: Revealing the Invisible Features of Cancer.Cancers (Basel). 2019 May 30;11(6):756. doi: 10.3390/cancers11060756. Cancers (Basel). 2019. PMID: 31151223 Free PMC article. Review.
-
Hyperspectral and multispectral imaging in digital and computational pathology: a systematic review [Invited].Biomed Opt Express. 2020 May 21;11(6):3195-3233. doi: 10.1364/BOE.386338. eCollection 2020 Jun 1. Biomed Opt Express. 2020. PMID: 32637250 Free PMC article. Review.
-
Trends in hyperspectral imaging: from environmental and health sensing to structure-property and nano-bio interaction studies.Anal Bioanal Chem. 2022 Jun;414(15):4269-4279. doi: 10.1007/s00216-022-03959-y. Epub 2022 Feb 17. Anal Bioanal Chem. 2022. PMID: 35175390
-
Hyperspectral Images Super-Resolution via Learning High-Order Coupled Tensor Ring Representation.IEEE Trans Neural Netw Learn Syst. 2020 Nov;31(11):4747-4760. doi: 10.1109/TNNLS.2019.2957527. Epub 2020 Oct 30. IEEE Trans Neural Netw Learn Syst. 2020. PMID: 31902776
-
Hyperspectral Imaging: A Review and Trends towards Medical Imaging.Curr Med Imaging. 2022;19(5):417-427. doi: 10.2174/1573405618666220519144358. Curr Med Imaging. 2022. PMID: 35598236 Review.
Cited by
-
Snapshot multispectral imaging using a diffractive optical network.Light Sci Appl. 2023 Apr 6;12(1):86. doi: 10.1038/s41377-023-01135-0. Light Sci Appl. 2023. PMID: 37024463 Free PMC article.
-
Comprehensive review of surgical microscopes: technology development and medical applications.J Biomed Opt. 2021 Jan;26(1):010901. doi: 10.1117/1.JBO.26.1.010901. J Biomed Opt. 2021. PMID: 33398948 Free PMC article. Review.
-
Hyperspectral imaging with deep learning for quantification of tissue hemoglobin, melanin, and scattering.J Biomed Opt. 2024 Sep;29(9):093507. doi: 10.1117/1.JBO.29.9.093507. Epub 2024 Sep 6. J Biomed Opt. 2024. PMID: 39247058 Free PMC article.
-
Small Bowel-Key Player in Health and Disease.J Clin Med. 2019 Oct 21;8(10):1748. doi: 10.3390/jcm8101748. J Clin Med. 2019. PMID: 31640212 Free PMC article.
-
Spectral Similarity Measures for In Vivo Human Tissue Discrimination Based on Hyperspectral Imaging.Diagnostics (Basel). 2023 Jan 5;13(2):195. doi: 10.3390/diagnostics13020195. Diagnostics (Basel). 2023. PMID: 36673005 Free PMC article.
References
-
- Grahn H.F., Geladi P., editors. Techniques and Applications of Hyperspectral Image Analysis. John Wiley & Sons, Ltd.; Chichester, UK: 2007.
-
- Lorente D., Aleixos N., Gómez-Sanchis J., Cubero S., García-Navarrete O.L., Blasco J. Recent Advances and Applications of Hyperspectral Imaging for Fruit and Vegetable Quality Assessment. Food Bioprocess Technol. 2011;5:1121–1142. doi: 10.1007/s11947-011-0725-1. - DOI
-
- Tatzer P., Wolf M., Panner T. Industrial application for inline material sorting using hyperspectral imaging in the NIR range. Real-Time Imaging. 2005;11:99–107. doi: 10.1016/j.rti.2005.04.003. - DOI
-
- Kubik M. Chapter 5 Hyperspectral Imaging: A New Technique for the Non-Invasive Study of Artworks. Phys. Tech. Study Art, Archaeol. Cult. Herit. 2007;2:199–259. doi: 10.1016/S1871-1731(07)80007-8. - DOI
Publication types
Grants and funding
- ProID2017010164/Agencia Canaria de Investigación, Innovación y Sociedad de la Información
- 618080/European Commission
- POC 2014-2020, Eje 3 Tema Prioritario 74 (85%)/Agencia Canaria de Investigación, Innovación y Sociedad de la Información
- 2016 PhD Training Program for Research Staff/Universidad de Las Palmas de Gran Canaria
LinkOut - more resources
Full Text Sources
