Polyester Nanoparticle Encapsulation Mitigates Paclitaxel-Induced Peripheral Neuropathy
- PMID: 30609902
- PMCID: PMC6426664
- DOI: 10.1021/acschemneuro.8b00703
Polyester Nanoparticle Encapsulation Mitigates Paclitaxel-Induced Peripheral Neuropathy
Abstract
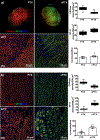
Chemotherapy utilizing cytotoxic drugs, such as paclitaxel (PTX), is still a commonly used therapeutic approach to treat both localized and metastasized cancers. Unlike traditional regimens in which PTX is administered at the maximum tolerated dose, alternative regimens like metronomic dosing are beneficial by administering PTX more frequently and in much lower doses exploiting antiangiogenic and immunomodulatory effects. However, PTX-induced peripheral neuropathy and lack of patient compliant dosage forms of PTX are major roadblocks for the successful implementation of metronomic regimens. Because of the success of polyester nanoparticle drug delivery, we explored the potential of nanoparticle-encapsulated paclitaxel (nPTX) in alleviating peripheral neuropathy using a rat model. Rats were injected intraperitoneally with 2 mg/kg body weight of PTX or nPTX on four alternate days, and neuropathic pain and neuronal damage were characterized using behavioral assessments, histology, and immunohistochemistry. The reduction in tactile and nociceptive pressure thresholds was significantly less in nPTX-treated rats than in PTX-treated rats over a 16-day study period. Histological analysis showed that the degree of dorsal root ganglion (DRG) degeneration and reduction in motor neurons in the spinal cord was significantly lower in the nPTX group than the PTX group. Further, immunofluorescence data reveals that nPTX-treated rats had an increased density of a neuronal marker, β-tubulin-III, reduced TUNEL positive cells, and increased high molecular weight neurofilament in the spinal cord, DRG, and sciatic nerves compared with PTX-treated rats. Therefore, this work has important implications in improving risk-benefit profile of PTX, paving the way for metronomic regimens.
Keywords: Dorsal root ganglion; motor neurons; nanoparticles; necrosis; neuropathic pain; paclitaxel; sustained release.
Figures


Similar articles
-
Participation of transient receptor potential vanilloid 1 in the analgesic effect of duloxetine for paclitaxel induced peripheral neuropathic pain.Neurosci Lett. 2022 Mar 16;773:136512. doi: 10.1016/j.neulet.2022.136512. Epub 2022 Feb 8. Neurosci Lett. 2022. PMID: 35149198
-
Phosphate NIMA-Related Kinase 2-Dependent Epigenetic Pathways in Dorsal Root Ganglion Neurons Mediates Paclitaxel-Induced Neuropathic Pain.Anesth Analg. 2023 Dec 1;137(6):1289-1301. doi: 10.1213/ANE.0000000000006397. Epub 2023 Feb 8. Anesth Analg. 2023. PMID: 36753440
-
An in vivo mechanism for the reduced peripheral neurotoxicity of NK105: a paclitaxel-incorporating polymeric micellar nanoparticle formulation.Int J Nanomedicine. 2017 Feb 15;12:1293-1304. doi: 10.2147/IJN.S114356. eCollection 2017. Int J Nanomedicine. 2017. PMID: 28243090 Free PMC article.
-
[Role of Transient Receptor Potential Channels in Paclitaxel- and Oxaliplatin-induced Peripheral Neuropathy].Yakugaku Zasshi. 2016;136(2):287-96. doi: 10.1248/yakushi.15-00214. Yakugaku Zasshi. 2016. PMID: 26831807 Review. Japanese.
-
Mechanisms underlying paclitaxel-induced neuropathic pain: Channels, inflammation and immune regulations.Eur J Pharmacol. 2022 Oct 15;933:175288. doi: 10.1016/j.ejphar.2022.175288. Epub 2022 Sep 17. Eur J Pharmacol. 2022. PMID: 36122757 Review.
Cited by
-
Improving anti-tumor efficacy of low-dose Vincristine in rhabdomyosarcoma via the combination therapy with FOXM1 inhibitor RCM1.Front Oncol. 2023 Feb 2;13:1112859. doi: 10.3389/fonc.2023.1112859. eCollection 2023. Front Oncol. 2023. PMID: 36816948 Free PMC article.
-
Evaluation and application analysis of animal models of PIPNP based on data mining.Open Life Sci. 2025 Jul 8;20(1):20251122. doi: 10.1515/biol-2025-1122. eCollection 2025. Open Life Sci. 2025. PMID: 40667489 Free PMC article. Review.
-
Self-assembled and pH-responsive polymeric nanomicelles impart effective delivery of paclitaxel to cancer cells.RSC Adv. 2021 Apr 13;11(23):13928-13939. doi: 10.1039/d1ra01574e. eCollection 2021 Apr 13. RSC Adv. 2021. PMID: 35423920 Free PMC article.
References
-
- DeVita VT Jr., and Chu E (2008) A history of cancer chemotherapy. Cancer Res. 68, 8643–8653. - PubMed
-
- Goodman LS, Wintrobe MM, et al. (1946) Nitrogen mustard therapy; use of methylbis (beta-chloroethyl) amine hydrochloride and tris (beta-chloroethyl) amine hydrochloride for Hodgkin’s disease, lymphosarcoma, leukemia and certain allied and miscellaneous disorders. J. Am. Med. Assoc 132, 126–132. - PubMed
-
- Wall ME, and Wani MC (1995) Camptothecin and taxol: discovery to clinic--thirteenth Bruce F. Cain Memorial Award Lecture. Cancer Res. 55, 753–760. - PubMed
-
- Wani MC, Taylor HL, Wall ME, Coggon P, and McPhail AT (1971) Plant antitumor agents. VI. The isolation and structure of taxol, a novel antileukemic and antitumor agent from Taxus brevifolia. J. Am. Chem. Soc 93, 2325–2327. - PubMed
Publication types
MeSH terms
Substances
Grants and funding
LinkOut - more resources
Full Text Sources

