

Frozen-hydrated chromatin from metaphase chromosomes has an interdigitated multilayer structure
- PMID: 30609992
- PMCID: PMC6443200
- DOI: 10.15252/embj.201899769
Frozen-hydrated chromatin from metaphase chromosomes has an interdigitated multilayer structure
Abstract
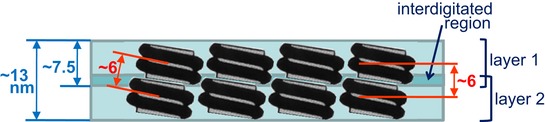
Cryo-electron tomography and small-angle X-ray scattering were used to investigate the chromatin folding in metaphase chromosomes. The tomographic 3D reconstructions show that frozen-hydrated chromatin emanated from chromosomes is planar and forms multilayered plates. The layer thickness was measured accounting for the contrast transfer function fringes at the plate edges, yielding a width of ~ 7.5 nm, which is compatible with the dimensions of a monolayer of nucleosomes slightly tilted with respect to the layer surface. Individual nucleosomes are visible decorating distorted plates, but typical plates are very dense and nucleosomes are not identifiable as individual units, indicating that they are tightly packed. Two layers in contact are ~ 13 nm thick, which is thinner than the sum of two independent layers, suggesting that nucleosomes in the layers interdigitate. X-ray scattering of whole chromosomes shows a main scattering peak at ~ 6 nm, which can be correlated with the distance between layers and between interdigitating nucleosomes interacting through their faces. These observations support a model where compact chromosomes are composed of many chromatin layers stacked along the chromosome axis.
Keywords: DNA packaging; chromatin higher‐order structure; cryo‐electron tomography; metaphase chromosome structure; small‐angle X‐ray scattering.
© 2019 The Authors.
Conflict of interest statement
The authors declare that they have no conflict of interest.
Figures
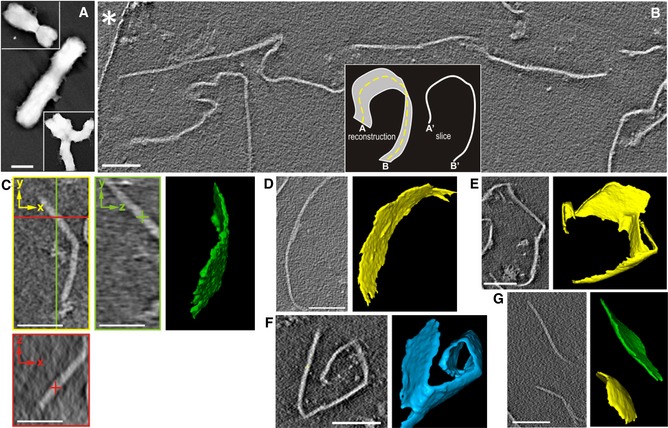
- A
Whole chromosomes imaged by conventional TEM.
- B
Slice from a large tomographic volume; part of the carbon film surrounding a hole with vitrified ice containing the plates is indicated with an asterisk; the inset illustrates that the slice of a plate corresponds to a line in the x‐y plane (perpendicular to the direction of the electron beam).
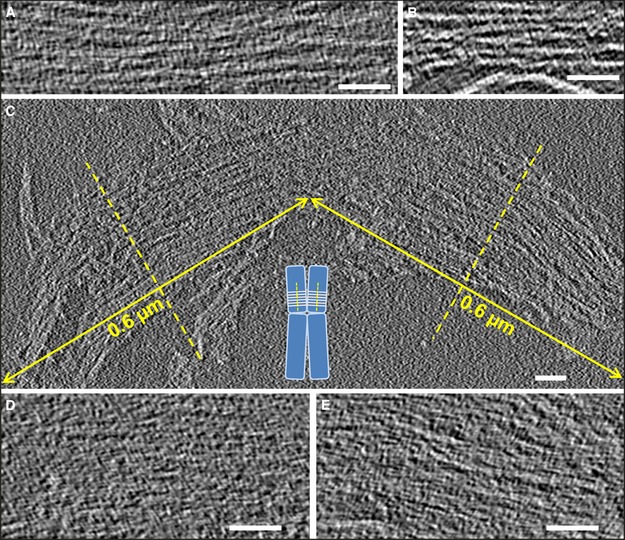
- C–G
Slices from different tomograms and the corresponding 3D segmentations showing plates with different sizes and shapes. In addition to a typical slice through the x‐y plane (yellow), two slices through the x‐z (red) and y‐z (green) planes (orthogonal to the x‐y plane) are shown in (C).
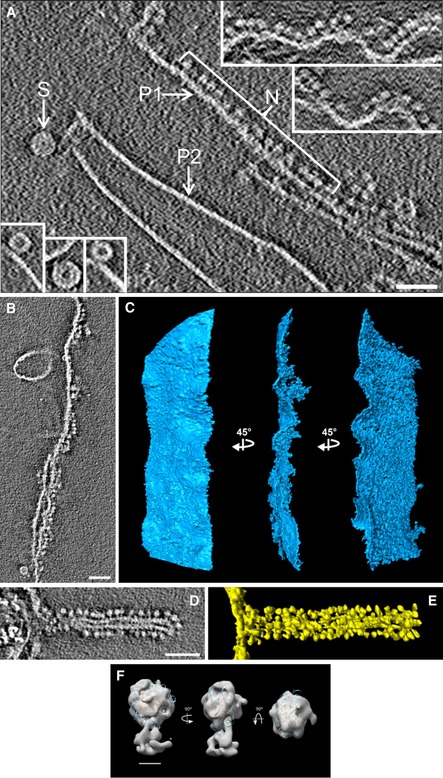
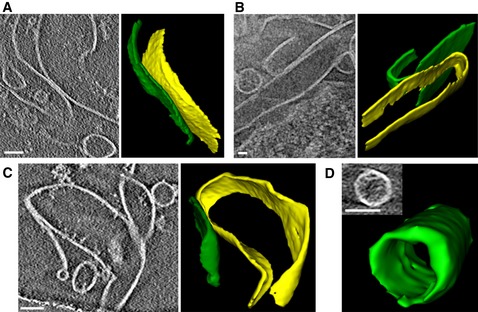
- A
Nucleosomes (N) decorating a relaxed plate (P1); insets in the upper right show additional examples. Nucleosomes are not visible as individual units in typical compact plates (P2). Short compact interdigitated solenoids are shown in the main image (S) and in the bottom‐left insets.
- B–E
Slice (B) and segmentations in three different orientations (C) of a large relaxed plate decorated with many nucleosomes on its right side. Slice (D) and segmentation (E) of a relaxed plate forming a tube decorated with nucleosomes.
- F
Structure of the decorative particles (like those shown in N, panel A) after subtomogram averaging. The final density map was filtered to 25 Å and fitted with the molecular structure of the nucleosome core particle (Protein Data Bank code 2CV5).
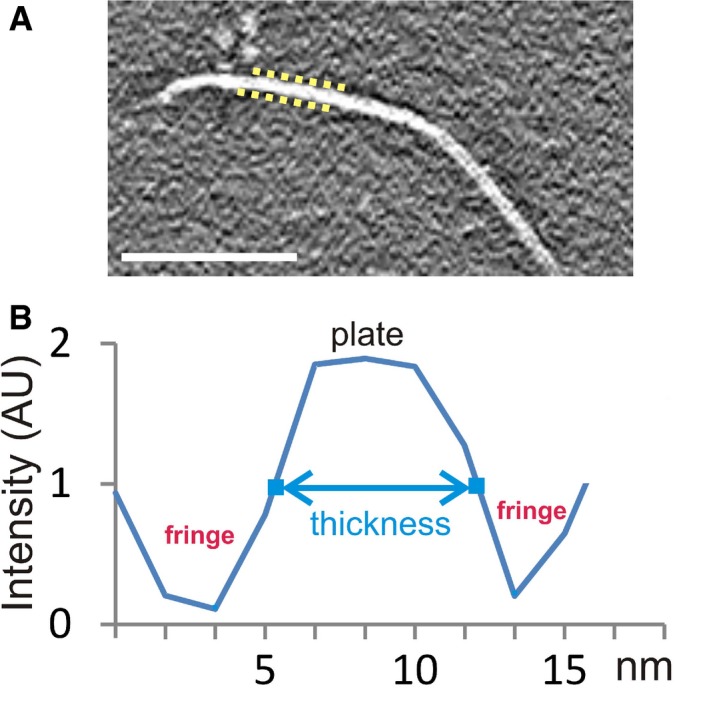
The discontinuous yellow lines indicate the position of the CTF fringes on a select region of a plate. These fringes (black in reverse contrast) surround both sides of the plates in the tomograms. Scale bar: 100 nm.
Example of an intensity profile along a vector perpendicular to a plate. Because of the CTF, the plate's intensity values do not have a hard edge, but rather gradually slope from the peak intensities of the plate to the valley of the surrounding CTF fringes. The plate thickness values presented in Table 1 correspond to the distance between the points (indicated in blue), approximately halfway between the peak and the valley. The intensities at these measurement points also roughly correspond to the background intensity of the tomogram. AU, arbitrary units.
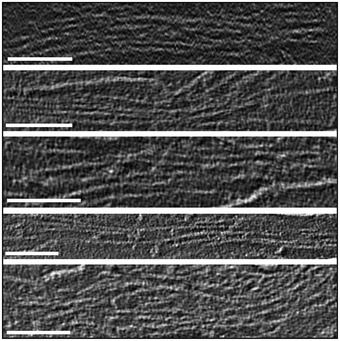
- A, B
Plates with several layers that are not closely appressed.
- C–E
Large multilayer plates having the size of human metaphase chromatids [∼0.6 µm diameter (Daban, 2014)] (C); the inset schematically shows the perpendicular orientation of chromatin layers with respect to the chromatid axes proposed in the thin‐plate model (Gállego et al, 2009; Castro‐Hartmann et al, 2010). In other slices (D, E), the multilayer structures shown in (C) are more compact and the individual layers are not visible as separate elements.
- A–C
Slices showing lateral association between two plates and the corresponding 3D segmentations.
- D
Edge‐to‐edge interactions form cylindrical structures.
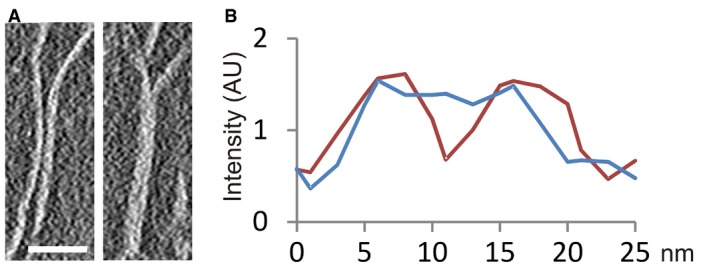
Slice showing a region of a tomographic volume in which there are two independent plates (left); in another region, these two plates are in close contact (right). Scale bar: 50 nm.
Intensity profile (red) along a vector perpendicular to the two independent plates shown in (A), and profile (blue) of the same plates in a region in which they are in contact. AU, arbitrary units.
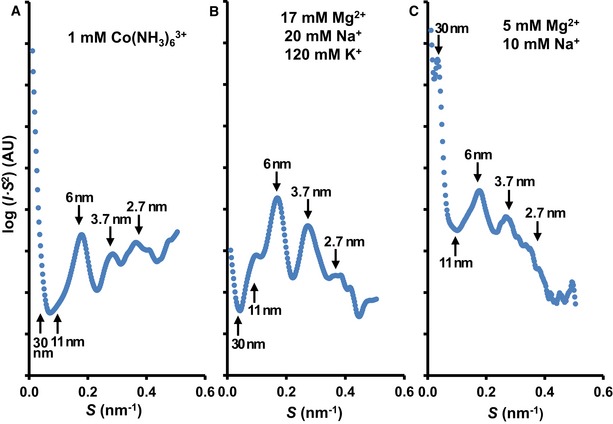
- A–C
The cation concentrations used are indicated for each experiment; AU, arbitrary units.
Comment in
-
Revealing chromatin organization in metaphase chromosomes.EMBO J. 2019 Apr 1;38(7):e101699. doi: 10.15252/embj.2019101699. Epub 2019 Mar 4. EMBO J. 2019. PMID: 30833290 Free PMC article.
References
-
- Alberts B, Johnson A, Lewis J, Morgan D, Raff M, Roberts K, Walter P (2014) Molecular biology of the cell, pp 207–216. New York, NY: Garland Science;
-
- Bartolomé S, Bermúdez A, Daban JR (1994) Internal structure of the 30 nm chromatin fiber. J Cell Sci 107: 2983–2992 - PubMed
-
- Bartolomé S, Bermúdez A, Daban JR (1995) Electrophoresis of chromatin on nondenaturing agarose gels containing Mg2+. Self‐assembly of small chromatin fragments and folding of the 30‐nm fiber. J Biol Chem 270: 22514–22521 - PubMed
Publication types
MeSH terms
Substances
LinkOut - more resources
Full Text Sources
