. 2019 Mar;7(3):414-427.
doi: 10.1158/2326-6066.CIR-18-0126. Epub 2019 Jan 4.

SUV39H1 Represses the Expression of Cytotoxic T-Lymphocyte Effector Genes to Promote Colon Tumor Immune Evasion

Affiliations

SUV39H1 Represses the Expression of Cytotoxic T-Lymphocyte Effector Genes to Promote Colon Tumor Immune Evasion

Chunwan Lu et al. Cancer Immunol Res. 2019 Mar.

Abstract

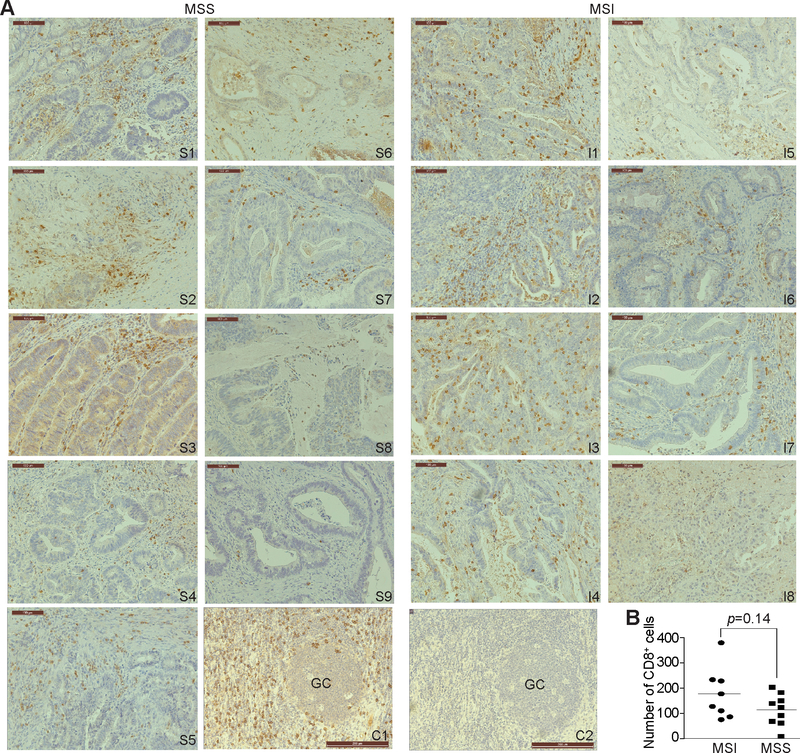
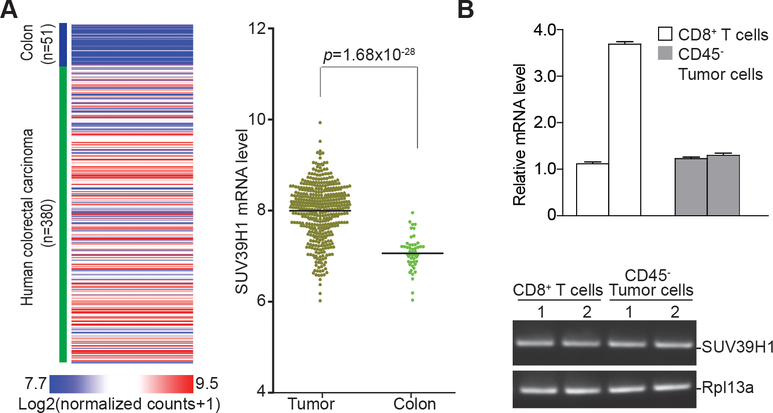
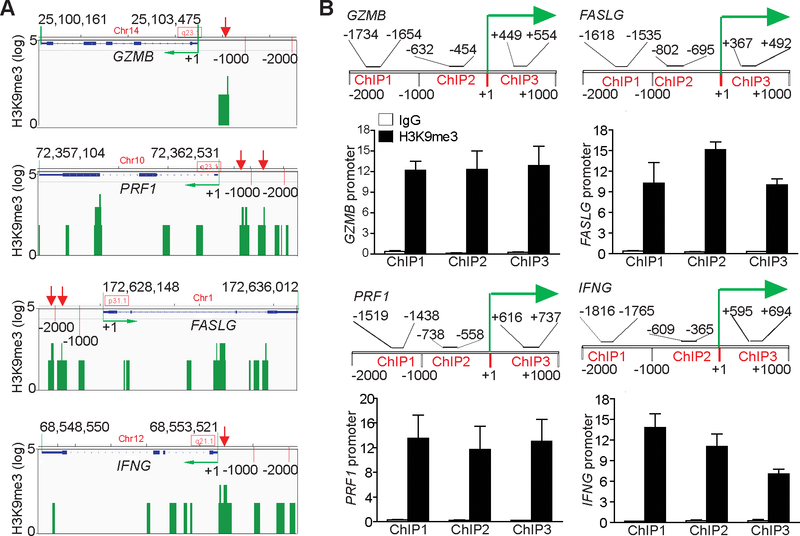
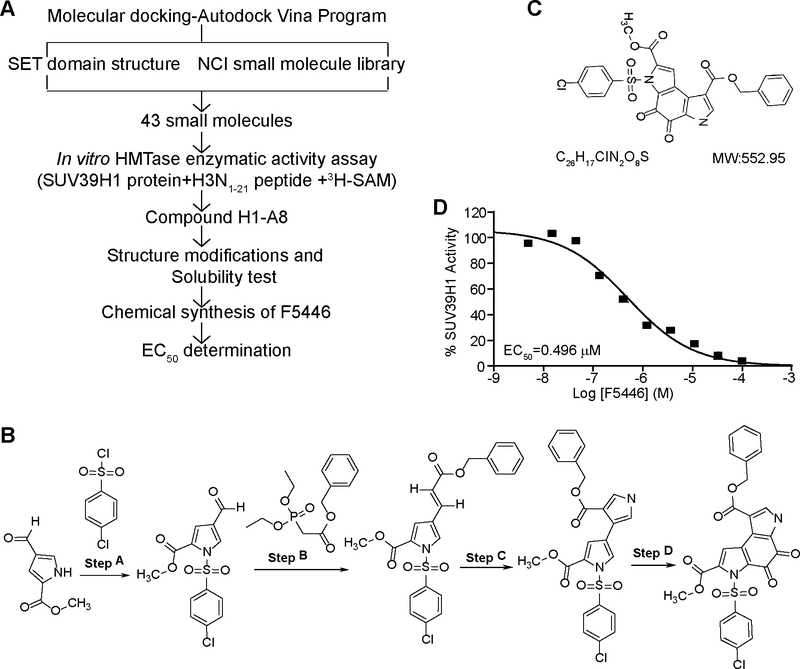
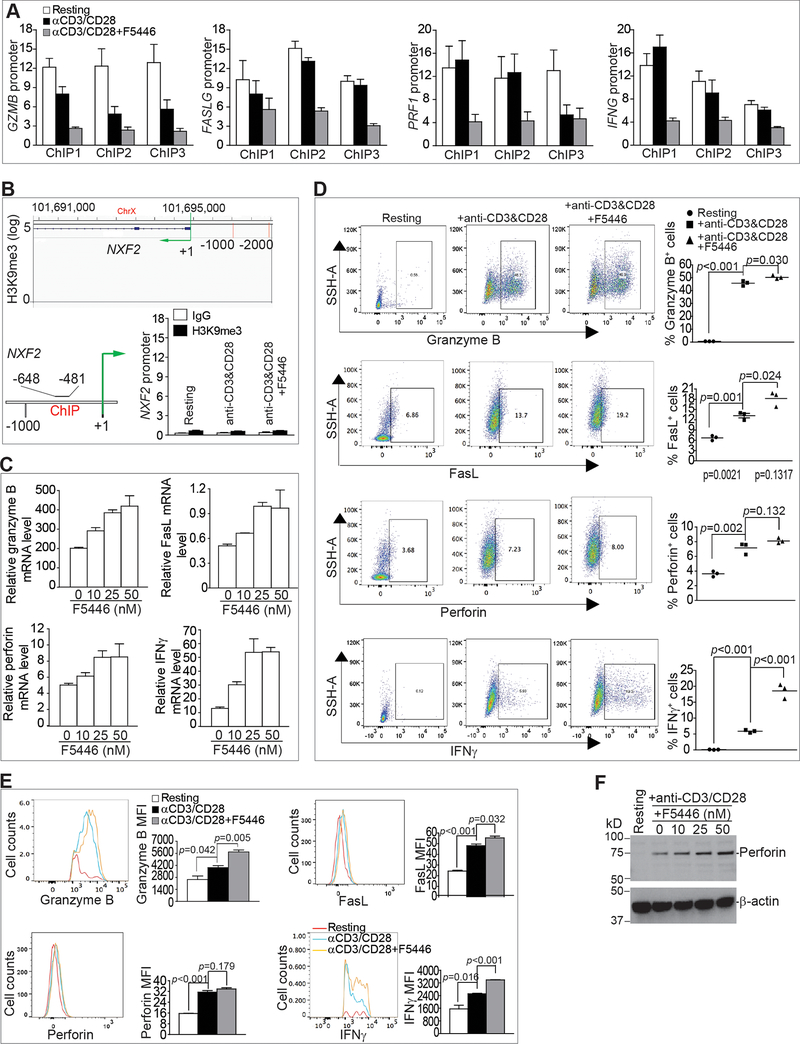
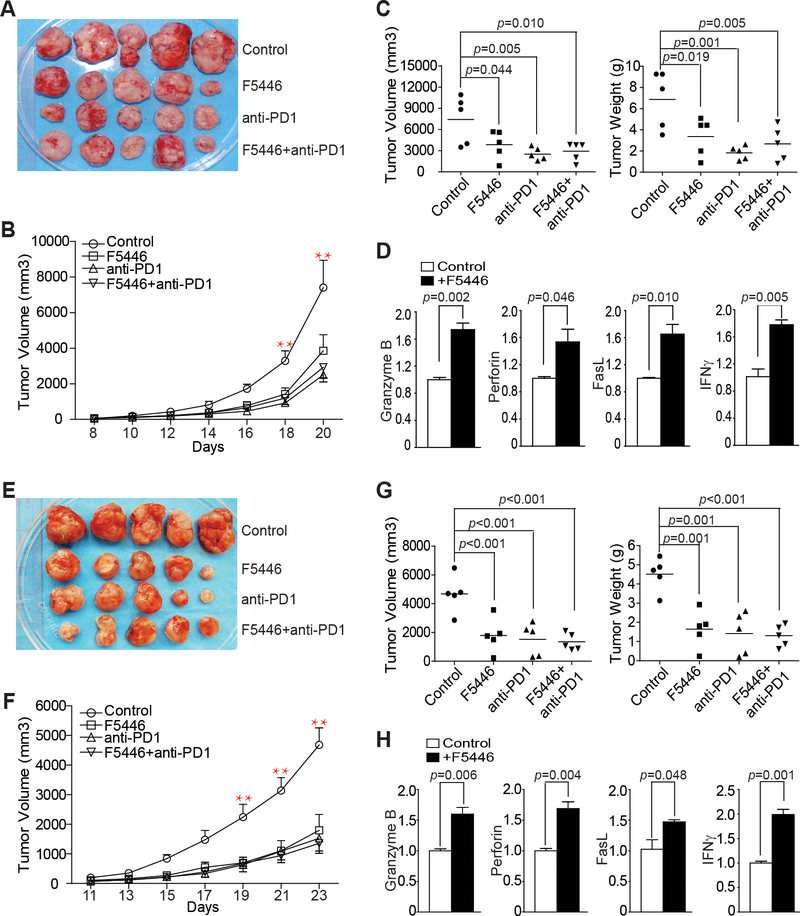
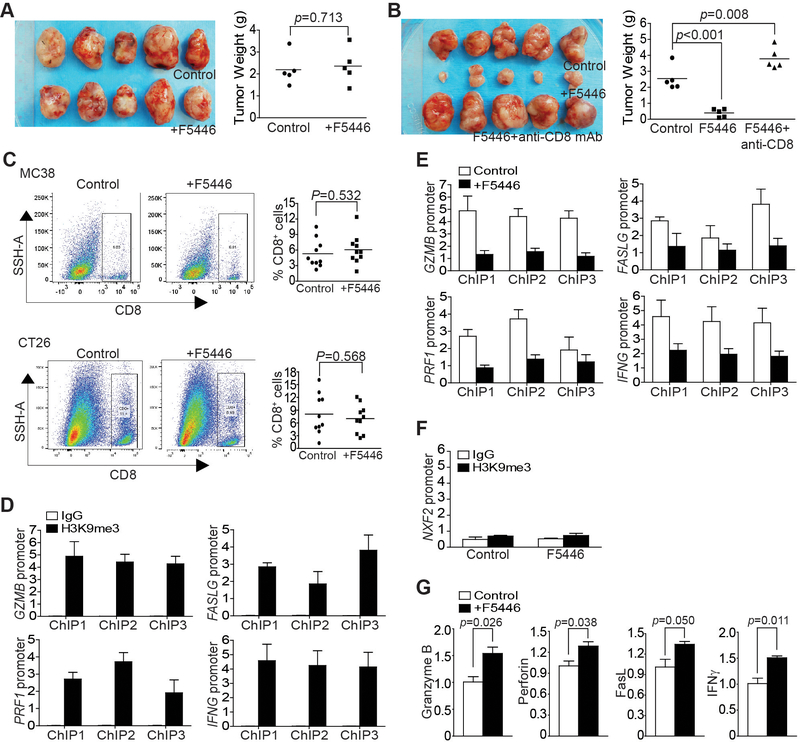
Despite the presence of CTLs in the tumor microenvironment, the majority of immunogenic human colon cancer does not respond to immune checkpoint inhibitor immunotherapy, and microsatellite instable (MSI) tumors are not naturally eliminated. The molecular mechanism underlying the inactivity of tumor-infiltrating CTLs is unknown. We report here that CTLs were present in both MSI and microsatellite stable colon tumors. The expression of the H3K9me3-specific histone methyltransferase SUV39H1 was significantly elevated in human colon carcinoma compared with normal colon tissues. Using a mouse colon carcinoma model, we further determined that tumor-infiltrating CTLs in the colon tumor microenvironment have high expression of SUV39H1. To target SUV39H1 in the tumor microenvironment, a virtual chemical library was screened on the basis of the SET (suppressor of variegation 3-9, enhancer of zeste and trithorax) domain structure of the human SUV39H1 protein. Functional enzymatic activity assays identified a small molecule that inhibits SUV39H1 enzymatic activity. On the basis of the structure of this small molecule, we modified it and chemically synthesized a small molecule, termed F5446, which has an EC50 of 0.496 μmol/L for SUV39H1 enzymatic activity. H3K9me3 was enriched in the promoters of GZMB, PRF1, FASLG, and IFNG in quiescent T cells. F5446 inhibited H3K9me3, thereby upregulating expression of these effectors in tumor-infiltrating CTLs and suppressing colon carcinoma growth in a CD8+ CTL-dependent manner in vivo Our data indicate that SUV39H1 represses CTL effector gene expression and, in doing so, confers colon cancer immune escape.


Conflict of interest statement

Conflict of interest: The authors have declared that no conflict of interest exists

Disclosure

The authors declare no conflict of interest.

Figures

Figure 1.
Figure 1.. Tumor-infiltrating CTLs in human MSS and MSI colon carcinoma.
A. Human colon carcinoma MSS (S1-S9, n=9) and MSI (I1-I8, n=8) tumor specimens were stained with CD8-specific antibody. Shown are representative images of tumor-infiltrating CD8+ CTLs. Human tonsil tissue was stained with the CD8-specific antibody (positive control, C1) or no primary antibody (negative control, C2) as in A. GC: germinal center. Scale bar=100 μM. B. The CD8+ CTLs were quantified in each tumor specimen and presented. Each dot represents number of CD8+ CTLs in one view area of a tumor specimen. Two-tail t tests were used to determine differences in CD8+ CTL infiltration between MSS and MSI tumor specimens with p<0.05 as being statistically significant. Bar: Mean.
Figure 2.
Figure 2.. SUV39H1 expression is elevated in both colon carcinoma cells and tumor-infiltrating CTLs.
A. Data sets of SUV39H1 mRNA in human colon carcinoma (n=380) and normal colon tissues (n=51) extracted from TCGA database and plotted as a heatmap shown in the left panel. The SUV39H1 mRNA expression range is represented by red and blue color gradient as indicated at the left bottom panel. The relative mRNA expression is represented as Log2 (normalized counts+1). The SUV39H1 mRNA levels was compared between colon carcinoma and normal colon tissues and presented in the right panel. Two-tail t tests were used to determine differences in SUV39H1 mRNA expression between tumor tissues and normal colon tissues with p<0.05 as being statistically significant. Bar: Mean. B. Tumors were excised from two MC38 tumor-bearing mice and digested in a collagenase solution. Portion of the tumor cells were incubated with anti-CD45–conjugated magnetic beads to deplete leukocytes from tumor cells. Another portion of the tumor cells was incubated with anti-CD8–conjugated magnetic beads to isolated CD8+ tumor-infiltrating CTLs. RNA was prepared and analyzed by qPCR using SUV39H1-specific primers. The two open bars indicate SUV39H1 mRNA in CD8+ tumor-infiltrating CTLs from two tumor-bearing mice. The two grey filled bars represent SUV39H1 mRNA in CD45-depleted tumor cells from two tumor-bearing mice. Bottom panel: agarose gel showing the PCR-amplified Suv39h1 DNA fragment. Rpl13a was used as normalization control.
Figure 3.
Figure 3.. The effector promoter chromatin is enriched with H3K9me3 in T cells.
A. Genome-wide ChIP-Sequencing data set of human CD3+ T cells was extracted from GEO (accession #GSM 1058783). The genome regions of genes encoding T-cell effector genes GZMB, PRF1, FASLG, and IFNG were visualized using program IGV. The gene locations are indicated. The H3K9me3 peaks are presented as green bars. The green arrow indicates transcription direction. The H3K9me3 peaks in the gene promoter regions are indicated by red arrows. B. CD3+ T cells were purified from spleens of C57BL/6 mice and analyzed by ChIP with anti-H3K9me3 and gene-specific PCR primers in triplicates as indicated. The promoter structures of each gene are shown at the top panel of each bar graph. ChIP1–3 indicate the three ChIP PCR-amplified regions at the respective gene promoter. The number above the bar indicates the ChIP PCR-amplified region as defined by nucleotide locations relative to each gene transcription initiation site. The bottom bar graphs show ChIP H3K9me3. Column: Mean; Bar: SD.
Figure 4.
Figure 4.. Development of the SUV39H1-specific small molecule inhibitor F5446.
A. Scheme of F5446 development. B. Chemical synthesis procedures of F5446. The detailed procedures are described in the methods. C. F5446 chemical structure. D. F5446 was tested in a 10-dose EC50 mode with 3-fold serial dilutions using recombinant human SUV39H1 protein as the methyltransferase, S-(methyl-3H) adenosyl-L-methionine as the substrate, and Histone 3 peptide (N1–21) as the template in the presence of indicated doses of F5446. The EC50 was calculated with GraphPad 6.0 as described in the methods.
Figure 5.
Figure 5.. The SUV39H1-H3K9me3 pathway represses effector gene expression in T cells.
A. CD3+ T cells (1.5 × 10⁶ cells/well) were stimulated in a 24-well plate coated with anti-CD3 (8 μg/mL) and anti-CD28 (10 μg/mL) for 2 days in the absence or presence of F5446 (25 nM). The resting, stimulated, and F5446-treated T cells were analyzed by ChIP with anti-H3K9me3 and gene promoter-specific PCR primers in triplicates. ChIP 1–3 represents the three regions amplified by ChIP PCR at the respective gene promoter as shown in Fig. 3B. Column: Mean, Bar: SEM. B. H3K9me3 deposition at the Nxf2 locus was visualized and analyzed as in Fig. 3. C. Purified CD3+ T cells (1.5 × 10⁶ cells/well) were stimulated in a 24-well plate coated with anti-CD3 (8 μg/mL) and anti-CD28 (10 μg/mL) in the presence of F5446 at the indicated doses for 2 days. The treated T cells were then analyzed for mRNA expression of the four indicated effectors. D. Purified CD3+ T cells (1.5 × 10⁶ cells/well) were stimulated in a 24-well plate coated with anti-CD3 (8 μg/mL) and anti-CD28 (10 μg/mL) in the presence of F5446 (25 nM) for 2 days. Cells were then intracellularly stained for granzyme B, perforin, and IFNγ. Cells were also stained for cell surface FasL. Shown on the left are representative dot plots. Cells were gated as shown and quantified as the percentage of positive cells for each of the four proteins (right panel). Bar: mean. Differences in the % respective cell subsets between the indicated groups were determined by two-tail t test with p<0.05 as being statistically significant. E. The gated granzyme B- and IFNγ-positive cells, as shown in D, were further analyzed for MFI of granzyme B and IFNγ. For perforin and FasL, total cell population was analyzed for MFI of perforin and FasL. F. Purified CD3+ T cells (1.5 × 10⁶ cells/well) were stimulated in a 24-well plate coated with anti-CD3 (8 μg/mL) and anti-CD28 (10 μg/mL) in the presence of F5446 at the indicated doses for 2 days. Cells were then analyzed for perforin protein by Western blotting. β-actin was used as a normalization control.
Figure 6.
Figure 6.. F5446 increases T-cell effector gene expression to suppress colon carcinoma growth in vivo.
A. MC38 cells (1.5×10⁵ cells/mouse) were injected to thirty C57BL/6 mice subcutaneously. Twenty mice with similar sized tumors were randomly assigned into four groups (n=5/group) at day 8 after tumor cell injection. The four groups of tumor-bearing mice were treated with vehicle and IgG (control), F5446 (10 mg/kg), anti-PD-1 (200 μg/mouse), and F5446+anti-PD-1 every two days for 14 days. Shown are tumor images. B. Tumor growth rates in control and treatment groups were measured as tumor volume over time. Differences in tumor volume between control and treatment groups were analyzed statistically as described in the methods. **p<0.01. Bar: SEM. C. Mice were sacrificed at day 22 after tumor cell injection. Tumors were dissected and measured for volume (left panel) and weight (right panel). Differences in tumor volume and weight between control and treatment groups were determined by two-tail t test with p<0.05 as being statistically significant. Bar: mean. D. RNA was prepared from the tumor tissues of the control and F5446 treatment groups. RNA from three mice in each group was pooled and analyzed by qPCR in triplicates for the expression of indicated T-cell effector genes. β-actin was used as an internal normalization control. Differences in each gene expression between control and the treatment groups were determined by two-tail t test with p<0.05 as being statistically significant. Column: mean; Bar, SEM. E. CT26 cells (2×10⁵ cells/mouse) were injected to thirty BALB/c mice subcutaneously. Twenty mice with similar sized tumors were randomly assigned into four groups and treated as in A. Shown are tumor images. F. Tumor growth rates in the control and treatment groups were measured as tumor volume over time and differences in tumor volume between control and treatment groups were determined statistically as described in methods.** p<0.01. Bar: SEM. G. Mice were sacrificed at day 24 after tumor cell injection. Tumors were dissected and measured for volume (left panel) and weight (right panel). Differences in tumor volume and weight between control and treatment groups were determined by two-tail t test. Bar: mean. H. RNA was prepared from total tumor tissues of the control and F5446 treatment groups. RNA from three mice in each group was pooled and analyzed by qPCR in triplicates for the expression of the indicated T-cell effector genes. β-actin was used as an internal normalization control. Differences in each gene expression between control and the treatment groups were determined by two-tail t test with p<0.05 as being statistically significant. Column: mean; Bar, SEM.
Figure 7.
Figure 7.. The SUV39H1-H3K9me3 pathway represses T-cell effector gene expression in tumor-infiltrating CTLs in vivo.
A. MC38 cells were injected to twelve Rag1 KO mice subcutaneously. Ten mice with similar sized tumors were randomly assigned into two groups at day 8, and treated with vehicle (control, n=5) or F5446 (10 mg/kg, n=5) every two days for 14 days. Left panel shows tumor images. Tumors were excised from sacrificed mice 22 days after tumor cell injection, weighed and presented at the right panel. Each dot represents tumor weight of tumor from one mouse. Differences in tumor weights between control and the treatment groups were determined by two-tail t test with p<0.05 as being statistically significant. B. CT26 cells (2×10⁵ cells/mouse) were injected to twenty BALB/c mice subcutaneously. Fifteen mice with similar sized tumors were randomly assigned into three groups at day 10 after tumor cell injection and treated with vehicle (control, n=5), F5446 (10 mg/kg, n=5), and F5446+anti-CD8 (n=5) every two days for 14 days. Left panel shows tumor images. Tumors were excised from sacrificed mice 24 days after tumor cell injection, weighed, and presented at the right panel. Each dot represents tumor weight of tumor from one mouse. Differences in tumor weights between control and the treatment group were determined by two-tail t test with p<0.05 as being statistically significant. C. Tumor tissues were collected from the control (two independent experiments, n=5 each) and F5446-treated (two independent experiments, n=5 each) MC38 and CT26 tumor-bearing mice, respectively, digested with a collagenase solution and stained with Zombie Violet, anti-CD45 and anti-CD8. CD45+ cells were gated from live cells (Zombie Violet- cells) and were further gated for CD8+ cells. Shown are representative dot plots (left panel). The % CD8+ T cells was quantified and pooled from the two independent experiments and presented in the right panel. Each dot represents data from one mouse. Bar: mean. Differences in % CD8+ cells between control and the treatment groups were determined by two-tail t test with p<0.05 as being statistically significant. D. CD8+ CTLs were isolated from pooled tumor tissues of five CT26 tumor-bearing mice as shown in Fig. 6E and analyzed by ChIP with anti-H3K9me3 and gene-specific PCR primers in triplicates. ChIP 1–3 represents the three regions of the respective gene promoter amplified by ChIP PCR as shown in Fig. 3B. Column: mean; bar: SEM. E. CD8+ CTLs were isolated from pooled tumor tissues of five CT26 tumor-bearing mice from the control and F5446 treatment groups as shown in Fig. 6E. The isolated CTLs were then analyzed by ChIP with anti-H3K9me3 and gene-specific PCR primers in triplicates as indicated in Fig. 3B. The H3K9me3 was normalized to input. ChIP 1–3 indicates the ChIP PCR amplified three regions of the respective gene promoter as in Fig. 3B. Column: mean; Bar: SEM. F. CD8+ CTLs were isolated from pooled tumor tissues of five CT26 tumor-bearing mice from the control and F5446 treatment groups as shown in Fig. 6E. The isolated CTLs were then analyzed by ChIP with IgG and anti-H3K9me3, respectively, and nxf2 promoter-specific PCR primers in triplicates as indicated in Fig. 5B. The H3K9me3 was normalized to input. G. CD8+ CTLs were isolated from pooled tumor tissues of five CT26 tumor-bearing mice from the control and F5446 treatment groups as shown in Fig. 6E. The isolated CTLs were also analyzed by qPCR in triplicates for the expression of genes for granzyme B, perforin, FasL, and IFNγ. Differences in each gene expression between control and the treatment groups were determined by two-tail t test with p<0.05 as being statistically significant. Column: mean; Bar, SEM.

References

    1. Galon J, Costes A, Sanchez-Cabo F, Kirilovsky A, Mlecnik B, Lagorce-Pages C, et al. Type, density, and location of immune cells within human colorectal tumors predict clinical outcome. Science 2006;313:1960–4 - PubMed
    1. Galon J, Fridman WH, Pages F. The adaptive immunologic microenvironment in colorectal cancer: a novel perspective. Cancer Res 2007;67:1883–6 - PubMed
    1. Pages F, Berger A, Camus M, Sanchez-Cabo F, Costes A, Molidor R, et al. Effector memory T cells, early metastasis, and survival in colorectal cancer. N Engl J Med 2005;353:2654–66 - PubMed
    1. Camus M, Tosolini M, Mlecnik B, Pages F, Kirilovsky A, Berger A, et al. Coordination of intratumoral immune reaction and human colorectal cancer recurrence. Cancer Res 2009;69:2685–93 - PubMed
    1. Kroemer G, Galluzzi L, Zitvogel L, Fridman WH. Colorectal cancer: the first neoplasia found to be under immunosurveillance and the last one to respond to immunotherapy? Oncoimmunology 2015;4:e1058597. - PMC - PubMed

Publication types

MeSH terms