

Effects of Absolute Humidity, Relative Humidity, Temperature, and Wind Speed on Influenza Activity in Toronto, Ontario, Canada
- PMID: 30610079
- PMCID: PMC6414376
- DOI: 10.1128/AEM.02426-18
Effects of Absolute Humidity, Relative Humidity, Temperature, and Wind Speed on Influenza Activity in Toronto, Ontario, Canada
Abstract
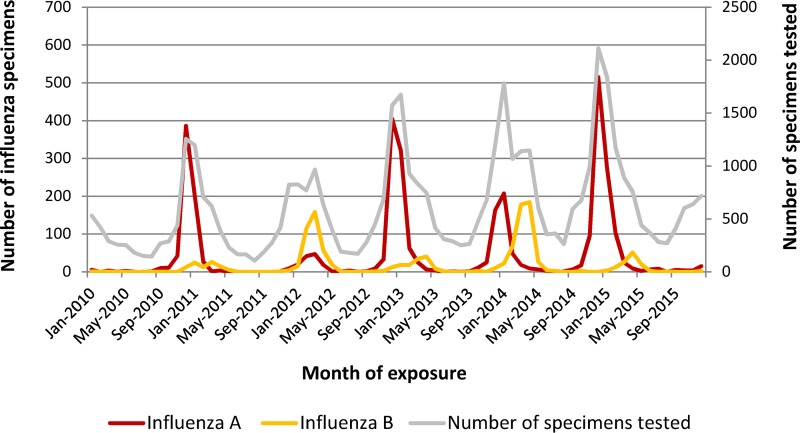
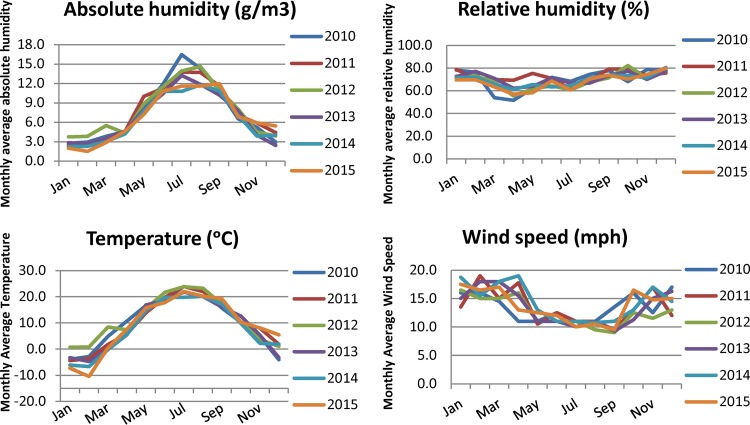
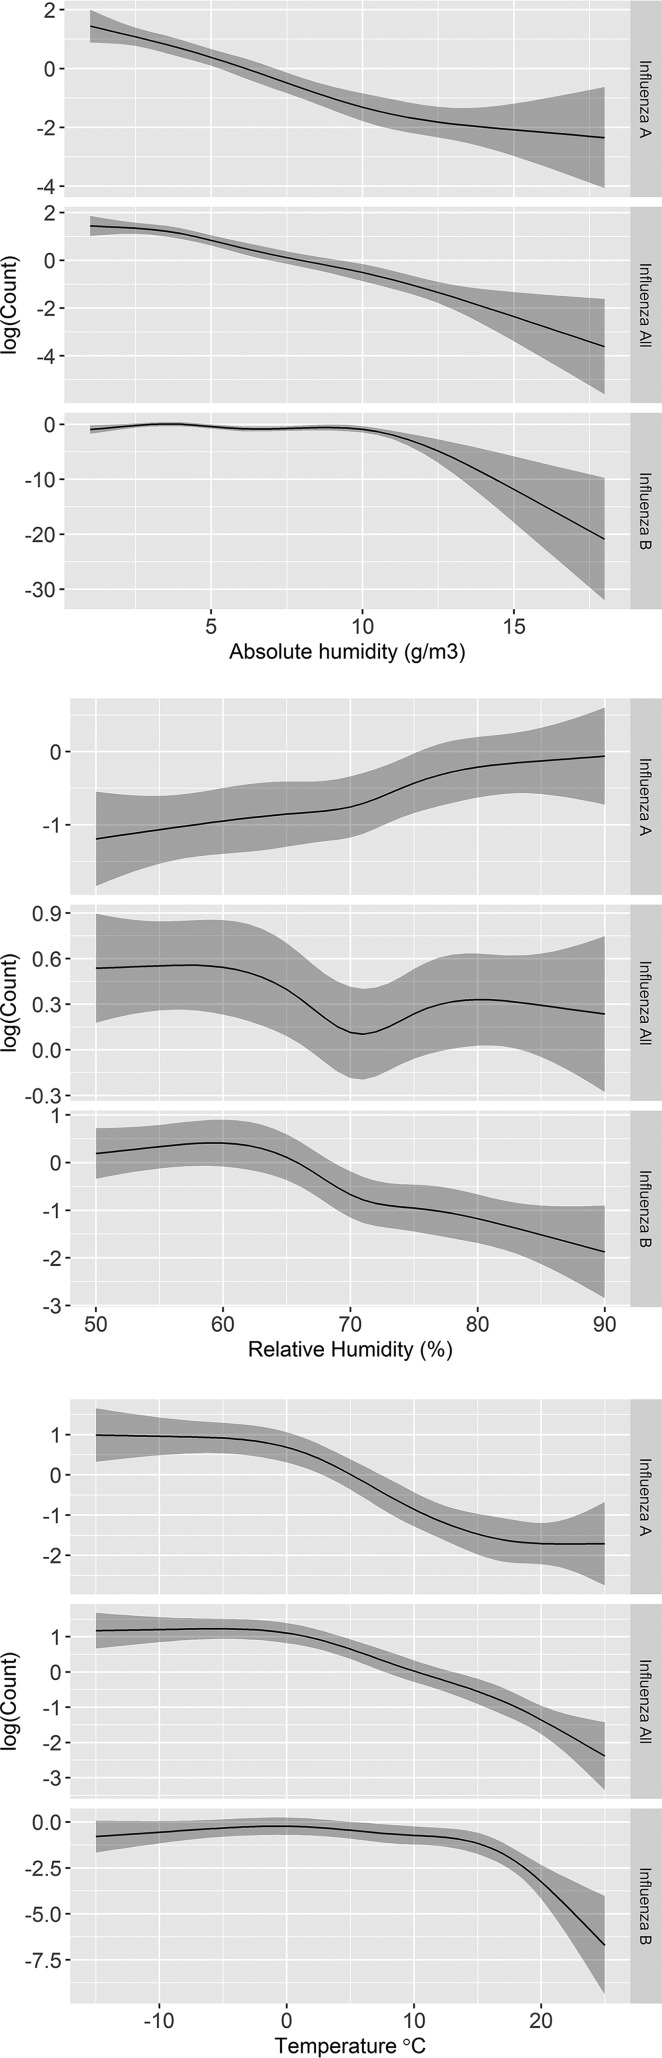
The occurrence of influenza in different climates has been shown to be associated with multiple meteorological factors. The incidence of influenza has been reported to increase during rainy seasons in tropical climates and during the dry, cold months of winter in temperate climates. This study was designed to explore the role of absolute humidity (AH), relative humidity (RH), temperature, and wind speed (WS) on influenza activity in the Toronto, ON, Canada, area. Environmental data obtained from four meteorological stations in the Toronto area over the period from 1 January 2010 to 31 December 2015 were linked to patient influenza data obtained for the same locality and period. Data were analyzed using correlation, negative binomial regressions with linear predictors, and splines to capture the nonlinear relationship between exposure and outcomes. Our study found a negative association of both AH and temperature with influenza A and B virus infections. The effect of RH on influenza A and B viruses was controversial. Temperature fluctuation was associated with increased numbers of influenza B virus infections. Influenza virus was less likely to be detected from community patients than from patients tested as part of an institutional outbreak investigation. This could be more indicative of nosocomial transmission rather than climactic factors. The nonlinear nature of the relationship of influenza A virus with temperature and of influenza B virus with AH, RH, and temperature could explain the complexity and variation between influenza A and B virus infections. Predicting influenza activity is important for the timing of implementation of disease prevention and control measures as well as for resource allocation.IMPORTANCE This study examined the relationship between environmental factors and the occurrence of influenza in general. Since the seasonality of influenza A and B viruses is different in most temperate climates, we also examined each influenza virus separately. This study reports a negative association of both absolute humidity and temperature with influenza A and B viruses and tries to understand the controversial effect of RH on influenza A and B viruses. This study reports a nonlinear relation between influenza A and B viruses with temperature and influenza B virus with absolute and relative humidity. The nonlinear nature of these relations could explain the complexity and difference in seasonality between influenza A and B viruses, with the latter predominating later in the season. Separating community-based specimens from those obtained during outbreaks was also a novel approach in this research. These findings provide a further understanding of influenza virus transmission in temperate climates.
Keywords: absolute humidity; environmental factors; influenza; relative humidity; temperature; wind speed.
Copyright © 2019 Peci et al.
Figures
Similar articles
-
Absolute humidity modulates influenza survival, transmission, and seasonality.Proc Natl Acad Sci U S A. 2009 Mar 3;106(9):3243-8. doi: 10.1073/pnas.0806852106. Epub 2009 Feb 9. Proc Natl Acad Sci U S A. 2009. PMID: 19204283 Free PMC article.
-
Indoor relative humidity shapes influenza seasonality in temperate and subtropical climates in China.Int J Infect Dis. 2023 Jan;126:54-63. doi: 10.1016/j.ijid.2022.11.023. Epub 2022 Nov 22. Int J Infect Dis. 2023. PMID: 36427703
-
Influence of meteorological parameters in the seasonality of influenza viruses circulating in Northern Cameroon.Influenza Other Respir Viruses. 2019 Mar;13(2):158-165. doi: 10.1111/irv.12612. Epub 2018 Dec 17. Influenza Other Respir Viruses. 2019. PMID: 30220100 Free PMC article.
-
Humidity and respiratory virus transmission in tropical and temperate settings.Epidemiol Infect. 2015 Apr;143(6):1110-8. doi: 10.1017/S0950268814002702. Epub 2014 Oct 13. Epidemiol Infect. 2015. PMID: 25307020 Free PMC article. Review.
-
Environmental role in influenza virus outbreaks.Annu Rev Anim Biosci. 2015;3:347-73. doi: 10.1146/annurev-animal-022114-111017. Epub 2014 Nov 12. Annu Rev Anim Biosci. 2015. PMID: 25422855 Review.
Cited by
-
Deep-Learning Model for Influenza Prediction From Multisource Heterogeneous Data in a Megacity: Model Development and Evaluation.J Med Internet Res. 2023 Feb 13;25:e44238. doi: 10.2196/44238. J Med Internet Res. 2023. PMID: 36780207 Free PMC article.
-
Was the Reduction in Seasonal Influenza Transmission during 2020 Attributable to Non-Pharmaceutical Interventions to Contain Coronavirus Disease 2019 (COVID-19) in Japan?Viruses. 2022 Jun 28;14(7):1417. doi: 10.3390/v14071417. Viruses. 2022. PMID: 35891397 Free PMC article.
-
The role of meteorological factors on mumps incidence among children in Guangzhou, Southern China.PLoS One. 2020 Apr 29;15(4):e0232273. doi: 10.1371/journal.pone.0232273. eCollection 2020. PLoS One. 2020. PMID: 32348370 Free PMC article.
-
Winter Is Coming: A Southern Hemisphere Perspective of the Environmental Drivers of SARS-CoV-2 and the Potential Seasonality of COVID-19.Int J Environ Res Public Health. 2020 Aug 5;17(16):5634. doi: 10.3390/ijerph17165634. Int J Environ Res Public Health. 2020. PMID: 32764257 Free PMC article. Review.
-
Research and effectiveness of anti-viral drugs against COVID-19; global public intervention to prevent coronavirus and to improve human health.Saudi J Biol Sci. 2021 Jul;28(7):4082-4088. doi: 10.1016/j.sjbs.2021.04.031. Epub 2021 Apr 20. Saudi J Biol Sci. 2021. PMID: 33897263 Free PMC article. Review.
References
MeSH terms
LinkOut - more resources
Full Text Sources
Medical
Miscellaneous
