. 2019 Jan 28;92(5):e418-e428.
doi: 10.1212/WNL.0000000000006850.

Diagnostic yield of genetic tests in epilepsy: A meta-analysis and cost-effectiveness study

Affiliations

Diagnostic yield of genetic tests in epilepsy: A meta-analysis and cost-effectiveness study

Iván Sánchez Fernández et al. Neurology. .

Abstract

Objective: To compare the cost-effectiveness of genetic testing strategies in patients with epilepsy of unknown etiology.

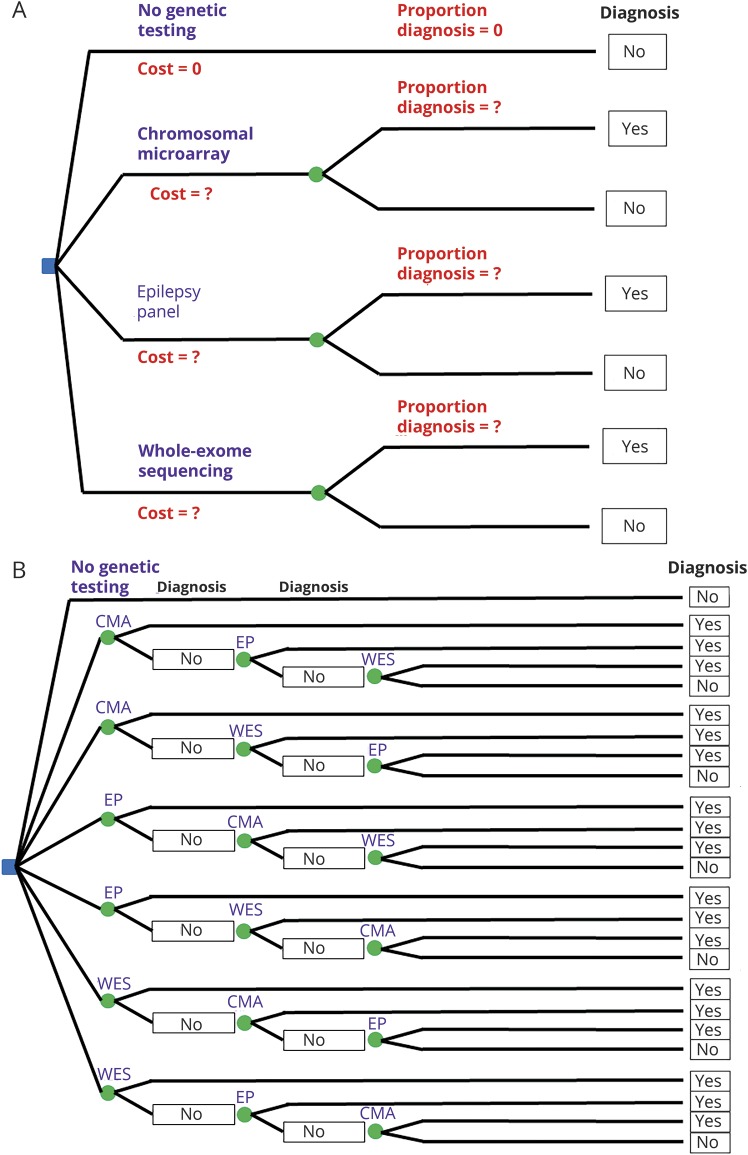
Methods: This meta-analysis and cost-effectiveness study compared strategies involving 3 genetic tests: chromosomal microarray (CMA), epilepsy panel (EP) with deletion/duplication testing, and whole-exome sequencing (WES) in a cost-effectiveness model, using "no genetic testing" as a point of comparison.

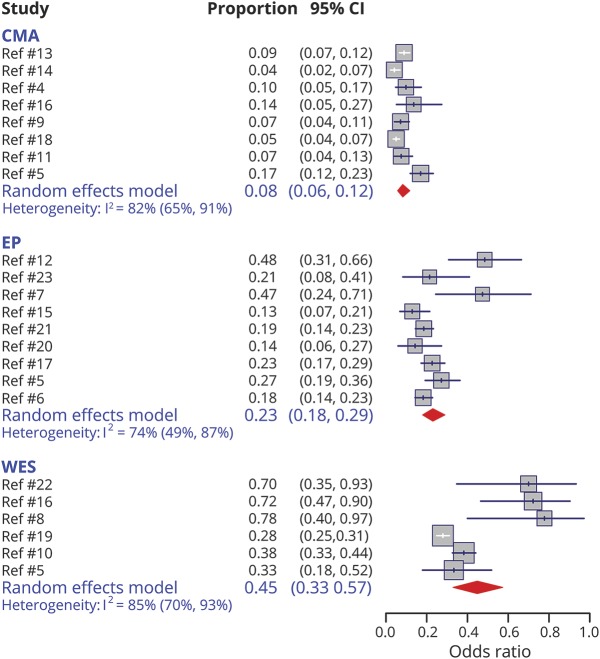
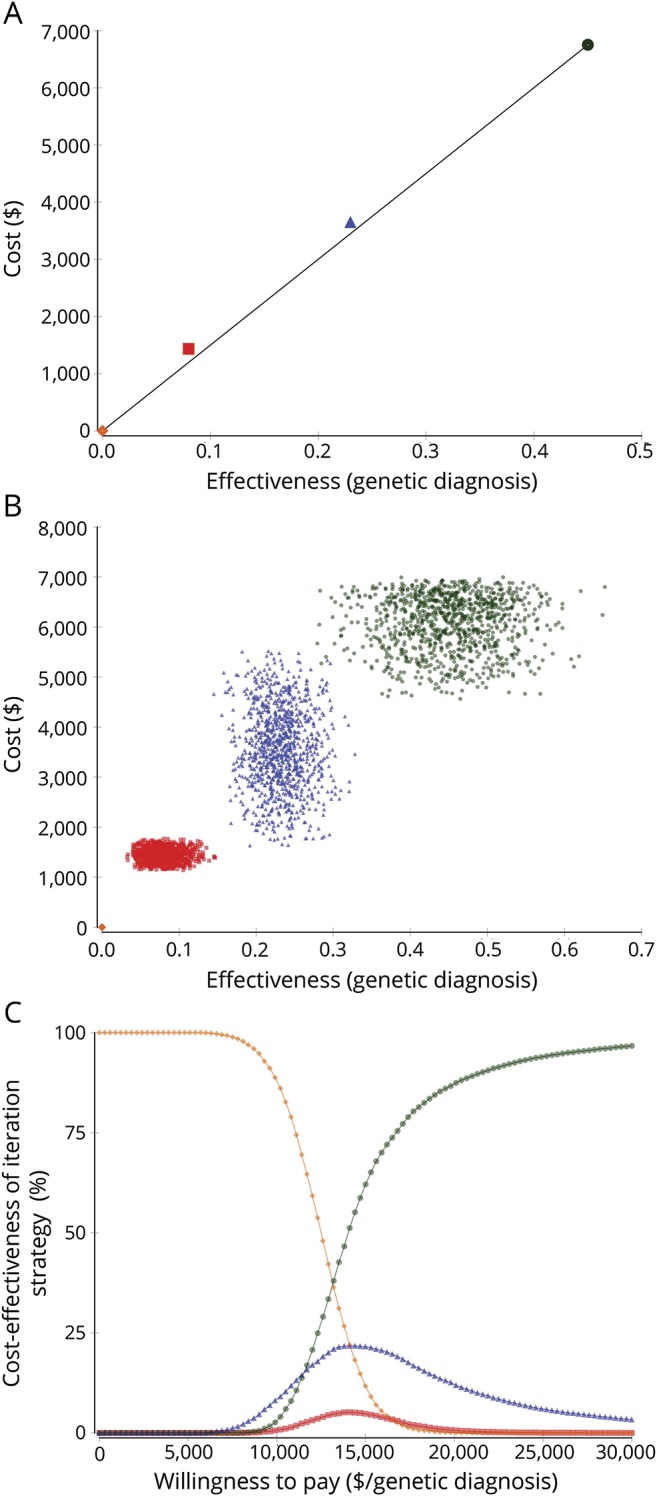
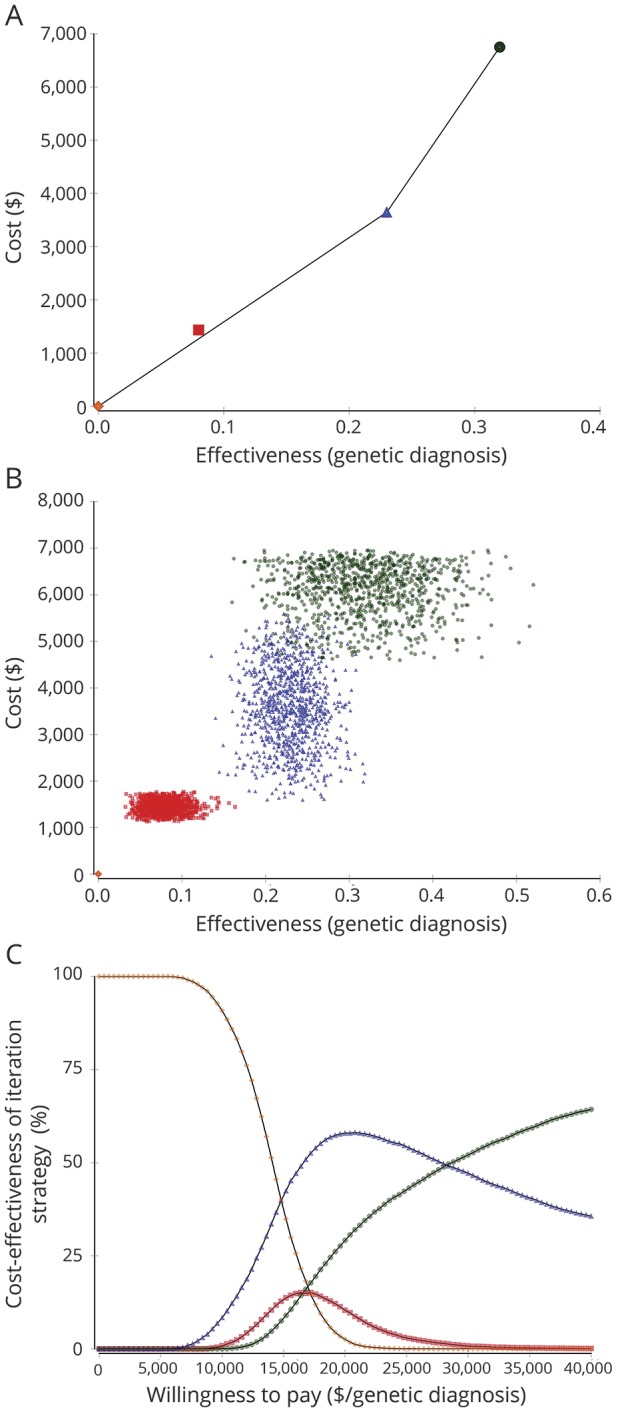
Results: Twenty studies provided information on the diagnostic yield of CMA (8 studies), EP (9 studies), and WES (6 studies). The diagnostic yield was highest for WES: 0.45 (95% confidence interval [CI]: 0.33-0.57) (0.32 [95% CI: 0.22-0.44] adjusting for potential publication bias), followed by EP: 0.23 (95% CI: 0.18-0.29), and CMA: 0.08 (95% CI: 0.06-0.12). The most cost-effective test was WES with an incremental cost-effectiveness ratio (ICER) of $15,000/diagnosis. However, after adjusting for potential publication bias, the most cost-effective test was EP (ICER: $15,848/diagnosis) followed by WES (ICER: $34,500/diagnosis). Among combination strategies, the most cost-effective strategy was WES, then if nondiagnostic, EP, then if nondiagnostic, CMA (ICER: $15,336/diagnosis), although adjusting for potential publication bias, the most cost-effective strategy was EP ± CMA ± WES (ICER: $18,385/diagnosis). While the cost-effectiveness of individual tests and testing strategies overlapped, CMA was consistently less cost-effective than WES and EP.

Conclusion: WES and EP are the most cost-effective genetic tests for epilepsy. Our analyses support, for a broad population of patients with unexplained epilepsy, starting with these tests. Although less expensive, CMA has lower yield, and its use as the first-tier test is thus not supported from a cost-effectiveness perspective.


Figures

Figure 1
Figure 1. Decision trees for the comparison of individual tests (A) and of testing strategies (B)
(A) A patient with epilepsy of unknown etiology and no features suggestive of any particular genetic etiology can choose 4 individual tests: no genetic testing, CMA, EP, and WES. (B) A patient with epilepsy of unknown etiology and no features suggestive of any particular genetic etiology can choose 7 testing strategies: no genetic testing, CMA ± EP ± WES, CMA ± WES ± EP, EP ± CMA ± WES, EP ± WES ± CMA, WES ± CMA ± EP, and WES ± EP ± CMA. CMA = chromosomal microarray; EP = epilepsy panel; WES = whole-exome sequencing.
Figure 2
Figure 2. Meta-analysis of the diagnostic yield of the different genetic tests
CI = confidence interval; CMA = chromosomal microarray; EP = epilepsy panel; WES = whole-exome sequencing.
Figure 3
Figure 3. Comparison of individual tests: No genetic testing (orange diamond), CMA (red square), EP (blue triangle), and WES (green circle)
(A) Base case analysis. The x-axis measures effectiveness as diagnostic yield and the y-axis measures cost in US dollars. The most desirable genetic tests would have a high effectiveness (and would be close to 1 in the x-axis) and a low cost (and would be close to 0 in the y-axis). To compare cost-effectiveness, the competing options are compared based on the ICER. To calculate the ICER, the incremental (compared to the next most cost-effective strategy) cost of a strategy is divided by the incremental (compared to the next most cost-effective strategy) effectiveness., In cost-effectiveness, a lower ICER marks a more cost-effective option because that genetic test diagnoses more patients per dollar spent. The black line that links the most cost-effective strategies marks the efficiency frontier. Genetic tests above this line are less cost-effective than the alternatives in the line because they are less effective, more costly, more costly and less effective, or their increase in cost per unit of effectiveness (their ICER) is higher than the ICER of other strategies. Therefore, WES is the most cost-effective strategy. EP and CMA are slightly above the efficiency frontier. (B) Probabilistic sensitivity analysis (second-order Monte Carlo simulations). CMA, EP, and WES markedly overlap in cost-effectiveness. There is no possible efficiency frontier that leaves any strategy clearly above it. (C) Acceptability curve. The willingness to pay (in the x-axis) measures how many dollars a payer (a patient in this analysis) is willing to pay per a genetic diagnosis of epilepsy. The percentage of second-order Monte Carlo simulations where a particular option is the most cost-effective strategy is in the y-axis. For a willingness to pay of less than approximately $13,500/diagnosis, there is not enough money for any genetic test in most simulations. For a willingness to pay above approximately $13,500/diagnosis, WES is the most cost-effective strategy in most simulations. EP can be the most cost-effective alternative in some simulations between $10,000 and $20,000, while CMA is rarely the most cost-effective alternative. CMA = chromosomal microarray; EP = epilepsy panel; ICER = incremental cost-effectiveness ratio; WES = whole-exome sequencing.
Figure 4
Figure 4. Comparison of individual tests: No genetic testing (orange diamond), CMA (red square), EP (blue triangle), and WES (green circle) adjusting for potential publication bias
(A) Base case analysis. EP is the most cost-effective option followed by WES. CMA is slightly above the efficiency frontier. (B) Probabilistic sensitivity analysis (second-order Monte Carlo simulations). CMA, EP, and WES markedly overlap in cost-effectiveness. There is no possible efficiency frontier that leaves any strategy clearly above it. (C) Acceptability curve. For a willingness to pay of less than approximately $15,200/diagnosis, in most simulations, there is not enough money for any genetic test. For a willingness to pay between approximately $15,200/diagnosis and $28,400/diagnosis, in most simulations, EP is the most cost-effective strategy. For a willingness to pay above $28,400/diagnosis, WES is the most cost-effective option. CMA = chromosomal microarray; EP = epilepsy panel; WES = whole-exome sequencing.

Comment in

References

    1. Forsgren L, Beghi E, Oun A, Sillanpaa M. The epidemiology of epilepsy in Europe: a systematic review. Eur J Neurol 2005;12:245–253. - PubMed
    1. Hauser WA, Annegers JF, Rocca WA. Descriptive epidemiology of epilepsy: contributions of population-based studies from Rochester, Minnesota. Mayo Clin Proc 1996;71:576–586. - PubMed
    1. Thomas RH, Berkovic SF. The hidden genetics of epilepsy: a clinically important new paradigm. Nat Rev Neurol 2014;10:283–292. - PubMed
    1. Bartnik M, Szczepanik E, Derwinska K, et al. Application of array comparative genomic hybridization in 102 patients with epilepsy and additional neurodevelopmental disorders. Am J Med Genet B Neuropsychiatr Genet 2012;159B:760–771. - PubMed
    1. Berg AT, Coryell J, Saneto RP, et al. Early-life epilepsies and the emerging role of genetic testing. JAMA Pediatr 2017;171:863–871. - PMC - PubMed