. 2019 Jan 25:11:160-177.
doi: 10.1016/j.isci.2018.12.015. Epub 2018 Dec 20.

The Phosphoinositide Kinase PIKfyve Promotes Cathepsin-S-Mediated Major Histocompatibility Complex Class II Antigen Presentation

Affiliations

The Phosphoinositide Kinase PIKfyve Promotes Cathepsin-S-Mediated Major Histocompatibility Complex Class II Antigen Presentation

Maksim V Baranov et al. iScience. .

Abstract

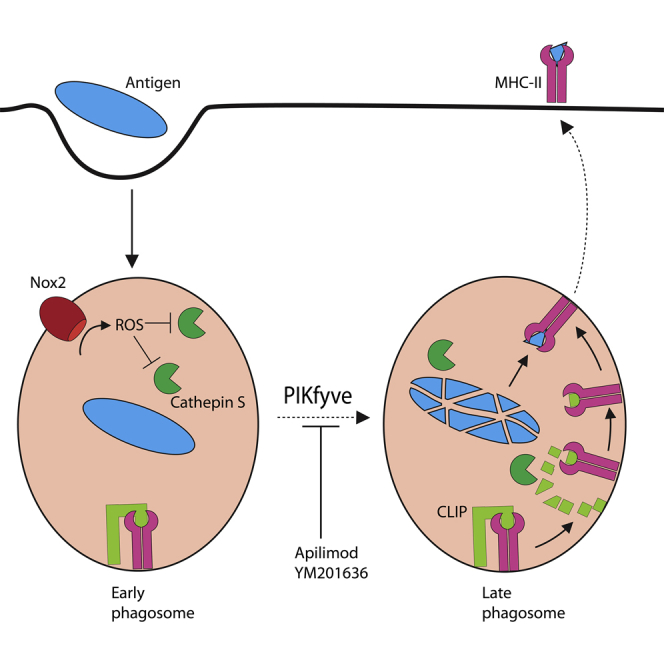
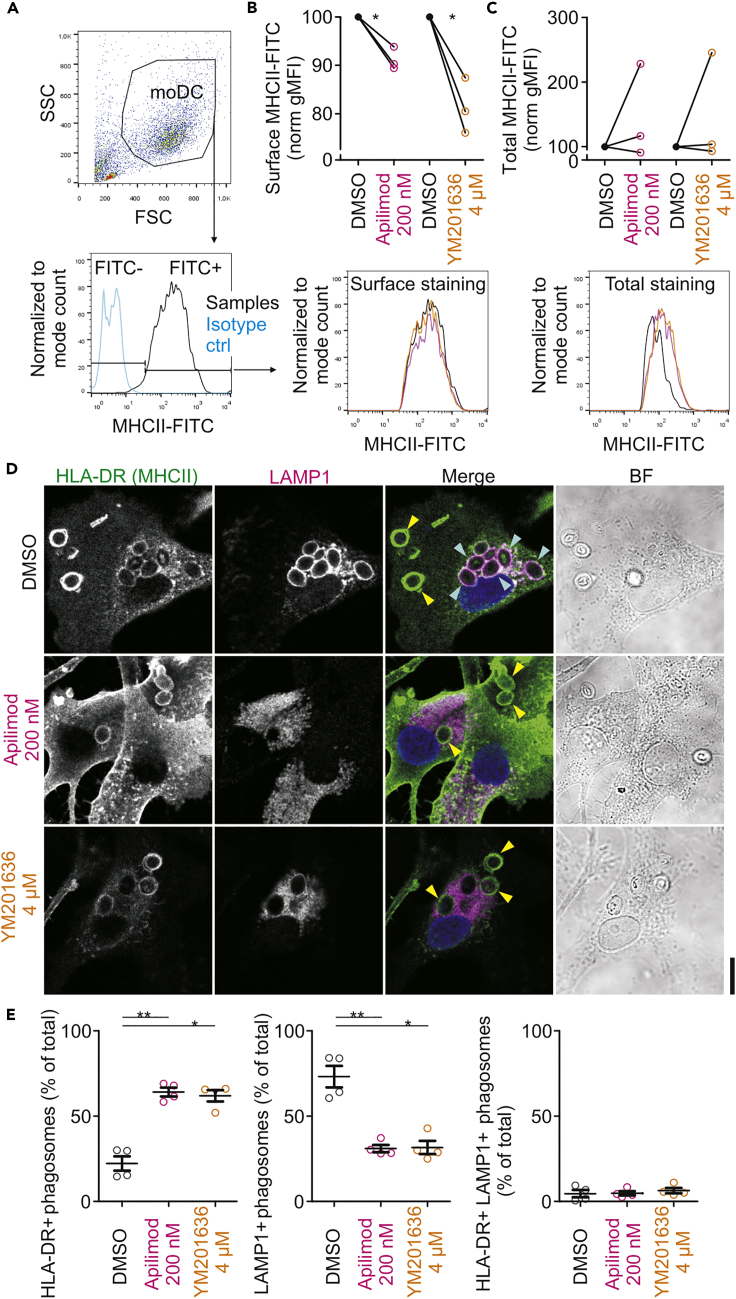
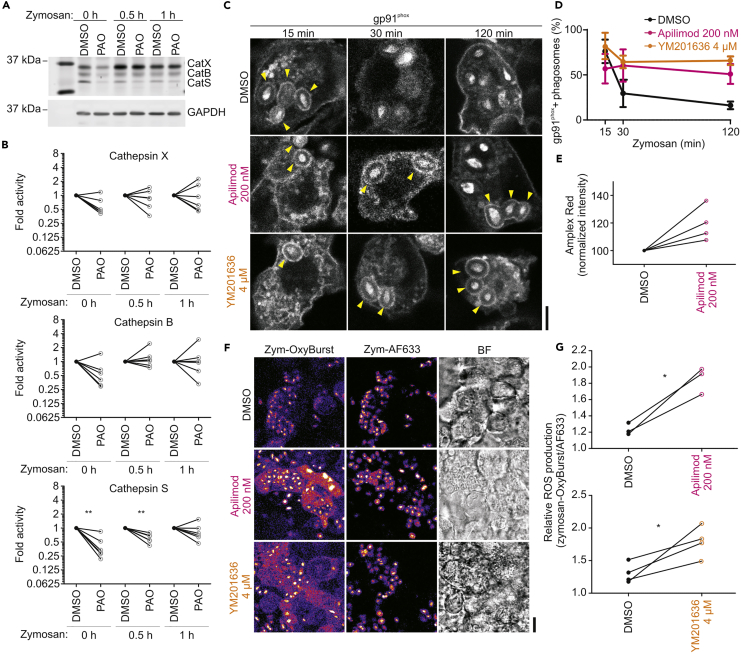
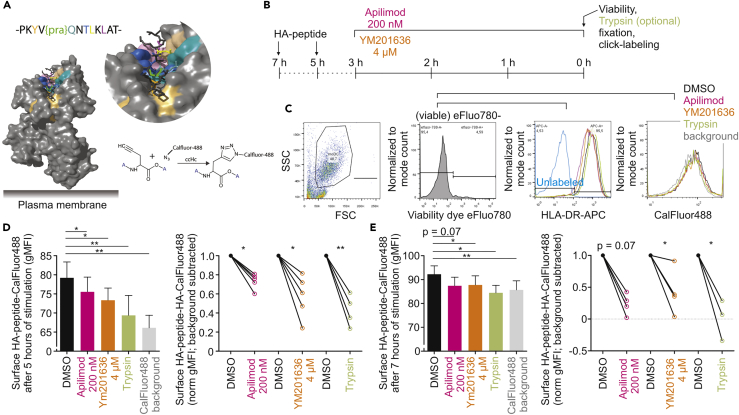
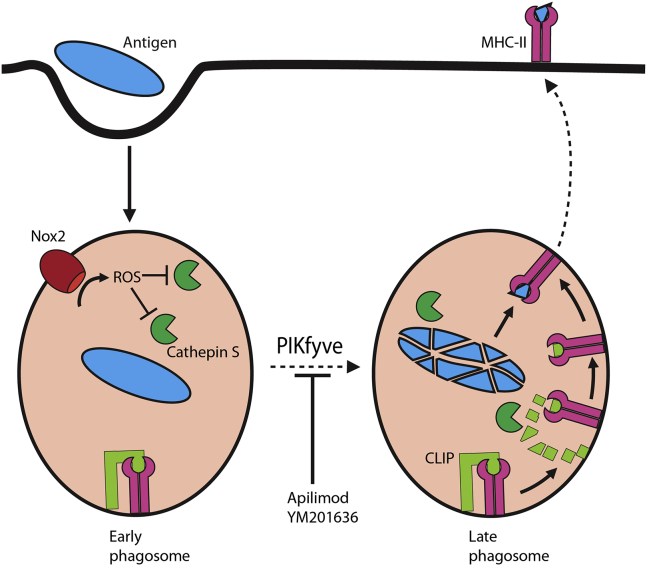
Antigen presentation to T cells in major histocompatibility complex class II (MHC class II) requires the conversion of early endo/phagosomes into lysosomes by a process called maturation. Maturation is driven by the phosphoinositide kinase PIKfyve. Blocking PIKfyve activity by small molecule inhibitors caused a delay in the conversion of phagosomes into lysosomes and in phagosomal acidification, whereas production of reactive oxygen species (ROS) increased. Elevated ROS resulted in reduced activity of cathepsin S and B, but not X, causing a proteolytic defect of MHC class II chaperone invariant chain Ii processing. We developed a novel universal MHC class II presentation assay based on a bio-orthogonal "clickable" antigen and showed that MHC class II presentation was disrupted by the inhibition of PIKfyve, which in turn resulted in reduced activation of CD4+ T cells. Our results demonstrate a key role of PIKfyve in the processing and presentation of antigens, which should be taken into consideration when targeting PIKfyve in autoimmune disease and cancer.

Keywords: Immune Response; Immunology; Molecular Mechanism of Gene Regulation.


Figures

None
Graphical abstract
Figure 1
Figure 1
PIKfyve Is Present Early during Phagosomal Maturation (A) Live cell imaging of a human monocyte-derived dendritic cell overexpressing human PIKfyve-GFP (green in merge) together with the F-actin-binding probe RFP-LifeAct (red) and pulsed with IgG-opsonized zymosan particles. The insets show snapshots at the indicated time points. Yellow arrowheads, time series of phagosome. See also Video S1. BF, brightfield. (B) Same as (A), but now with PIKfyve-GFP (green) and LAMP1-RFP (red). See also Video S2. (C) Confocal micrograph of representative zymosan-pulsed (1 hr) dendritic cell overexpressing PIKfyve-GFP (yellow in merge) with immunostaining for EEA1 (green) and LAMP1 (magenta). Yellow arrowheads, PIKfyve-GFP and EEA1 double-positive phagosomes. (D) Quantification of (C) (∼150 phagosomes per donor; three donors). Scale bars, 10 μm. See also Figure S1.
Figure 2
Figure 2
PIKfyve Controls Phagosomal Maturation (A) Confocal images of representative dendritic cells treated with apilimod (200 nM) or YM201636 (4 μM) for 3 hr and pulsed with zymosan 1 hr before fixation. DMSO, vehicle control. Cells were immunolabeled for LAMP1 (magenta in merge). Blue, DAPI staining. BF, brightfield. (B) Quantification of (A) normalized to the total number of phagosomes per cell (∼150 phagosomes per condition per donor; mean ± SEM of three donors for EEA1 and six donors for LAMP1). (C) Epifluorescence microscopy of representative dendritic cells expressing GFP-tagged phosphoinositide-probe for PI(3)P based on PX domain of NCF4 (PI(3)P; green in merge) and immunolabeled for LAMP1 (magenta). The cells were treated as in (A). Yellow arrowheads, PI(3)P-positive phagosomes; cyan arrowheads, LAMP1-positive phagosomes. (D) Quantification of (C) normalized to the total number of phagosomes per cell (∼116 phagosomes per condition per donor; mean ± SEM of three donors). (E) Confocal imaging of dendritic cells treated with DMSO, apilimod, or YM201636 for 3 hr before addition of pHRodo-labeled zymosan 1 hr before live imaging. The color intensity of pHRodo (magenta) scales with acidic pH. Cyan in merge, Hoechst. (F) Quantification of (E); MFI, mean fluorescence intensity (mean ± SEM for three donors, ∼1,000 phagosomes per condition per donor). (G) Same as (F), but now with siPIKfyve (∼400 phagosomes per condition per donor; see also Figure S1M for knockdown levels). Scale bars: 10 μm. P < 0.05, ∗∗P < 0.01, ∗∗∗P < 0.001. See also Figure S1.
Figure 3
Figure 3
Pharmacological Inhibition of PIKfyve Blocks Cathepsin S Activity and Trafficking (A) SDS-PAGE with in-gel fluorescence of the BMV109-Cy5 activity-based probe labeling cathepsin X (CatX; top band), cathepsin B (CatB; middle band), and cathepsin S (CatS; lower band) in resting dendritic cells (0 hr) or after stimulation with zymosan for 0.5 or 1 hr. Cells were treated with DMSO (vehicle control), apilimod, or YM201636 for 3 hr before lysis according to the left-hand scheme. GAPDH, loading control by western blot. Only part of the SDS PAGE/ polyvinylidene fluoride blot is shown; the rest of the image carried no information. (B and C) Quantification of (A) (individual donors shown; normalized to DMSO controls). (D) Confocal images of representative dendritic cells treated with PIKfyve inhibitors and stimulated with zymosan as in (A) before fixation and staining for CatS (red in merge). Yellow arrowheads, CatS-positive phagosomes. Scale bar, 10 μm. (E) Quantification of (D) for cells stimulated with zymosan for 0.5 or 1 hr (>133 phagosomes per condition per donor; mean ± SEM of three donors; individual donors shown; normalized to the total number of phagosomes per cell). P < 0.05, ∗∗P < 0.01, ∗∗∗P < 0.001. See also Figures S2 and S3.
Figure 4
Figure 4
Pharmacological Inhibition of PIKfyve Impairs Proteolytic Activation and Trafficking of MHC Class II (A) Gating strategy for flow cytometry of human-monocyte-derived dendritic cells immunolabeled for MHC class II (MHCII-FITC; HLA-DR, DQ). Light blue in histogram, isotype control; SSC, side scatter; FSC, forward scatter; FITC, fluorescein isothiocyanate. (B) Representative histograms and quantification of surface MHC class II with flow cytometry experiments of dendritic cells treated for 3 hr with apilimod (200 nM) or YM201636 (4 μM) (geometric mean fluorescence intensities [gMFI]; individual donors shown; normalized to DMSO control). (C) Same as (B), but now for total MHC class II with detergent permeabilization. (D) Confocal images of representative dendritic cells treated with apilimod (200 nM) or YM201636 (4 μM) for 3 hr and pulsed with zymosan 1 hr before fixation. DMSO, vehicle control. Cells were immunolabeled for HLA-DR (green in merge) and LAMP1 (magenta in merge). Blue, DAPI staining. BF, brightfield. Scale bar, 10 μm. Yellow arrowheads, HLA-DR-positive phagosomes; cyan arrowheads, LAMP1-positive phagosomes. (E) Quantification of percentages of HLA-DR-positive and LAMP1-positive phagosomes from (D) normalized to the total number of phagosomes per cell (∼280 phagosomes per condition per donor; mean ± SEM of four donors). P < 0.05, ∗∗P < 0.01, ∗∗∗P < 0.001. See also Figures S4–S6.
Figure 5
Figure 5
Pharmacological Inhibition of PIKfyve Promotes NOX2-Mediated ROS Production (A) SDS-PAGE with in-gel fluorescence for the cathepsin-activity-based probe BMV109-Cy5 for dendritic cells pulsed with zymosan for 0.5 or 1 hr and untreated (0 hr). PAO, cysteine-modifying agent phenylarsine oxide; DMSO, vehicle control; GAPDH, loading control by western blot. (B) Quantification of (A) (individual donors shown; normalized to DMSO controls). (C) Confocal images of representative dendritic cells pulsed with zymosan for 15, 30, or 120 min in the presence of apilimod (200 nM) or YM201636 (4 μM) for 3 hr and immunostained for gp91phox. Yellow arrowheads, gp91phox-positive phagosomes. Scale bar, 5 μm. (D) Quantification of (C); Gp91phox-positive phagosomes were counted and normalized to the total number of phagosomes per cell (mean ± SEM for three donors, ∼300 phagosomes per condition). (E) Extracellular H2O2 measurements with Amplex Red assay for dendritic cells treated for 3 hr with apilimod and 1 hr with zymosan. (F and G) Phagosomal ROS production determined with zymosan labeled to both OxyBURST and Alexa Fluor 633 (AF633) and confocal live imaging. Cells were treated for 3 hr with apilimod (F) or YM201636 (G) and incubated for 1 hr with zymosan-OxyBURST/AF633. Signals from OxyBURST signal were normalized to that of AF633 (∼3,000 phagosomes per condition; individual donors shown). P < 0.05, ∗∗P < 0.01, ∗∗∗P < 0.001.
Figure 6
Figure 6
PIKfyve Inhibition Impairs MHC Class II Presentation (A) Crystal structure of human HLA-DR1 (DRA, DRB1*0101; PDB: 1DLH) in complex with a virus HA (strain A/Aichi/2/1968 H3N2) peptide residues 322–334. The position of a clickable non-naturalized amino acid L-C-propargylglycine {pra} for bio-orthogonal labeling with CalFluor-488 is indicated (bright green); pockets for peptide binding at the HLA-DR1 cleft are highlighted in different colors. A scheme of the bio-orthogonal reaction is also shown. (B) Time line of stimulation with HA peptide residues 318–338 for MHC class II presentation by human dendritic cells. (C) Flow cytometry gating strategy for quantification of HLA-DR1 presented HA by labeling with CalFluor-488 as depicted in (A and B). Cell viability was assessed with fixable viability dye eFluo780. Surface levels of HLA-DR1 were assessed with HLA-DR-APC. (D) Quantification of HA-CalFluor-488 signals from (C) after 5 hr of stimulation with HA-peptide (bar graphs). Gray, non-specific background from CalFluor labeling of dendritic cells that were not incubated with HA-peptide; green, trypsin-positive control for HA removal from the cell surface; line graphs, individual donors with background subtracted and normalized to DMSO control. (E) The same as (D), but now for 7 hr of stimulation with HA peptide. P < 0.05, ∗∗P < 0.01, ∗∗∗P < 0.001. See also Figures S7 and S8 and Table S1.
Figure 7
Figure 7
Delayed Phagosomal Maturation Results in a Reduced MHC Class II Antigen Presentation Model figure showing antigen uptake by a dendritic cell and subsequent processing within phagosomes by ROS and cathepsins. Upon phagosomal maturation, MHC class II bound to Ii is trafficked to the phagosome where cathepsin S is involved in the processing of Ii to CLIP, which can then be exchanged by an antigen to be presented by MHC class II on the cell surface. Inhibiting PIKfyve delays phagosomal maturation, and due to prolonged ROS formation, cathepsin S becomes oxidized and deactivated, thereby blocking CLIP-to-antigen exchange and eventually resulting in impaired antigen presentation.

References

    1. Allan E.R., Tailor P., Balce D.R., Pirzadeh P., McKenna N.T., Renaux B., Warren A.L., Jirik F.R., Yates R.M. NADPH oxidase modifies patterns of MHC class II-restricted epitopic repertoires through redox control of antigen processing. J. Immunol. 2014;192:4989–5001. - PubMed
    1. Amigorena S., Drake J.R., Webster P., Mellman I. Transient accumulation of new class II MHC molecules in a novel endocytic compartment in B lymphocytes. Nature. 1994;369:113–120. - PubMed
    1. Amigorena S., Webster P., Drake J., Newcomb J., Cresswell P., Mellman I. Invariant chain cleavage and peptide loading in major histocompatibility complex class II vesicles. J. Exp. Med. 1995;181:1729–1741. - PMC - PubMed
    1. Anderson K.E., Chessa T.A., Davidson K., Henderson R.B., Walker S., Tolmachova T., Grys K., Rausch O., Seabra M.C., Tybulewicz V.L. PtdIns3P and Rac direct the assembly of the NADPH oxidase on a novel, pre-phagosomal compartment during FcR-mediated phagocytosis in primary mouse neutrophils. Blood. 2010;116:4978–4989. - PMC - PubMed
    1. Bakkum T., van Leeuwen T., Sarris A.J.C., van Elsland D.M., Poulcharidis D., Overkleeft H.S., van Kasteren S.I. Quantification of bioorthogonal stability in immune phagocytes using flow cytometry reveals rapid degradation of strained alkynes. ACS Chem. Biol. 2018;13:1173–1179. - PMC - PubMed