. 2019 Apr;15(4):707-725.
doi: 10.1080/15548627.2018.1557835. Epub 2019 Jan 6.

Vitamin D3 activates the autolysosomal degradation function against Helicobacter pylori through the PDIA3 receptor in gastric epithelial cells

Affiliations

Vitamin D3 activates the autolysosomal degradation function against Helicobacter pylori through the PDIA3 receptor in gastric epithelial cells

Wei Hu et al. Autophagy. 2019 Apr.

Abstract

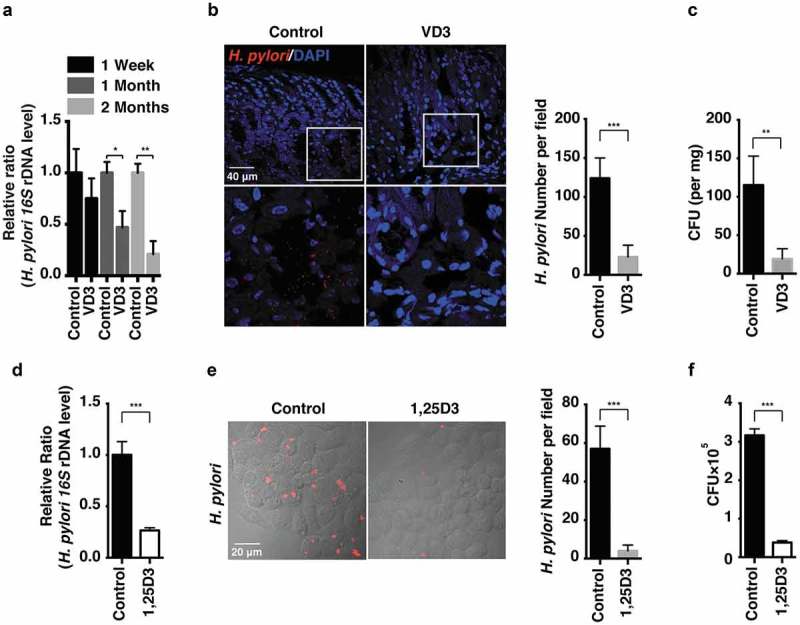
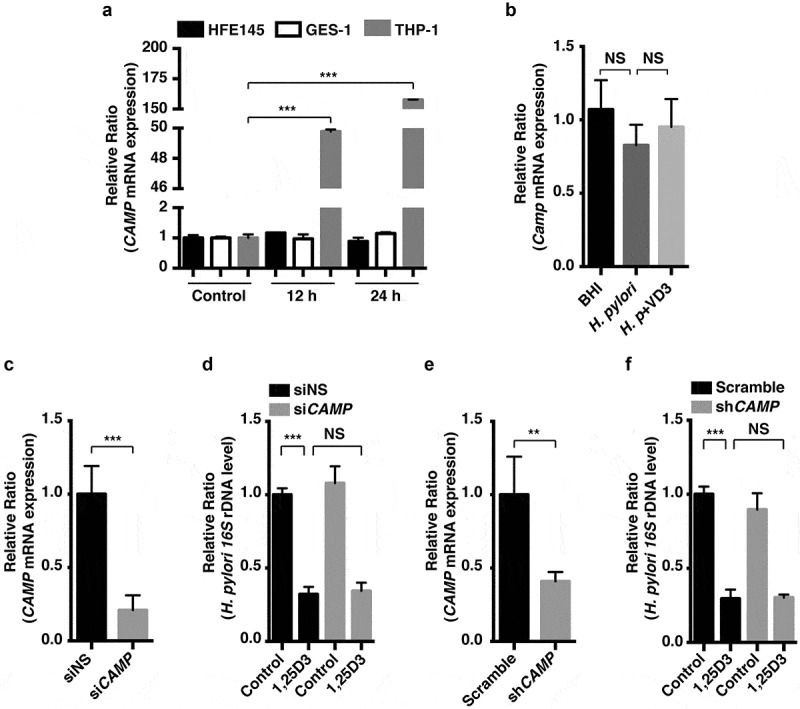
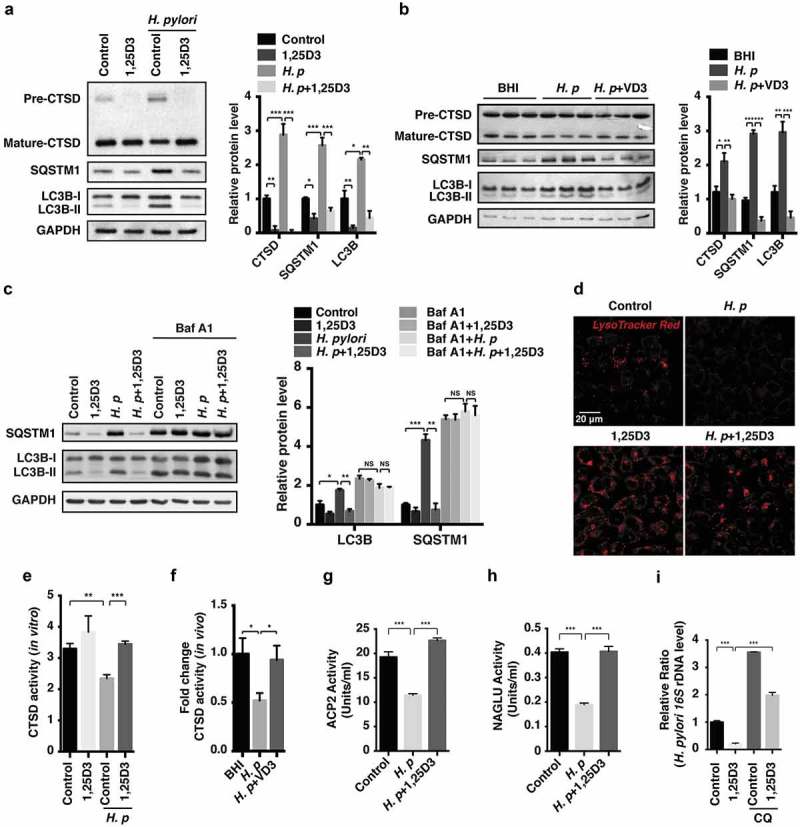
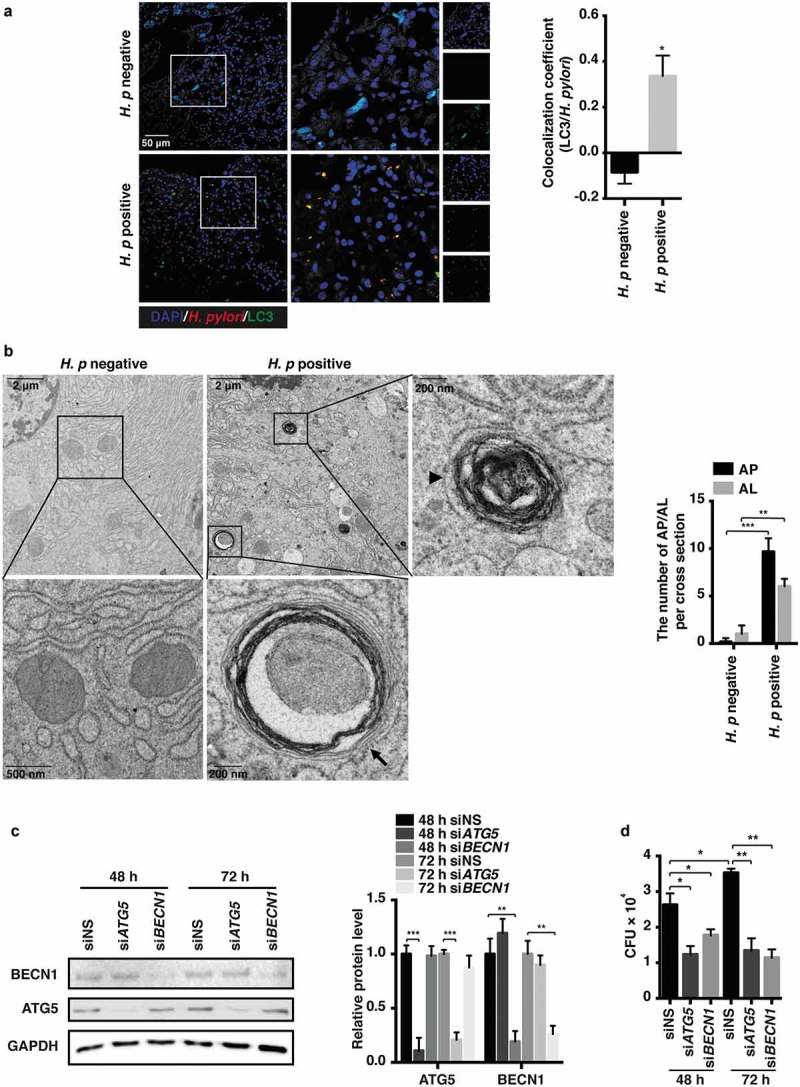
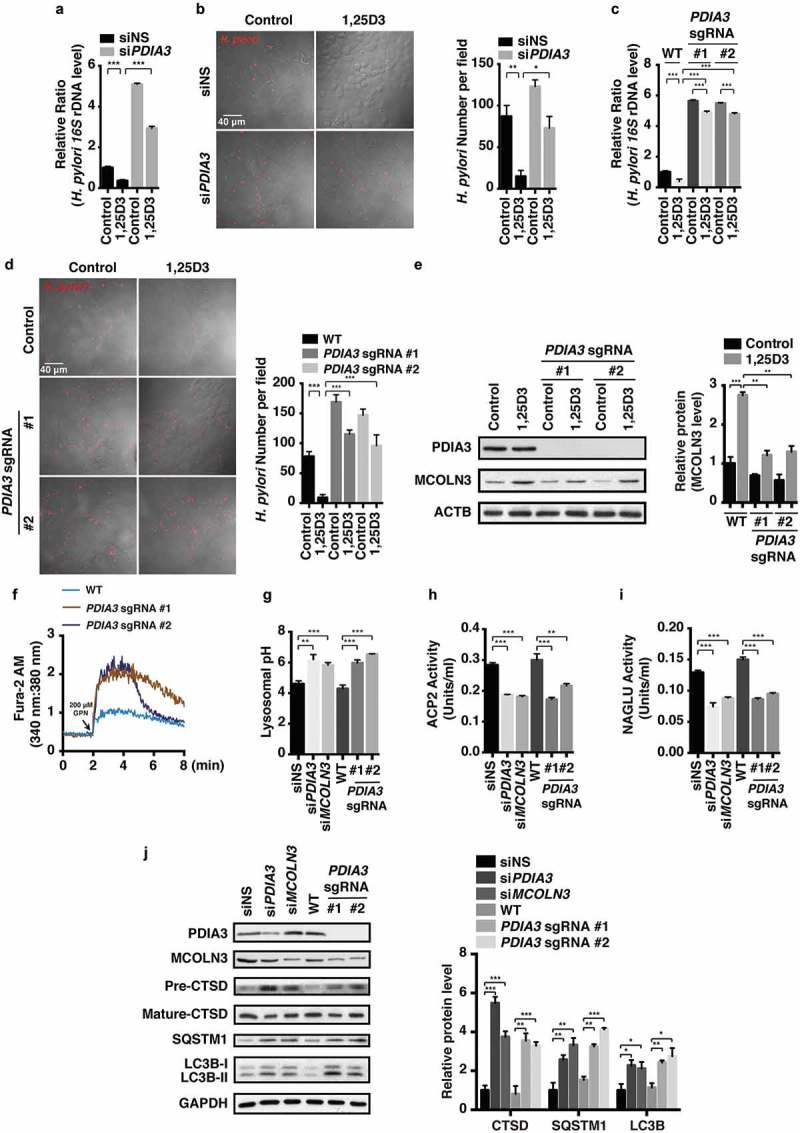
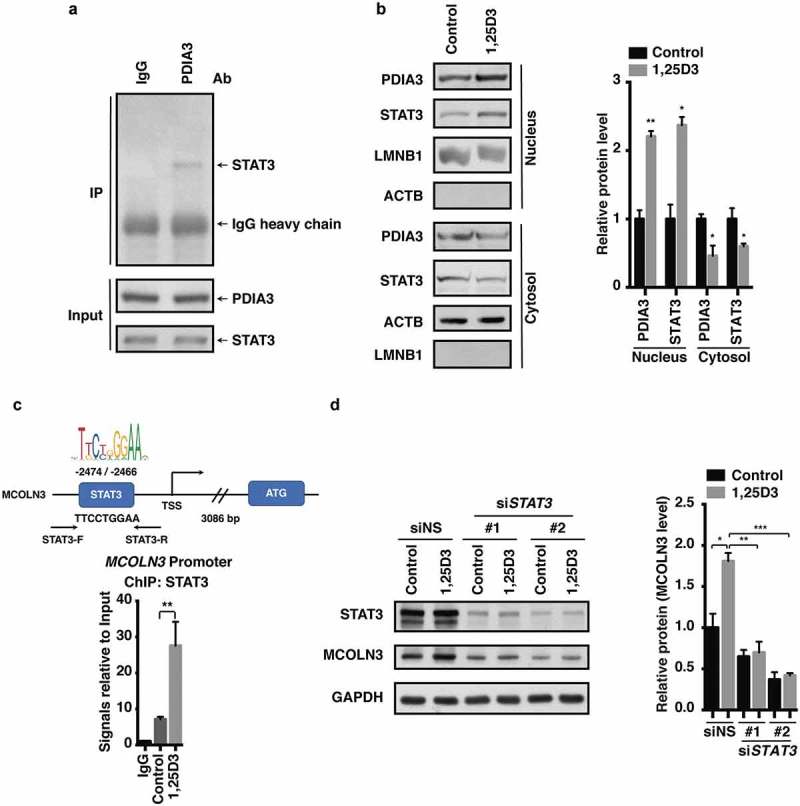
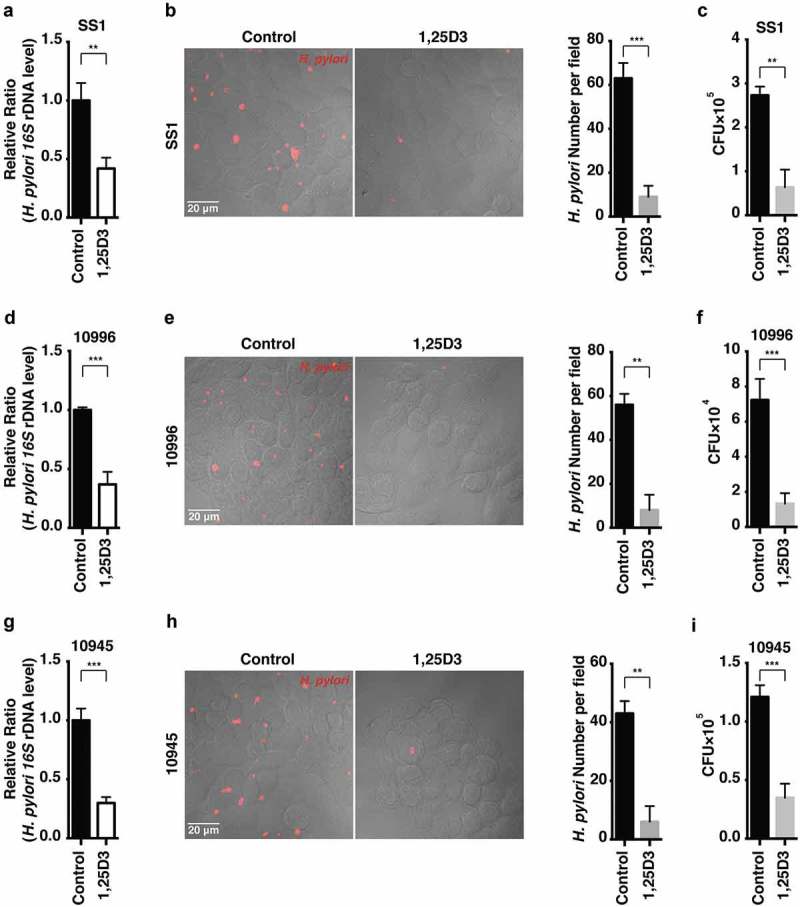
Helicobacter pylori (H. pylori) is a common human pathogenic bacterium. Once infected, it is difficult for the host to clear this organism using the innate immune system. Increased antibiotic resistance further makes it challenging for effective eradication. However, the mechanisms of immune evasion still remain obscure, and novel strategies should be developed to efficiently eliminate H. pylori infection in stomachs. Here we uncovered desirable anti-H. pylori effect of vitamin D3 both in vitro and in vivo, even against antibiotic-resistant strains. We showed that H. pylori can invade into the gastric epithelium where they became sequestered and survived in autophagosomes with impaired lysosomal acidification. Vitamin D3 treatment caused a restored lysosomal degradation function by activating the PDIA3 receptor, thereby promoting the nuclear translocation of PDIA3-STAT3 protein complex and the subsequent upregulation of MCOLN3 channels, resulting in an enhanced Ca2+ release from lysosomes and normalized lysosomal acidification. The recovered lysosomal degradation function drives H. pylori to be eliminated through the autolysosomal pathway. These findings provide a novel pathogenic mechanism on how H. pylori can survive in the gastric epithelium, and a unique pathway for vitamin D3 to reactivate the autolysosomal degradation function, which is critical for the antibacterial action of vitamin D3 both in cells and in animals, and perhaps further in humans. Abbreviations: 1,25D3: 1α, 25-dihydroxyvitamin D3; ATG5: autophagy related 5; Baf A1: bafilomycin A1; BECN1: beclin 1; CagA: cytotoxin-associated gene A; CFU: colony-forming unit; ChIP-PCR: chromatin immunoprecipitation-polymerase chain reaction; Con A: concanamycin A; CQ: chloroquine; CRISPR: clustered regularly interspaced short palindromic repeats; CTSD: cathepsin D; GPN: Gly-Phe-β-naphthylamide; H. pylori: Helicobacter pylori; LAMP1: lysosomal associated membrane protein 1; MAP1LC3B/LC3B: microtubule associated protein 1 light chain 3 beta; MCOLN1: mucolipin 1; MCOLN3: mucolipin 3; MCU: mitochondrial calcium uniporter; MOI: multiplicity of infection; NAGLU: N-acetyl-alpha-glucosaminidase; PDIA3: protein disulfide isomerase family A member 3; PMA: phorbol 12-myristate 13-acetate; PRKC: protein kinase C; SQSTM1: sequestosome 1; STAT3: signal transducer and activator of transcription 3; SS1: Sydney Strain 1; TRP: transient receptor potential; VacA: vacuolating cytotoxin; VD3: vitamin D3; VDR: vitamin D receptor.

Keywords: Autophagy; PDIA3; calcium; lysosome; vitamin D3.


Figures

Figure 1.
Figure 1.
H. pylori was eradicated by VD3 both in vivo and in vitro. (a–c) C57BL/6 mice (n = 8 per group) were infected with H. pylori SS1 strain for 1 month, and then administered with or without VD3 (1000 IU/kg, intragavage) every other day for the indicated times. (a) Mouse gastric tissues were extracted for DNA. H. pylori levels were quantified by real-time PCR, detecting H. pylori-specific 16S ribosomal DNA. Mouse Gapdh was used as the internal control. (b) Paraffin-embedded sections of mouse stomachs from the 2-months group were stained to visualize H. pylori (red) and nuclei (blue). Fifty visual fields per group were randomly selected to count bacteria number. Scale bar: 40 µm. (c) Mouse gastric tissues from the 2-months group were harvested and weighed, and then homogenized in sterile PBS. Following serial dilution, samples plated on H. pylori-selective blood agar plates were incubated for 1 week to count colony number. (d–f) HFE145 cells were infected with H. pylori SS1 strain (MOI 100) and treated with 1,25D3 (200 nM, 72 h) as detailed in ‘Materials and Methods’ (n = 3). (d) Intracellular H. pylori DNA levels were measured by real-time PCR, detecting H. pylori-specific 16S ribosomal DNA. Gapdh was used as the internal control. (e) Cells were stained to visualize H. pylori (red). Thirty visual fields from each group were randomly selected to count bacteria number. Scale bar: 20 µm. (f) Cells were permeabilized with 0.5% saponin for 15 min at room temperature, then plated on blood agar plates with serial dilutions, and cultured for 1 week to count colony number. All the quantitative data are presented as means ± S.E.M. *P < 0.05; **P < 0.01; ***P < 0.001.
Figure 2.
Figure 2.
Anti-H. pylori activities of VD3 were not mediated by CAMP expression. (a) HFE145, GES-1 and THP-1 cells treated with 1,25D3 (200 nM) for the indicated time were analyzed for CAMP mRNA level. (b) C57BL/6 mice (n = 8 per group) were infected with the H. pylori SS1 strain for 1 month, and then administered with or without VD3 (1000 IU/kg, ig.) every other day for another 2 months. Mouse gastric tissues were harvested to examine the Camp mRNA level. (c,e) HFE145 cells were transfected with CAMP-specific siRNA or shRNA for 24 h. Cells were harvested to examine the CAMP mRNA level, in order to assess the knockdown efficiency. (d,f) HFE145 cells transfected with CAMP-specific siRNA or shRNA were infected with H. pylori SS1 strain (MOI 100), and then treated with or without 1,25D3 (200 nM, 72 h). Intracellular H. pylori DNA levels were measured by real-time PCR. GAPDH was used as the internal control. All the quantitative data were presented as means ± S.E.M. from three independent experiments. **P < 0.01; ***P < 0.001.
Figure 3.
Figure 3.
Anti-H. pylori activities of VD3 were mediated through enhancement of lysosomal degradation. (a) HFE145 cells were infected with H. pylori SS1 strain (MOI 100) and treated with 1,25D3 (200 nM, 72 h). Whole-cell lysates were examined for LC3B, SQSTM1 and CTSD protein levels. LC3B-II:LC3B-I ratio, pre-CTSD:mature-CTSD ratio and SQSTM1 protein levels were quantified. (b) C57BL/6 mice (n = 8 per group) were infected with the H. pylori SS1 strain for 1 month, and then administered with or without vitamin D3 (1000 IU/kg, intragavage) every other day for another 2 months. Stomach tissues from 3 mice from each group were randomly selected to analyze for LC3B, SQSTM1 and CTSD protein levels. LC3B-II:LC3B-I ratio, pre-CTSD:mature-CTSD ratio and SQSTM1 protein levels were quantified. (c) HFE145 cells infected with the H. pylori SS1 strain (MOI 100) were treated with 1,25D3 (200 nM) and/or Baf A1 (100 μM) for 72 h. Cell lysates were analyzed for LC3B and SQSTM1 protein levels. LC3B-II:LC3B-I ratio and SQSTM1 protein levels were quantified. (d,e) HFE145 cells were infected with or without H. pylori SS1 strain (MOI 100), and then treated with 1,25D3 (200 nM, 72 h). (d) Cells were stained with LysoTracker Red (100 nM, 30 min) to assess lysosomal activities (n = 3). Scale bar: 20 µm. (e) Whole-cell lysates from each group were examined for CTSD activity. (f) C57BL/6 mice (n = 8 per group) were infected with the H. pylori SS1 strain for 1 month, and then administered with or without VD3 (1000 IU/kg, intragavage) every other day for another 2 months. Mouse gastric tissues were harvested to examine CTSD activity. (g,h) Lysosome fractions were enriched. ACP2 (g) and NAGLU (h) activities were determined using the appropriate commercial kits. (i) HFE145 cells infected with the H. pylori SS1 strain (MOI 100) were treated with 1,25D3 (200 nM) and/or CQ (10 μM) for 72 h. Intracellular H. pylori DNA levels were measured by real-time PCR. GAPDH was used as the internal control. All the quantitative data are presented as means ± S.E.M. from 3 independent experiments. **P < 0.01; ***P < 0.001.
Figure 4.
Figure 4.
Autophagosomes were taken by H. pylori as survival niches in human stomachs. (a) H. pylori-negative (n = 7) and -positive (n = 12) human patient biopsies were stained to visualize LC3B (green), H. pylori (red) and nuclei (blue). Thirty visual fields per group were randomly selected. Colocalization coefficient was presented as the percentage of punctate signals of LC3B that were positive for H. pylori. Scale bar: 50 µm. Reported values are the means ± S.E.M. *p < 0.05. (b) Ultrastructural features of H. pylori-negative (n = 5) and -positive (n = 12) human patient biopsies were analyzed by transmission electron microscopy. Scale bar: 2 µm. (Left panel) The typical images of mitochondria, autophagosomes (AP, arrow) enclosing intact H. pylori and autolysosomes (AL, arrowhead) are shown at higher magnification. (Right panel) Fifteen consecutive cross-sections from each patient were selected to count the number of autophagosomes and autolysosomes. (c–d) HFE145 cells transfected with control, ATG5- or BECN1-specific siRNAs were infected with the H. pylori SS1 strain (MOI 100) for the indicated times. (c) Cell lysates were analyzed and quantified for ATG5 and BECN1 protein levels. (d) Cells were permeabilized with 0.5% saponin for 15 min at room temperature, then plated on blood agar plates with serial dilutions, and cultured for 1 week to count colony number. The quantitative data are presented as means ± S.E.M. *P < 0.05; **P < 0.01; ***P < 0.001.
Figure 5.
Figure 5.
VD3 enhanced lysosomal degradation function via Ca2+-dependent lysosomal acidification. (a–c) HFE145 cells infected with the H. pylori SS1 strain (MOI 100) were treated with or without 1,25D3 (200 nM, 72 h). Cells were labelled with acridine orange (1 μM, 15 min) (n = 3), scale bar: 100 µm (a) or expressed GFP-mCherry-LC3 fusion protein (n = 3), scale bar: 20 µm (b). Baf A1 (100 μM, 24 h) was used as a positive control. (c) Lysosomal pH values were measured ratiometrically using LysoSensor Yellow/Blue DND-160. (d) HFE145 cells infected with the H. pylori SS1 strain (MOI 100) were treated with 1,25D3 (200 nM) and/or Con A (50 nM) for 72 h. Intracellular H. pylori DNA levels were measured by real-time PCR. (e) HFE145 cells infected with the H. pylori SS1 strain (MOI 100) were treated with or without 1,25D3 (200 nM, 72 h). Cells loaded with Fura-2 AM (3 μM, 30 min) were treated with GPN (200 μM) or DMSO. Calcium release from lysosomes was measured indirectly by assessing the cytoplasmic calcium levels (n = 3). (f) HFE145 cells infected with the H. pylori SS1 strain (MOI 100) were treated with or without 1,25D3 (200 nM, 72 h). MCOLN3 protein levels were analyzed and quantified. (g,h) HFE145 cells transfected with control or MCOLN3-specific siRNA were infected with the H. pylori SS1 strain (MOI 100), then treated with or without 1,25D3 (200 nM, 72 h). (g) Intracellular H. pylori DNA levels were measured by real-time PCR. (h) Cells were stained to visualize H. pylori (red). Thirty visual fields from each group were randomly selected to count bacteria number. Scale bar: 40 µm. (i) HFE145 cells transfected with control or MCOLN3-specific siRNA were loaded with Fura-2 AM (3 μM, 30 min), and then treated with GPN (200 μM). Calcium release from lysosomes was measured indirectly by assessing the cytoplasmic calcium levels (n = 3). All the quantitative data are presented as means ± S.E.M. from 3 independent experiments. **P < 0.01; ***P < 0.001.
Figure 6.
Figure 6.
The PDIA3-MCOLN3 axis was necessary for the VD3-induced anti-H. pylori effect. (a,b) HFE145 cells transfected with control or PDIA3-specific siRNA were infected with the H. pylori SS1 strain (MOI 100), and then treated with or without 1,25D3 (200 nM, 72 h). (a) Intracellular H. pylori DNA levels were measured by real-time PCR. (b) Cells were stained to visualize H. pylori (red). Thirty visual fields from each group were randomly selected to count bacteria number. Scale bar: 40 µm. (c,d) HFE145 cells transduced with PDIA3-targeting lentiCRISPR plasmids were infected with the H. pylori SS1 strain (MOI 100), and then treated with or without 1,25D3 (200 nM, 72 h). (c) Intracellular H. pylori DNA level was measured by real-time PCR. (d) Cells were stained to visualize H. pylori (red). Thirty visual fields from each group were randomly selected to count bacteria number. Scale bar: 40 µm. (e) HFE145 cells transduced with PDIA3-targeting lentiCRISPR plasmids were treated with or without 1,25D3 (200 nM, 72 h). Cell lysates were analyzed for PDIA3 and MCOLN3 protein levels. MCOLN3 proteins were quantified. (f) HFE145 cells transduced with PDIA3-targeting lentiCRISPR plasmids were loaded with Fura-2 AM (3 μM, 30 min), and then treated with GPN (200 μM). Calcium release from lysosomes was measured indirectly by assessing the cytoplasmic calcium levels (n = 3). (g–j) HFE145 cells were transfected with control, PDIA3- or MCOLN3-specific siRNA or transduced with PDIA3-targeting lentiCRISPR plasmids. (g) Lysosomal pH values were measured ratiometrically using LysoSensor Yellow/Blue DND-160. (h,i) Lysosome fractions were enriched to determine the activities of ACP2 (h) and NAGLU (i). (j) Whole-cell lysates were collected to examine PDIA3, MCOLN3, LC3B, SQSTM1 and CTSD protein levels by western blots, LC3B-II:LC3B-I ratio, SQSTM1 and CTSD proteins were quantified. All the quantitative data are presented as means ± S.E.M. from 3 independent experiments. *P < 0.05; **P < 0.01; ***P < 0.001.
Figure 7.
Figure 7.
Nuclear translocation of the PDIA3-STAT3 protein complex modulated MCOLN3 expression. (a) HFE145 cells were analyzed for protein levels as indicated by immunoprecipitation (IP) or western blots. Ten percent of the lysate used for the IP was loaded as input (n = 3). (b,c) HFE145 cells were incubated with 1,25D3 (200 nM) for 12 h. (b) Protein levels of PDIA3 and STAT3 in the cytosolic and nuclear extracts were determined and quantified. ACTB and LMNB1 were used as loading controls for the cytosolic and nuclear fractions, respectively. (c) STAT3 binding to the MCOLN3 promoter was analyzed by ChIP-PCR. Normal IgG was used as an internal control. (d) HFE145 cells transfected with control or STAT3-specific siRNA were incubated with 1,25D3 (200 nM, 48 h). Cell lysates were examined for STAT3 and MCOLN3 protein levels. MCOLN3 proteins were quantified. All the quantitative data are presented as means ± S.E.M. from 3 independent experiments. *P < 0.05; **P < 0.01; ***P < 0.001.
Figure 8.
Figure 8.
Antibiotic-resistant H. pylori strains were efficiently cleared by 1,25D3 at a physiological concentration. (a–i) HFE145 cells were infected with the H. pylori SS1, 10996 and 10945 strains (MOI 100) and treated with 1,25D3 (200 nM, 72 h). (a,d,g) Intracellular H. pylori DNA levels were measured by real-time PCR, detecting H. pylori-specific 16S ribosomal DNA. GAPDH was used as the internal control. (b,e,h) Cells were stained to visualize H. pylori (red). Thirty visual fields from each group were randomly selected to count bacteria number. Scale bar: 20 µm. (c,f,i) Cells were permeabilized with 0.5% saponin for 15 min at room temperature, and then plated on blood agar plates with serial dilution, and cultured for 1 week to count colony number. All the quantitative data are presented as means ± S.E.M. from 3 individual experiments. **P < 0.01; ***P < 0.001.
Figure 9.
Figure 9.
Schematic diagram depicting the proposed mechanism by which VD3 exerts anti-H. pylori effects. Autophagosomes enclosing H. pylori fuse with lysosomes to form autolysosomes. H. pylori infection leads to a downregulated MCOLN3 protein level, resulting in an abnormal Ca2+ accumulation in lysosomes, and impaired lysosomal acidification. VD3 treatment activates the membrane receptor PDIA3, and drives the PDIA3-STAT3 complex to redistribute into the nucleus, causing an upregulated MCOLN3 protein expression, thereby recovering the Ca2+ release from lysosomes and subsequent lysosomal acidification. As a consequence, H. pylori is eliminated by the restored autolysosomal pathway.

References

    1. Fukase K, Kato M, Kikuchi S, et al. Effect of eradication of Helicobacter pylori on incidence of metachronous gastric carcinoma after endoscopic resection of early gastric cancer: an open-label, randomised controlled trial. Lancet. 2008. August 2;372(9636):392–397. PubMed PMID: 18675689. - PubMed
    1. Thung I, Aramin H, Vavinskaya V, et al. Review article: the global emergence of Helicobacter pylori antibiotic resistance. Aliment Pharmacol Ther. 2016. February;43(4):514–533. PubMed PMID: 26694080; PubMed Central PMCID: PMCPMC5064663. - PMC - PubMed
    1. Allen LA, Schlesinger LS, Kang B.. Virulent strains of Helicobacter pylori demonstrate delayed phagocytosis and stimulate homotypic phagosome fusion in macrophages. J Exp Med. 2000. January 3;191(1):115–128. PubMed PMID: 10620610; PubMed Central PMCID: PMCPMC2195807. - PMC - PubMed
    1. Deen NS, Huang SJ, Gong L, et al. The impact of autophagic processes on the intracellular fate of Helicobacter pylori: more tricks from an enigmatic pathogen? Autophagy. 2013. May;9(5):639–652. PubMed PMID: 23396129; PubMed Central PMCID: PMCPMC3669176. - PMC - PubMed
    1. Chu YT, Wang YH, Wu JJ, et al. Invasion and multiplication of Helicobacter pylori in gastric epithelial cells and implications for antibiotic resistance. Infect Immun. 2010. October;78(10):4157–4165. PubMed PMID: 20696835; PubMed Central PMCID: PMCPMC2950335. - PMC - PubMed

Publication types

MeSH terms