. 2019 Jan 24;176(3):491-504.e21.
doi: 10.1016/j.cell.2018.11.038. Epub 2019 Jan 3.

METTL13 Methylation of eEF1A Increases Translational Output to Promote Tumorigenesis

Affiliations

METTL13 Methylation of eEF1A Increases Translational Output to Promote Tumorigenesis

Shuo Liu et al. Cell. .

Abstract

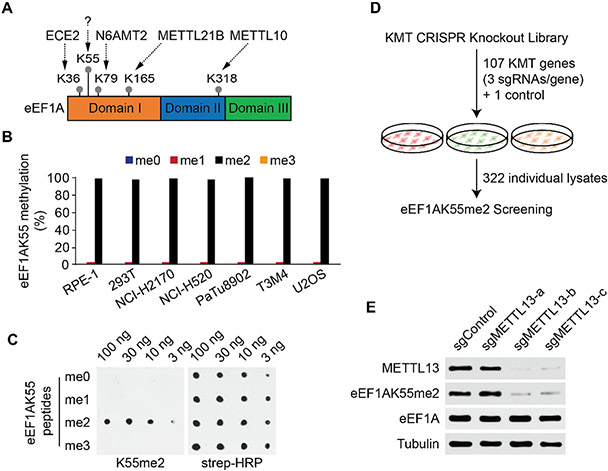
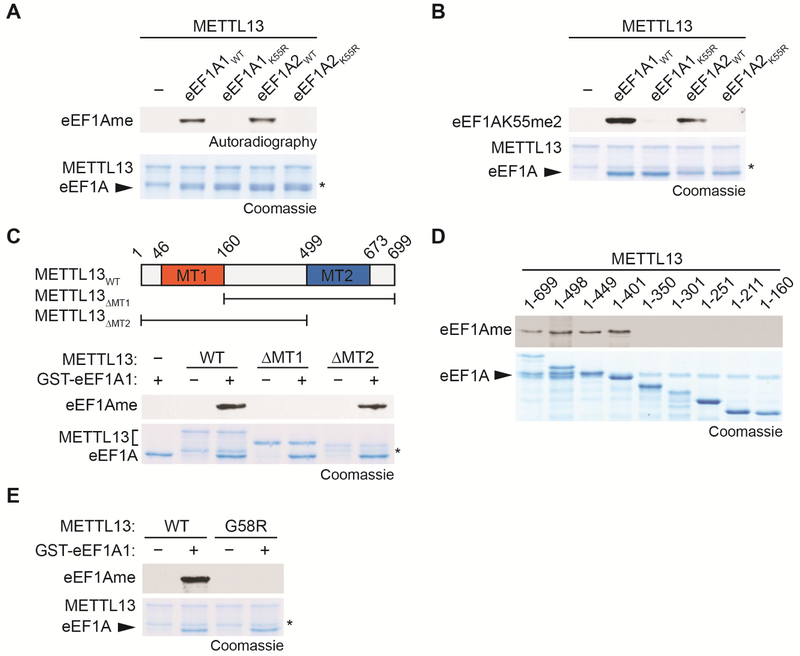
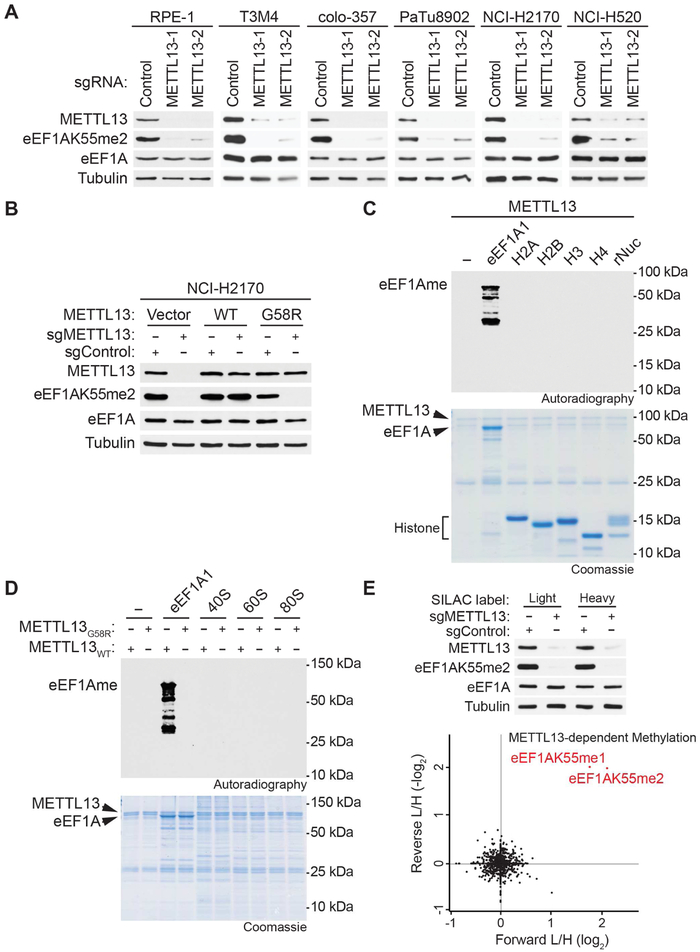
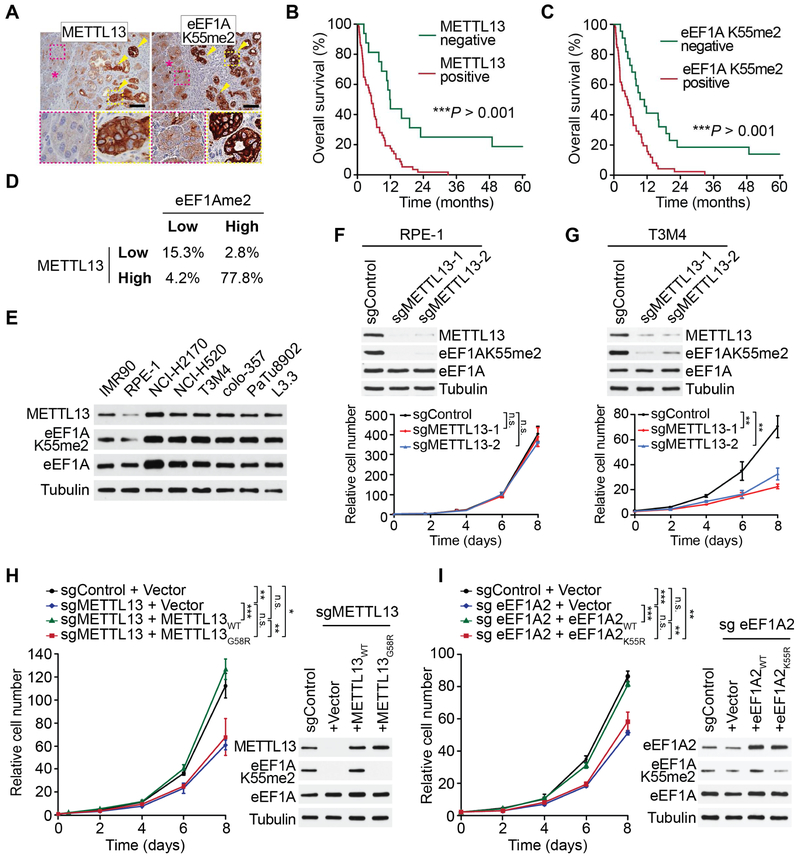
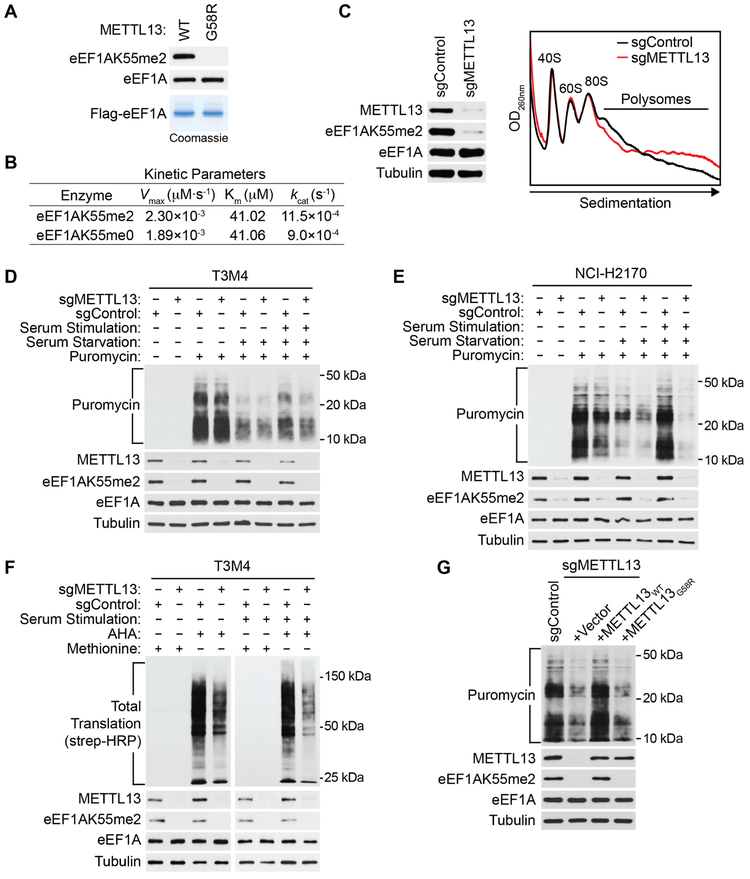
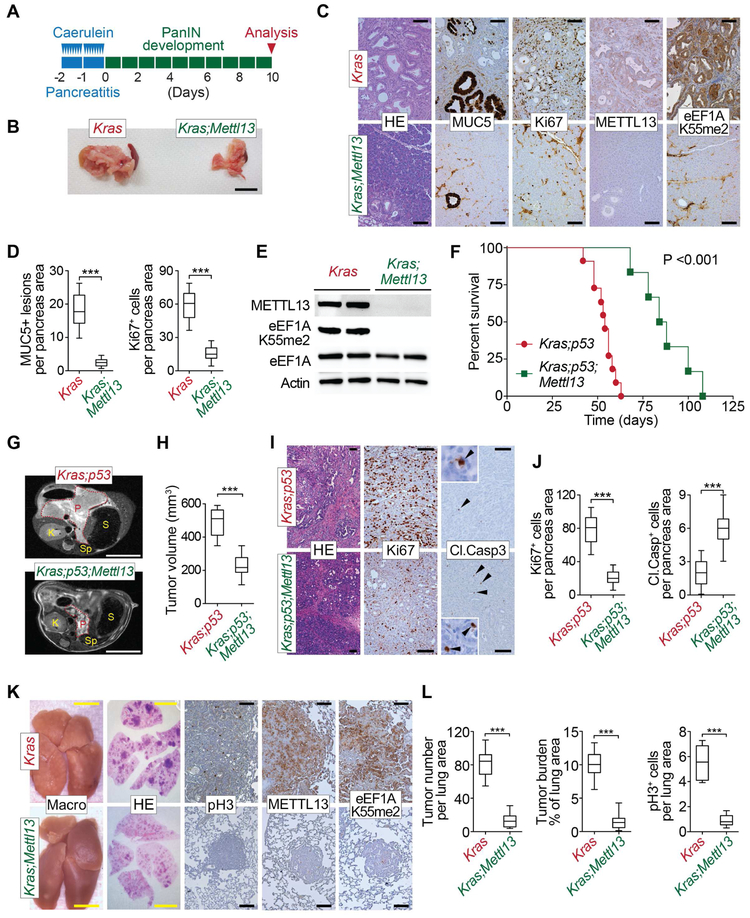
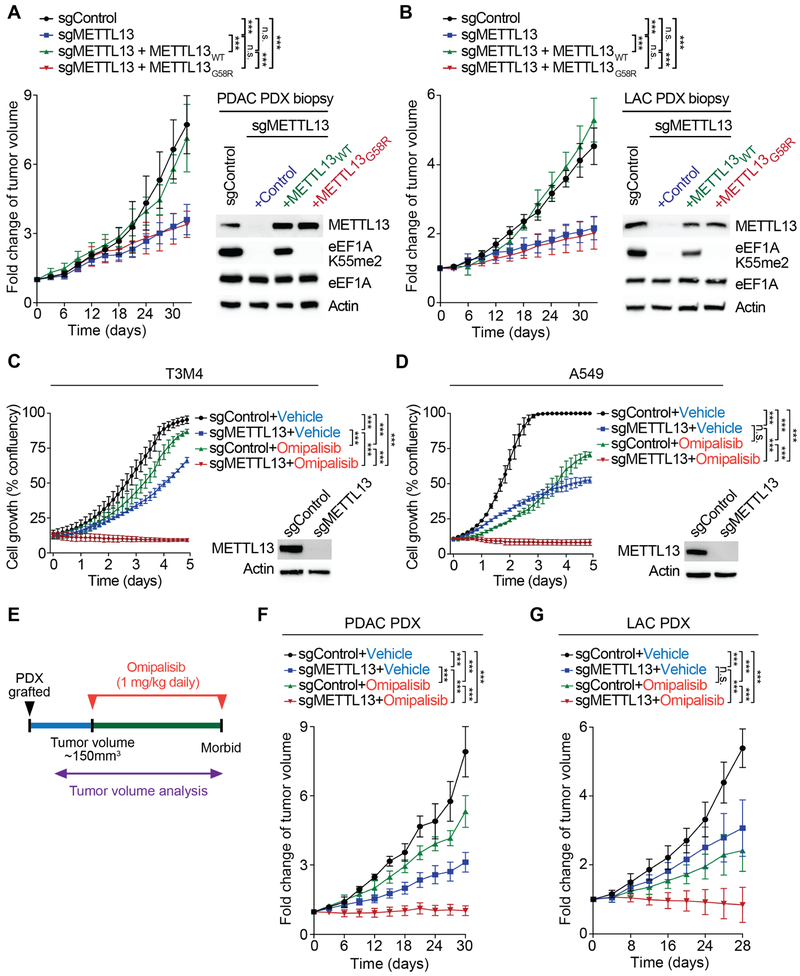
Increased protein synthesis plays an etiologic role in diverse cancers. Here, we demonstrate that METTL13 (methyltransferase-like 13) dimethylation of eEF1A (eukaryotic elongation factor 1A) lysine 55 (eEF1AK55me2) is utilized by Ras-driven cancers to increase translational output and promote tumorigenesis in vivo. METTL13-catalyzed eEF1A methylation increases eEF1A's intrinsic GTPase activity in vitro and protein production in cells. METTL13 and eEF1AK55me2 levels are upregulated in cancer and negatively correlate with pancreatic and lung cancer patient survival. METTL13 deletion and eEF1AK55me2 loss dramatically reduce Ras-driven neoplastic growth in mouse models and in patient-derived xenografts (PDXs) from primary pancreatic and lung tumors. Finally, METTL13 depletion renders PDX tumors hypersensitive to drugs that target growth-signaling pathways. Together, our work uncovers a mechanism by which lethal cancers become dependent on the METTL13-eEF1AK55me2 axis to meet their elevated protein synthesis requirement and suggests that METTL13 inhibition may constitute a targetable vulnerability of tumors driven by aberrant Ras signaling.

Keywords: METTL13; RAS; eEF1A; lung cancer; lysine methylation; pancreatic cancer; protein methylation; translation; translation elongation.


Figures

Figure 1.
Figure 1.. Identification of METTL13 as a Candidate eEF1A Lysine 55 Methyltransferase.
(A) Schematic of human eEF1A with the indicated major lysine methylation sites and protein domains. Methylated lysine residues are indicated by grey dots. Arrows connect the enzyme responsible for methylation with the indicated lysine residue. The “?” indicates that the enzyme for generating K55 methylation is unknown. (B) eEF1AK55 is primarily di-methylated in human cell lines. Quantitative analysis of endogenous eEF1AK55 methylation levels in the indicated cell lines by mass spectrometry. (C) Specific recognition of eEF1AK55me2 peptides by the anti-eEF1AK55me2 antibody. Dot blot analysis with αeEF1AK55me2 antibody (K55me2) using the indicated biotinylated peptides. Blots probed with HRP-conjugated streptavidin (strep-HRP) shown as loading controls. (D) Schematic of gene editing-coupled biochemical screening strategy to discover candidate KMT/s responsible for eEF1AK55 methylation. See Table S1 for list of the 322 sgRNAs. (E) Identification of METTL13 as a putative eEF1AK55 methyltransferase. Western analysis with the indicated antibodies of U2OS whole cell lysates expressing CRISPR/Cas9 and three independent sgRNAs targeting METTL13 (as in Figure S1F) and the control sgRNA (as in Figure S1E). Total eEF1A levels do no change and tubulin is shown as a loading control. See also Figure S1, Table S1
Figure 2.
Figure 2.. In vitro Methylation of eEF1A at Lysine 55 by METTL13.
(A) In vitro methylation assay with recombinant METT13 and recombinant wild-type GST-eEF1A1/2 or K55R mutants as indicated. Top panel, 3H-SAM is the methyl donor and methylation visualized by autoradiography. Bottom panel, Coomassie stain of proteins in the reaction. Asterisk in (A-C, E) indicates METTL13 breakdown product. (B) In vitro methylation assay as in (A) with non-radiolabeled SAM. Top panel, Western analysis with anti-eEF1AK55me2. Bottom panel, Coomassie stain of proteins in the reaction. (C) The N-terminal MT1 domain of METTL13 is necessary for eEF1AK55 methylation. In vitro methylation assay on GST-eEF1A1 with recombinant wild-type METTL13 or the indicated domain deletion fragments. Top panel, schematic diagram of putative methyltransferase (MT) domains of METTL13 and the truncated fragments used in methylation assays. Middle panel, autoradiogram of methylation assay. Bottom panel, Coomassie stain of proteins in the reaction. (D) Amino acids 1-401 of METTL13 are sufficient for eEF1AK55 methylation. In vitro methylation assay on GST-eEF1A1 with wild-type METTL13 or the indicated METTL13 truncated proteins. Top panel, autoradiogram of methylation assay. Bottom panel, Coomassie stain of proteins in the reaction. (E) Identification of METTL13 catalytic mutant. In vitro methylation assay on GST-eEF1A1 with wild-type METTL13 or METTL13 G58R mutant. Top panel, autoradiogram of methylation assay. Bottom panel, Coomassie stain of proteins in the reaction. See also Figure S2
Figure 3.
Figure 3.. The Principal Physiologic Activity of METTL13 is eEF1AK55 Methylation.
(A) METTL13 is required for eEF1AK55 methylation in multiple human cell lines. Western analysis with the indicated antibodies of whole cell extracts (WCEs) from the indicated cell lines (see methods) expressing two independent sgRNAs targeting METTL13 or a control sgRNA. (B) Reconstitution with wild-type METTL13 but not the inactive mutant restores EF1AK55me2 in cells. Western analysis with the indicated antibodies of WCEs from wild-type or METTL13-deficient NCI-H2170 cells complemented with CRISPR-resistant METTL13 (WT or G58R), or control as indicated. (C) Histones and nucleosomes are not methylated by METTL13. In vitro methylation assay as in Figure 2 on recombinant GST-eEF1A1, core histones (H2A, H2B, H3, and H4) or recombinant nucleosome (rNuc) with METTL13. eEF1A breakdown products containing K55 are seen below full-length with long exposure. Top panel, autoradiogram of methylation assay. Bottom panel, Coomassie stain of proteins in the reaction. (D) Purified ribosomes are not methylated by METTL13. In vitro methylation assay as in (C) on recombinant GST-eEF1A1, 40S and 60S ribosomal subunits, and 80S ribosomes isolated from cytoplasmic extracts of T3M4 cells with indicated METTL13 protein. (E) Methylation of eEF1AK55 is the only change out of >1000 methylated events detected upon METTL13 depletion in cells. Top panel, Western analysis with the indicated antibodies of WCEs from control or METTL13-depleted T3M4 cells maintained in SILAC media. Bottom panel, SILAC-based quantitative proteomic analysis of methylated peptides in cells ±METTL13. Methylated peptides are plotted by their SILAC ratios in two independent experiments in the forward (x axis) and reverse (y axis) experiments. Any methylated peptide that is dependent upon METTL13 will reside in the top right quadrant. Of the >1000 methylated peptides detected in the analysis (see Table S2), only the two eEF1A peptides harboring K55me1 and K55me2 are present in the top right quadrant as indicated in red. L/H, light over heavy fraction ratio. See also Figure S3, Table S2
Figure 4.
Figure 4.. METTL13 and eEF1AK55me2 Promote Cancer Cell Proliferation.
(A) Representative IHC images showing METTL13 and eEF1AK55me2 expression in pancreatic cancer lesions (arrowheads) but not in adjacent normal acini (asterisk) in human tissue samples (representative of 12 independent samples). Scale bars, 100 μm. The area marked with dotted lines is presented at higher magnification in the insets. (B and C) Analysis of correlation of METTL13 (B) and eEF1AK55me2 (C) staining and PDAC patient survival assessed by IHC. ***P < 0.001, log-rank test, 72 different samples were stained in total for each antibody, a representative staining presented on the right. Scale bars: 100 μm. (D) Correlation analysis of METTL13 and eEF1AK55me2 IHC signal (from B-C and S4E-F). Spearman correction r = 0.715, P-value < 0.0001, data presented as percent of samples in each category (see Methods). (E) Upregulation of METTL13 expression and eEF1AK55me2 levels in pancreatic and lung cancer cells compared to non-transformed cell lines. Western analysis with the indicated antibodies of WCEs from the indicated cell lines. IMR90 are normal human fibroblasts, RPE-1 are immortalized non-transformed human epithelial cells. Tubulin is shown as a loading control. (F and G) METTL13 depletion inhibits cell proliferation in a PDAC cell line but not in non-transformed cells. Western analysis (top pane) of WCEs and cell proliferation rates (bottom panel) of the non-transformed cell line RPE-1 (F) and human PDAC cell line T3M4 (G) expressing two independent METTL13 sgRNAs or a control sgRNA. Error bars represent S.D. from three independent experiments. **P < 0.01, n.s., not significant, two-tailed unpaired Student’s t-test. (H) METTL13 catalytic activity is required for METTL13-dependent proliferation of T3M4 cells. Western analysis and cell proliferation rates as in (G) of control or METTL13-depleted T3M4 cells complemented with CRISPR-resistant METTL13WT, METTL13G58R or control. Error bars represent S.D. from three independent experiments. *P < 0.05, **P < 0.01, ***P < 0.001, n.s., not significant, two-tailed unpaired Student’s t-test. (I) Role for intact K55 on eEF1A2 in promoting T3M4 proliferation. Western analysis and cell proliferation rates as in (G) of eEF1A2-depleted T3M4 cells complemented with CRISPR-resistant eEF1A2WT, eEF1A2K55R or control. Error bars represent S.D. from three independent experiments. **P < 0.01, ***P < 0.001, n.s., not significant, two-tailed unpaired Student’s t-test. See also Figure S4
Figure 5.
Figure 5.. METTL13-mediated eEF1AK55 Dimethylation Enhances Protein Synthesis in Cells.
(A) Purification of recombinant eEF1A1 ±K55me2. Top and middle panels, Western analysis with the indicated antibodies of eEF1A purified from 293T cells ±catalytically active METTL13 as indicated. Bottom panel, Coomassie stain of purified eEF1A1. (B) K55me2 increases the catalytic efficiency of GTP hydrolysis by eEF1A. The Michaelis-Menten kinetic parameters of Flag-eEF1A1 ±K55me2 purified from (A) are shown. (C) Cytosolic extracts were isolated from control or METTL13-depleted T3M4 cells and fractionated on 5-50% sucrose gradients. Absorbance profiles show distribution of 40 and 60S ribosomal subunits, 80S monosome and polysomes. OD260nm, optical density at 260 nm. Left panel, Western analysis represents WCEs from the indicated cell lines used for the polysome profiling. (D and E) SUnSET assays under the indicated conditions reveal reduced protein production in METTL13-depleted T3M4 (D) and NCI-H2170 (E) cells. WCEs were isolated and probed the indicated antibodies. (F) AHA labeling under the indicated conditions shows decrease in protein synthesis upon depletion of METTL13 in T3M4 cells. WCE of T3M4 probed with the indicated antibodies. (G) METTL13’s catalytic activity is required for enhanced protein synthesis in cells. SUnSET assays as in (D) of control (sgControl plus vector control) or METTL13-depleted T3M4 cells complemented with CRISPR-resistant METTL13WT, METTL13G58R or control as indicated and after recovery from serum starvation. WCEs were isolated and probed the indicated antibodies. See also Figure S5
Figure 6.
Figure 6.. METTL13 Deletion Represses KRAS-driven Pancreatic and Lung Tumorigenesis In Vivo.
(A) Schematic of the caerulein pancreatitis-induced precancerous (PanINs) lesion formation protocol used in Kras;Mettl13 and Kras (control) mice. (B) Representative examples of pancreata gross images (representative of 12 independent samples). Scale bar, 1 cm. (C) Representative haematoxylin and eosin (HE) staining and IHC for MUC5, a marker of PanIN lesions, Ki67, a marker of cell proliferation, METTL13 and eEF1AK55me2 (representative of 12 independent samples). Scale bars, 100 μm. (D) Quantification of Ki67-positive proliferating cell and MUC5-positive lesions in caerulein-treated pancreata from Kras control (n = 12) and Kras;Mettl13 (n = 12). ***P < 0.001, two-tailed unpaired Student’s t-test. Data are represented as mean ± s.e.m. (E) Westerns with the indicated antibodies of pancreatic tissue lysates from Kras;Mettl13 and Kras (control) mutant mice (two independent and representative samples are shown for each genotype). (F) Kaplan-Meier survival curves of Kras;p53 control mice (n = 10, median survival = 54 d) and Kras;p53;Mettl13 mutant mice (n = 6, median survival = 86 d). ***P < 0.001, log-rank test for significance. (G) Representative MRI scan in 7th week to analyze tumor volume in Kras;p53;Mettl13 and Kras;p53 mutant mice. Red dotted lines indicate pancreas area; abbreviations used: P=pancreas, S=stomach, K=kidney, Sp=spleen. Scale bars, 1cm. (H) Tumor/pancreas volume quantification in 7th week of age based on MRI scan (detailed procedure in Methods) of Kras;p53;Mettl13 and Kras;p53 mice (n = 4, each genotype) ***P < 0.001, two-tailed unpaired Student’s t-test. Data are represented as mean ± s.e.m. (I) Representative HE and IHC for Ki67 (a maker of proliferation) and Cleaved Caspase 3 (Cl.Casp 3, a marker of apoptosis) in pancreas tumors at autopsy in Kras;p53;Mettl13 and Kras;p53 mutant mice. Scale bars, 100 μm, insets magnification x10. (J) Quantification of Ki67-positive proliferating cell and Cleaved Caspase 3 apoptotic cells in pancreata at autopsy from Kras;p53 control (n = 6) and Kras;p53;Mettl13 (n = 6) mutant mice. ***P < 0.001, two-tailed unpaired Student’s t-test. Data are represented as mean ± s.e.m. (K) Representative macroscopic picture of lungs, HE staining and IHC for phospho-Histone H3 (pH3, a marker of proliferation), METTL13 and eEF1AK55me2 (representative of 8 independent samples). Scale bars: yellow 1 cm; black 100 μm. (L) Quantification of tumor number, tumor area (burden) and phospho Histone H3-positive (pH3+) proliferating cells per lung area in Kras control (n = 8) and Kras;Mettl13 (n = 8). ***P < 0.001, two-tailed unpaired Student’s t-test. Data are represented as mean ± s.e.m. See also Figure S6
Figure 7.
Figure 7.. Depletion of METTL13’s Catalytic Activity Inhibits Growth of Pancreatic and Lung Cancer PDX Tumors in vivo and Regression of PDX Tumors by METTL13 Depletion and PI3K/mTOR Inhibitors.
(A) Tumor volume quantification for patient derived PDAC xenografts modified to express sgRNA METTL13 or sgRNA control and overexpressing METTL13WT or catalytically deficient METTL13G58R in mice (n = 8 mice for each treatment group). ***P < 0.001, two-tailed unpaired Student’s t-test. Data are represented as mean ± s.e.m. Westerns with the indicated antibodies of PDX biopsies (one representative sample for each condition is shown). (B) Tumor volume quantification for patient derived LAC xenografts modified to express sgRNA METTL13 or sgRNA control and overexpressing METTL13WT or METTL13G58R in mice (n = 8 mice for each treatment group). ***P < 0.001, two-tailed unpaired Student’s t-test. Data are represented as mean ± s.e.m. Westerns with the indicated antibodies of PDX biopsies (one representative sample for each condition is shown). (C) Population growth of T3M4 pancreatic cancer cell line depleted for METTL13 by CRISPR/Cas9 sgRNA (sgMETTL13) or control (sgControl). Confluency of cells over 96h treated with Omipalisib (1μM) or placebo (vehicle). ***P < 0.001, two-tailed unpaired Student’s t-test. Data are represented as mean ± s.e.m (three independent experiments). Westerns of WCE with the indicated antibodies are shown. (D) Population growth of A549 lung cancer cell line depleted for METTL13 by CRISPR/Cas9 sgRNA (sgMETTL13) or control (sgControl) as in (C). ***P < 0.001, two-tailed unpaired Student’s t-test. Data are represented as mean ± s.e.m (three independent experiments). Westerns of WCE with the indicated antibodies are shown. (E) Treatment schedule for administration of Omipalisib (GSK2126458, 1 mg kg–1, intraperitoneal injection once daily) to immunocompromised mice grafted with PDX pancreatic (see F) or lung cancer (see G). Control mice received placebo (vehicle). Treatment started when tumors were around 150 mm3. (F and G) Tumor volume quantification for patient derived (C) PDAC and (D) LAC xenografts modified to express sgRNA METTL13 or sgRNA Control treated with placebo (vehicle) or Omipalisib. Plots showing fold change in tumor volume compared to initial tumor volume. ***P < 0.001, n.s., not significant, two-tailed unpaired Student’s t-test. Data are represented as mean ± s.e.m. See also Figure S7, Table S3

References

    1. Abbas W, Kumar A, and Herbein G (2015). The eEF1A Proteins: At the Crossroads of Oncogenesis, Apoptosis, and Viral Infections. Front Oncol 5, 75. - PMC - PubMed
    1. Bardeesy N, Aguirre AJ, Chu GC, Cheng KH, Lopez LV, Hezel AF, Feng B, Brennan C, Weissleder R, Mahmood U, et al. (2006). Both p16(Ink4a) and the p19(Arf)-p53 pathway constrain progression of pancreatic adenocarcinoma in the mouse. Proceedings of the National Academy of Sciences of the United States of America 103, 5947–5952. - PMC - PubMed
    1. Bhat M, Robichaud N, Hulea L, Sonenberg N, Pelletier J, and Topisirovic I (2015). Targeting the translation machinery in cancer. Nat Rev Drug Discov 14, 261–278. - PubMed
    1. Brooks RF (1977). Continuous protein synthesis is required to maintain the probability of entry into S phase. Cell 12, 311–317. - PubMed
    1. Cancer Genome Atlas Research, N. (2014). Comprehensive molecular profiling of lung adenocarcinoma. Nature 511, 543–550. - PMC - PubMed

Publication types

MeSH terms