. 2019 Jan 10;176(1-2):56-72.e15.
doi: 10.1016/j.cell.2018.11.030. Epub 2019 Jan 3.

Late Endosomes Act as mRNA Translation Platforms and Sustain Mitochondria in Axons

Affiliations

Late Endosomes Act as mRNA Translation Platforms and Sustain Mitochondria in Axons

Jean-Michel Cioni et al. Cell. .

Abstract

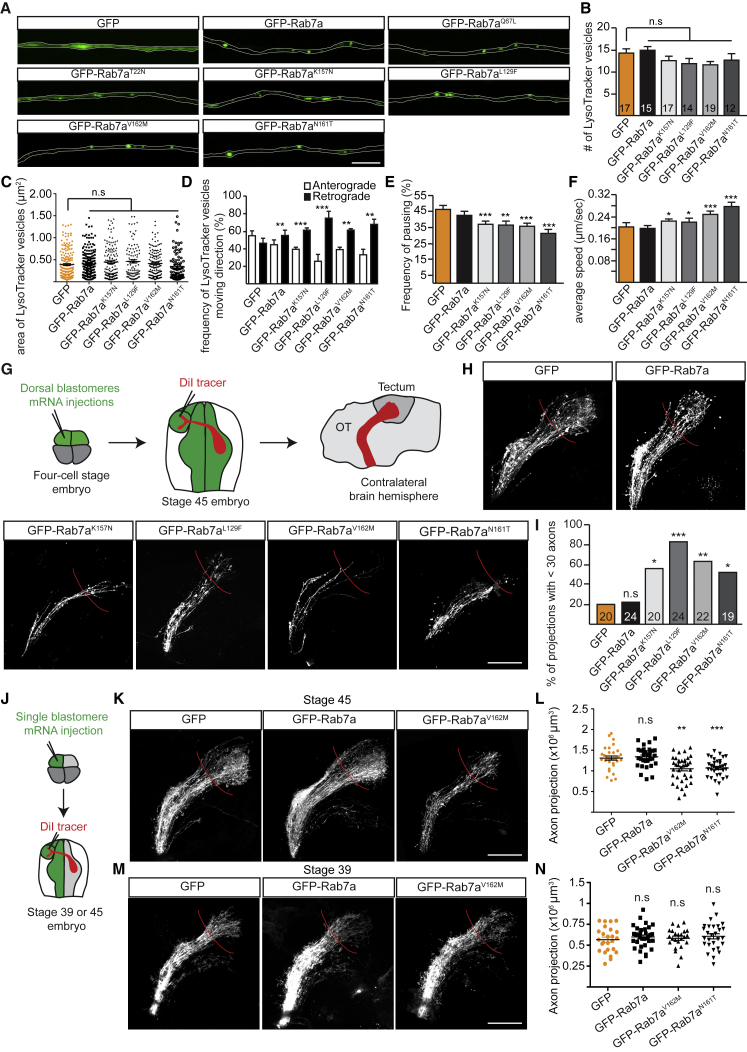
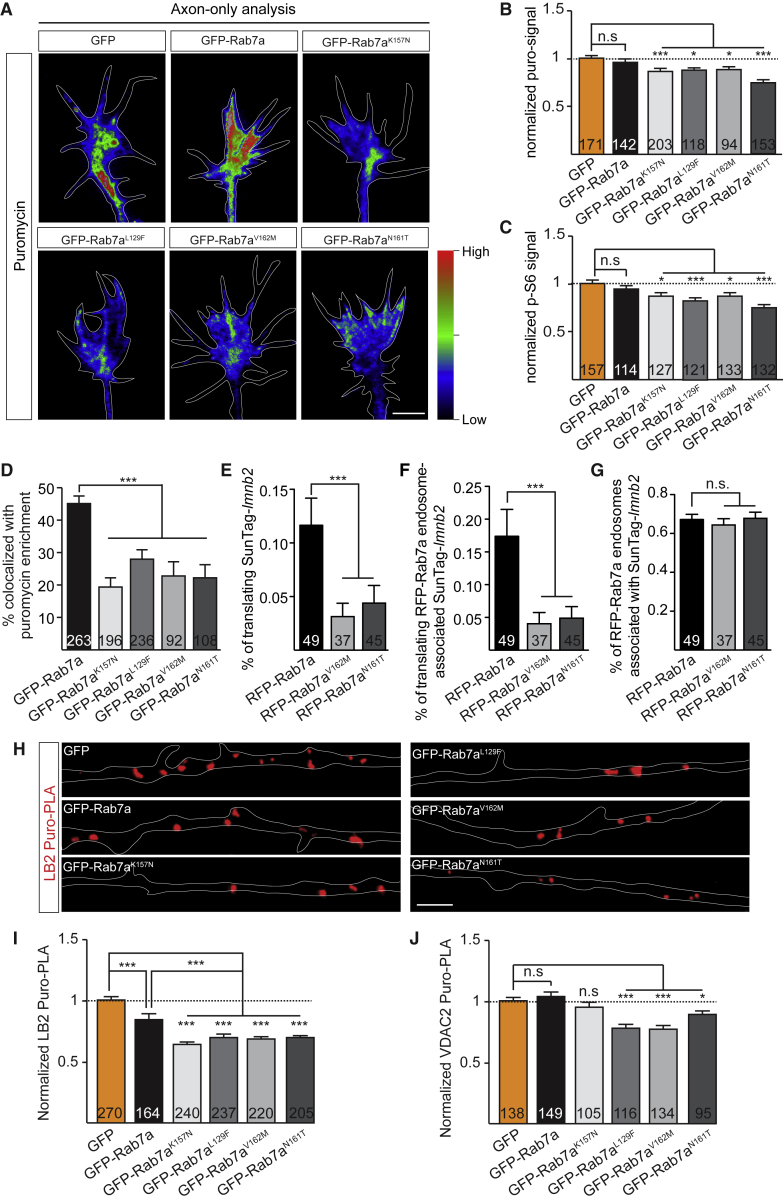
Local translation regulates the axonal proteome, playing an important role in neuronal wiring and axon maintenance. How axonal mRNAs are localized to specific subcellular sites for translation, however, is not understood. Here we report that RNA granules associate with endosomes along the axons of retinal ganglion cells. RNA-bearing Rab7a late endosomes also associate with ribosomes, and real-time translation imaging reveals that they are sites of local protein synthesis. We show that RNA-bearing late endosomes often pause on mitochondria and that mRNAs encoding proteins for mitochondrial function are translated on Rab7a endosomes. Disruption of Rab7a function with Rab7a mutants, including those associated with Charcot-Marie-Tooth type 2B neuropathy, markedly decreases axonal protein synthesis, impairs mitochondrial function, and compromises axonal viability. Our findings thus reveal that late endosomes interact with RNA granules, translation machinery, and mitochondria and suggest that they serve as sites for regulating the supply of nascent pro-survival proteins in axons.

Keywords: Charcot-Marie-Tooth type 2B; RNA trafficking; axon maintenance; endosome; local protein synthesis; lysosome; mRNA translation; mitochondria; retinal ganglion cell.


Figures

None
Graphical abstract
Figure 1
Figure 1
RNA Granules Are Associated with Endosomes in Axons (A) Schematic of labeling endogenous RNAs in the Xenopus CNS. (B) RGC axon shaft and growth cone containing Cy3-RNA granules undergoing oscillatory motions (B1), slow movement (B2), and fast movement (B3). Asterisks show the origin of the tracks. The frame-to-frame speeds are indicated by color code. The tracks are presented first at the same magnification and then at higher magnification for (B1) and (B2). (C) Proportions of axonal Cy3-RNA granules displaying the indicated motion types. (D) Speed distribution from average velocities of moving Cy3-RNA granules showing fast-moving and slow-moving populations in both anterograde (blue) and retrograde (red) directions (Gaussian mixture model). n = 1,022 moving RNA granules in 38 axons. (E) Scatterplot showing individual Cy3-RNA granule speed as a function of fluorescent pixel intensity. (E1) Violin plot showing the speed distribution of Cy3-RNA granules with pixel intensity either more or less than 5 a.u. (C–E) n = 4,995 RNA granules in 38 axons. (F) RGC axon segment showing the association between Cy3-RNA granules (red) and GFP-Rab5a (green) signals (white and yellow arrowheads indicate two different RNA granules) (F1). Also shown are kymographs (1 min) of the axon segment presented in (F1) (F2). (G) RGC axon segment showing the close association between Cy3-RNA granules (red) and GFP-Rab7a (green) signals (white and yellow arrowheads indicate two different RNA granules) (G1). Also shown are kymographs (1 min) of the axon segment presented in (G1) (G2). (H) Proportions of Cy3-RNA granules associated with GFP-Rab5a or GFP-Rab7a displaying the indicated motions (n = 52 [GFP-Rab5a] and n = 56 [GFP-Rab7a] RNA granules). (I) Speed of Cy3-RNA granules moving with or without GFP-Rab5a or GFP-Rab7a endosomes in axon shafts (n = 71 [GFP-Rab5a] and n = 52 [GFP-Rab7a] RNA granules). (J and K) Average pixel intensity (normalized to the brightest pixel within each axon) (J) and area (normalized to the area of the largest granule) (K) of Cy3-RNA granules away from or in contact with GFP-Rab5a or GFP-Rab7a endosomes (n = 192 [GFP-Rab5a] and n = 82 [GFP-Rab7a] RNA granules). Mean ± SEM; ∗∗p < 0.01, ∗∗∗p < 0.001; Wilcoxon rank-sum test in (E), Mann-Whitney test in (I)–(K). Scale bars, 1 μm in (B) and 5 μm in (F) and (G). Time stamps are in the format of seconds:milliseconds. See also Figures S1 and S2 and Video S1.
Figure S1
Figure S1
Spatial Relationship between Early Endosomes, Late Endosomes, the ER, and Cy3-RNA Granules in Cultured RGC Axons, Related to Figure 1 (A) GFP-Rab5a endosomes do not colocalize with Lyso-Tracker-labeled vesicles in distal axons (left). GFP-Rab7a endosomes colocalize with Lyso-Tracker-labeled vesicles (right, white arrows). (B) GFP-Rab5a endosomes do not colocalize with LAMP-1-associated vesicles in distal axons (left). GFP-Rab7a endosomes colocalize with LAMP-1-associated vesicles (right, white arrows). (C) GFP-Rab5a and GFP-Rab7a endosomes are in close contact with ER-Tracker-labeled axonal ER, but they are structurally distinct. (D) Percentage of GFP-Rab5a or GFP-Rab7a endosomes co-labeled with Lyso-Tracker, LAMP-1 or ER-Tracker. (E) Cy3-RNA granules are closely associated with ER-Tracker-labeled axonal ER (left). Kymograph of the axon segment indicated by the dotted outline (middle) shows little co-movement of the two signals (right). n, number of axon segments. Mean ± s.e.m. Scale bars: 5 μm in A, B, C, D, E1; 2 μm in E2.
Figure S2
Figure S2
RNA Granule Motions in Axons Expressing Wild-Type or Mutant GFP-Rab5a or GFP-Rab7a, Related to Figure 1 (A) Average speed of Cy3-RNA granules in axons expressing GFP, GFP-tagged wild-type Rab5a (Rab5a) or Rab5a mutants (Rab5aQ80L, Rab5aS35N). n=547 (GFP), 1064 (GFP-Rab5a), 695 (GFP-Rab5aQ80L), 524 (GFP-Rab5aS35N) granules. (B) Average speed of Cy3-RNA granules in axons expressing GFP, GFP-tagged wild-type Rab7a (Rab7a) or Rab7a mutants (Rab7aQ67L, Rab7aT22N). n=475 (GFP), 788 (GFP-Rab7a), 657 (GFP-Rab7aQ67L), and 811 (GFP-Rab7aT22N) granules. (A and B) For each of the three biological replicates we calculated a frequency distribution of speeds for the following bins: -2.5 to -2, -2 to -1.5, -1.5 to -1, -1 to -0.5,-0.5 to 0, 0 to 0.5, 0.5 to 1, 1 to 1.5, 1.5 to 2, 2 to 2.5, and 2.5 to 3. For each bin the bar plot represents the mean of the 3 replicates. (C) Proportions of Cy3-RNA granules transported anterogradely or retrogradely in axons expressing GFP as control, GFP-tagged wild-type Rab5a or Rab5a mutants Rab5aQ80L, Rab5aS35N. Data from all repeats are pooled. n=21 (GFP), 18 (GFP-Rab5a, 16 (GFP-Rab5aQ80L), 17 (GFP-Rab5aS35N) axons. (D) Proportions of Cy3-RNA granules transported anterogradely or retrogradely in axons expressing GFP as control (CT), GFP-tagged wild-type Rab7a (WT) or Rab7a mutants Rab7aQ67L, Rab7aT22N. Data from all repeats are pooled. n=17 (GFP), 18 (GFP-Rab7a), 20 (GFP-Rab7aQ67L), 20 (GFP-Rab7aT22N) axons. Mean±s.e.m.
Figure 2
Figure 2
Ribosomes, RNA-Binding Proteins, and mRNAs Localize to Endosomes in Axons (A) Colocalization between endosomal markers and RNA-binding proteins (RBPs) or ribosomal proteins. (B) Pearson’s coefficient between endosomal markers and RBPs or ribosomal proteins. n, number of axon segments. (C) Time-lapse images and kymographs (1 min) illustrating RPS3A-GFP association with RFP-Rab5a or Rab7a endosomes (yellow arrowheads) in axons. (D) Motion types of RFP-tagged Rab5a (n = 27 axons), Rab7a (n = 29 axons), or LAMP-1 (n = 22 axons) endosomes associated with the RPS3A-GFP signal. (E) Time-lapse images and kymographs illustrating GFP-Vg1RBP association with RFP-Rab5a or Rab7a endosomes (yellow arrowheads) in axons. (F and G) Frequency (F) and motion types (G) of GFP-Vg1RBP associated with RFP-tagged Rab5a (n = 15 axons), Rab7a (n = 13 axons), or LAMP-1 (n = 12 axons) endosomes. (H and I) Frequency (H) and motion types (I) of β-actin molecular beacon (MB) signals associated with GFP-Rab5a (n = 22 axons) or GFP-Rab7a (n = 20 axons) endosomes. (J) Representative images showing β-actin MBs associated with GFP-Rab5a or GFP-Rab7a endosomes (white arrowheads) in axons. Mean ± SEM. Scale bars: 2.5 μm in (A), 2 μm in (C) and (E), and 5 μm in (J). Time stamps are in the format of seconds:milliseconds. See also Figure S3 and Videos S2 and S3.
Figure S3
Figure S3
Ribosomes Associate with GFP-Rab5a and GFP-Rab7a Endosomes in Axons, Related to Figure 2 (A) Representative Western Blot of Vg1RBP and ribosomal proteins RPL10A and RPS3A co-immunoprecipitated with GFP-Rab5a and GFP-Rab7a in brain lysates. (B) qRT-PCR of cDNA synthesized from RNAs co-precipitated with GFP, GFP-Rab5a and GFP-Rab7a in brain lysates revealing a significant enrichment of β-actin mRNA (n=3 biological replicates). (C) OMX Super-resolution microscopy revealing the presence of RPL10A and RPS3A puncta on GFP-Rab5a or GFP-Rab7a endosomes in axons (left panels, white arrows). Orthogonal views of the indicated areas confirming the contact (yellow arrows) between the ribosomal proteins and endosomes (right panels). (D) Time-lapse images and kymographs illustrating RPS4X-GFP association with RFP-Rab5a or Rab7a endosomes (white arrowheads) in axons. Mean±s.e.m.; ∗∗P<0.01, Mann-Whitney test. Scale bars: 1μm in left panels in C and D; 200nm in right panels in C.
Figure 3
Figure 3
Perturbed Rab7a Activity and Late Endosome Maturation Reduced Intra-axonal Protein Synthesis (A) Heatmaps indicating relative puromycin fluorescence intensity (puro-signal) in somaless RGC growth cones. (B) Quantitative immunofluorescence (QIF) analysis of puromycin incorporation in somaless growth cones expressing the indicated constructs. (C) QIF analysis of puromycin incorporation in somaless growth cones upon acute pharmacological treatments. (D) Nascent proteins labeled by puromycin colocalizing with GFP-Rab7a endosomes but not GFP-Rab5a endosomes. (E) Plotted fluorescent signals across the dotted line in (D). (F) Percentage of GFP-tagged Rab5a-, Rab7a- and Rab7a mutant endosomes colocalizing with puromycin enrichment in axons. (G) Close association of GFP-Rab7a endosomes (green), Cy3-RNA granules (red), and mitochondria (blue) in RGC axons. White arrows indicate Cy3-RNA granules associated with GFP-Rab7a endosomes. (G1 and G2) Examples of time-lapse sequences showing Cy3-RNA granules associated with GFP-Rab7a endosomes next to mitochondria. (H) Percentage of GFP-Rab7a endosomes in contact with mitochondria, 80% of which are associated with Cy3-RNA granules (n = 335 GFP-Rab7a endosomes in 32 axons). (I) RGC axon segments expressing Mito-GFP (green) and RFP-Rab7a (red), in which newly synthesized proteins are visualized using puromycin labeling (blue). The puromycin signal is enriched on RFP-Rab7a endosomes in proximity to mitochondria (pink arrowheads) and distant from mitochondria (yellow arrowhead). (J) Plotted fluorescent signals along the axon segment presented in (I). (K) Percentage of RFP-Rab7a endosomes in contact with mitochondria with or without puromycin enrichment in axons (n = 52 axons). Mean ± SEM; N, number of growth cones in (B) and (C) or number of endosomes in (F). n.s., not significant. p < 0.05, ∗∗∗p < 0.001, Mann-Whitney test. Scale bars, 5 μm in (A) and 2 μm in (D), (G), and (I). Time stamps are in the format of seconds:milliseconds. See also Figures S4 and S5.
Figure S4
Figure S4
Perturbing Rab7a Function Disrupts Signaling Downstream of TOR Complex 1 in RGC Axons, Related to Figure 3 (A) Co-immunoprecipitation between endogenous Rab7 and TOR in brain lysates. (B) Co-immunoprecipitation between GFP-Rab7a and TOR in brain lysates. (C) Representative immunocytochemistry images showing TOR signals in RGC axons expressing GFP-Rab5a or GFP-Rab7a. Pearson’s coefficient between endosomal markers and TOR. (D) Representative phase contrast images and heat maps indicating relative phospho-S6 levels in growth cones expressing Rab7a mutants. GFP-Rab7aQ67L or GFP-Rab7aT22N expression decreases the amount of phospho-S6 ribosomal proteins in growth cones compared to GFP or GFP-Rab7a-expressing growth cones. (E) Representative phase contrast images and heat maps indicating relative phospho-AKT levels in growth cones expressing Rab7a mutants. GFP-Rab7a, GFP-Rab7aQ67L or GFP-Rab7aT22N expression does not affect the amount of phospho-AKT in growth cones compared to the GFP control. (F) Representative phase contrast images and heat maps indicating relative phospho-TOR levels in growth cones expressing Rab7a mutants. GFP-Rab7a, GFP-Rab7aQ67L or GFP-Rab7aT22N expression does not affect the amount of phospho-TOR in growth cones compared to the GFP control. n=number of axon segments in C, or n=number of growth cones in D, E, F. Mean±s.e.m.; n.s., not significant, ∗∗P<0.01, ∗∗∗P<0.001, Mann-Whitney test. Scale bars: 5μm.
Figure S5
Figure S5
Endosomes and Mitochondria Form Contacts in RGC Axons, Related to Figure 3 (A) Representative super-resolution microscopy images showing the close proximity between RFP-Rab7a endosomes and mitochondria (Mito-GFP) in RGC axons. Images in z-stacks showing the close proximity between the two signals in the Z-plane. Arrowheads indicate the close proximity between the two signals. (B) Distribution of distances between real or randomly distributed RFP-Rab7a endosomes and mitochondria (Mito-GFP). The distance of each endosome with its nearest mitochondria is shown as a fraction of the total number of endosomes. The arrow indicates that the largest number of endosomes lie between 0-200 nm of the closest mitochondria (n=188 endosomes in 21 axons). (C) Examples of time-lapse sequences showing the contact between GFP-Rab7a endosomes and mitochondria (MitoTracker) in RGC axons. (D) Percentage of GFP-Rab5a or GFP-Rab7a endosomes contacting mitochondria for more than 10 seconds over 2-minute recording (n=number of axon segments). (E and F) Duration of endosome-mitochondria contacts over 2-minute recording (n=77 (GFP-Rab7a), 60 (GFP-Rab5a), 63 (GFP-Rab7aQ67L) contacts). Mean±s.e.m.; n.s., not significant, ∗∗∗P<0.001, Mann-Whitney test. Scale bars: 1μm (left panel) or 200nm (z-stacks) in A; 2.5μm in C. Time stamps are in the format of min:sec.
Figure 4
Figure 4
mRNAs Essential for Mitochondrial Integrity Are Translated on Rab7a Endosomes in Axons (A) Co-immunoprecipitation (coIP) between Rab7 and Vg1RBP, FXR, SFPQ, RPS3A, and RPL10A in brain lysates. (B) CoIP between GFP-Rab7a and SFPQ in brain lysates. (C) Colocalization of GFP-Rab7a with SFPQ in axons (white arrowheads). (D) RGC axon segment analyzed by live imaging and its corresponding kymograph (1 min), showing the association between Cy5-labeled laminb2 mRNA (lmnb2) and GFP-Rab7a endosomes. (E) Schematic of SunTag system-based nascent polypeptide labeling to visualize Lamin B2 (LB2) synthesis. (F) Representative images showing the nascent SunTag-LB2 protein (green), the SunTag-lmnb2 mRNA (blue), and the RFP-Rab7a endosome (red) in live axons (indicated by white arrows). (G) Percentage of SunTag-lmnb2 mRNA associated with nascent SunTag-LB2 protein (translating) per 50-μm axon segment. (H) Percentage of SunTag-lmnb2 mRNA associated with RFP-Rab7a endosomes colocalized with nascent SunTag-LB2 protein (translating). (I) Percentage of RFP-Rab7a endosomes associated with SunTag-lmnb2 mRNA. (J) Quantitative analysis of lmnb2 mRNA by qRT-PCR of cDNA synthesized from RNAs co-precipitated with GFP and GFP-Rab7a from brain extracts (n = 3 biological replicates). (K) Example of LB2 Puro-PLA signals in proximity to GFP-Rab7a endosomes (white arrowheads) in axons. (L) Super-resolution microscopy analysis of LB2 Puro-PLA signals next to a GFP-Rab7a endosome. (M) Quantification of LB2 Puro-PLA signals in treated RGC axons. (N) Quantitative analysis of vdac2 mRNA by qRT-PCR of cDNA synthesized from RNAs co-precipitated with GFP and GFP-Rab7a from brain extracts (n = 3 biological replicates). (O) Quantification of VDAC2 Puro-PLA signals in treated RGC axons. N, number of axon segments in (G)–(I), (M), and (O). Mean ± SEM. p < 0.05, ∗∗p < 0.01, ∗∗∗p < 0.001, Mann-Whitney test. Scale bars: 5 μm in (C), (D), and (K); 1 μm in (F); and 500 nm in (L). Time stamps are in the format of seconds:milliseconds. See also Video S4.
Figure 5
Figure 5
Expression of Rab7a CMT2B Mutants Perturbs Late Endosome Trafficking and Axonal Projection In Vivo (A) Representative images of wild-type or mutant GFP-Rab7a endosomes in cultured axons. (B) Number of LysoTracker-positive vesicles per 50 μm of axon (n, number of axon segments). (C) Area of individual LysoTracker vesicles in axons (n = 180 [GFP], 187 [GFP-Rab7a], 137 [GFP-Rab7aK157N], 97 [GFP-Rab7aL129F], 140 [GFP-Rab7aV162M], 89 [GFP-Rab7aN161T] vesicles). (D) Percentage of LysoTracker vesicles moving anterogradely or retrogradely over a 1-min video (n = 130 [GFP], 114 [GFP-Rab7a], 249 [GFP-Rab7aK157N], 78 [GFP-Rab7aL129F], 155 [GFP-Rab7aV162M], 96 [GFP-Rab7aN161T] vesicles). (E and F) Frequency of pausing (E) and average speed (F) of individual vesicles over a 1-min video (n = 130 [GFP], 114 [GFP-Rab7a], 249 [GFP-Rab7aK157N], 78 [GFP-Rab7aL129F], 155 [GFP-Rab7aV162M], 96 [GFP-Rab7aN161T] vesicles). (G) Schematic of labeling of stage 45 RGC axons in vivo in bilaterally injected embryos. OT, optic tract. (H) Representative images of RGC axon projections in stage 45 embryos expressing GFP, wild-type Rab7a, or CMT2B disease mutants. (I) Percentage of embryos with defective RGC projections with less than 30 axons. (J) Schematic of RGC axon labeling in unilaterally injected embryos. (K) Representative images of RGC axon projections in stage 45 embryos expressing GFP, wild-type Rab7a, or GFP-Rab7aV162M. (L) Axon projection volume post-optic chiasm in stage 45 embryos expressing GFP (n = 31 embryos), wild-type Rab7a (n = 32 embryos), GFP-Rab7aV162M (n = 37 embryos), or GFP-Rab7aN161T (n = 33 embryos). (M) Representative images of RGC axon projections in stage 39 embryos expressing GFP, wild-type Rab7a, or GFP-Rab7aV162M. (N) Axon projection volume post-optic chiasm in stage 39 embryos expressing GFP (n = 25 embryos), wild-type Rab7a (n = 33 embryos), GFP-Rab7aV162M (n = 24 embryos), or GFP-Rab7aN161T (n = 28 embryos). Mean ± SEM. p < 0.05, ∗∗p < 0.01, ∗∗∗p < 0.001; Fisher’s exact test in (D) or Mann-Whitney test in (E), (F), (I), (L), and (N). Scale bars, 10 μm in (A) and 100 μm in (H), (K), and (M).
Figure 6
Figure 6
CMT2B-Associated Rab7a Mutations Disrupt Axonal Translation of mRNAs Essential for Mitochondrial Integrity (A) Heatmaps indicating relative puromycin fluorescence in RGC growth cones. (B) QIF analysis of puromycin incorporation (puro-signal) in somaless RGC growth cones expressing the indicated constructs. (C) QIF analysis of phospho-S6 ribosomal proteins in growth cones expressing the indicated constructs. (D) Percentage of GFP-Rab7a CMT2B mutant-endosomes with puromycin enrichment in axon shafts are decreased compared with wild-type GFP-Rab7a endosomes. (E) Percentage of SunTag-lmnb2 mRNA associated with nascent SunTag-LB2 protein (translating) per 50-μm axon segment. (F) Percentage of SunTag-lmnb2 mRNA associated with RFP-Rab7a or Rab7a CMT2B mutant endosomes colocalized with nascent SunTag-LB2 protein (translating). (G) Percentage of RFP-tagged Rab7a or Rab7a CMT2B mutant endosomes colocalized with Cy5-labeled SunTag-lmnb2 mRNA. (H) Representative LB2 Puro-PLA signals in axons expressing GFP, GFP-Rab7a, and GFP-Rab7a CMT2B mutants. (I) Quantification of LB2 Puro-PLA signals in axons expressing GFP, GFP-Rab7a, and GFP-Rab7a CMT2B mutants. (J) Quantification of VDAC2 Puro-PLA signals in axons expressing GFP, GFP-Rab7a, and GFP-Rab7a CMT2B mutants. Mean ± SEM. N, number of growth cones in (B) and (C), number of endosomes in (D), or number of axon segments in (E–G), (I), and (J). p < 0.05, ∗∗∗p < 0.001, Mann-Whitney test. Scale bars, 5 μm in (A) and (H). See also Video S5.
Figure 7
Figure 7
Expression of CMT2B-Associated Rab7a Mutations Compromises Mitochondrial Integrity (A) MitoTracker-labeled mitochondria illustrating variation in mitochondrial morphology in axons expressing GFP-Rab7a CMT2B mutants. (B) Quantification of mitochondrial length (n = 301 [GFP], 148 [GFP-Rab7a], 273 [GFP-Rab7aK157N], 268 [GFP-Rab7aL129F], 225 [GFP-Rab7aV162M], 279 [GFP-Rab7aN161T] vesicles). (C) Quantification of the number of mitochondria within 25-μm axon segments. (D) The percentage of mitochondria transported anterogradely decreases in axons expressing the GFP-Rab7aV162M CMT2B mutant, whereas the percentage of mitochondria transported retrogradely increases compared with the GFP control or GFP-Rab7a-expressing axons. (E) Quantification of mitochondrial membrane potential, measured by TMRM fluorescence intensity, showing a decrease in axons expressing the GFP-Rab7aV162M CMT2B mutant (n = 31 axons) compared with the GFP control (n = 44 axons) and GFP-Rab7a-expressing axons (n = 31 axons). (F) Proposed model. mRNAs and translation machinery associate with late endosomes in axons. Late endosomes in proximity to mitochondria are sites for synthesis of proteins essential for mitochondrial integrity. Late endosome-sited translation is defective in axons expressing CMT2B-associated Rab7a mutants, causing a reduction in mitochondrion-related mRNAs translation. N, number of axon segments in (C); N, number of mitochondria in (E). Mean ± SEM. ∗∗∗p < 0.001, Mann-Whitney test. Scale bars, 5 μm in (A).

References

    1. Alami N.H., Smith R.B., Carrasco M.A., Williams L.A., Winborn C.S., Han S.S.W., Kiskinis E., Winborn B., Freibaum B.D., Kanagaraj A. Axonal transport of TDP-43 mRNA granules is impaired by ALS-causing mutations. Neuron. 2014;81:536–543. - PMC - PubMed
    1. Andreassi C., Riccio A. To localize or not to localize: mRNA fate is in 3’UTR ends. Trends Cell Biol. 2009;19:465–474. - PubMed
    1. Applegate K.T., Besson S., Matov A., Bagonis M.H., Jaqaman K., Danuser G. plusTipTracker: Quantitative image analysis software for the measurement of microtubule dynamics. J. Struct. Biol. 2011;176:168–184. - PMC - PubMed
    1. BasuRay S., Mukherjee S., Romero E., Wilson M.C., Wandinger-Ness A. Rab7 mutants associated with Charcot-Marie-Tooth disease exhibit enhanced NGF-stimulated signaling. PLoS ONE. 2010;5:e15351. - PMC - PubMed
    1. Baumann S., König J., Koepke J., Feldbrügge M. Endosomal transport of septin mRNA and protein indicates local translation on endosomes and is required for correct septin filamentation. EMBO Rep. 2014;15:94–102. - PMC - PubMed

Publication types

MeSH terms