. 2019 Feb 7;73(3):429-445.e7.
doi: 10.1016/j.molcel.2018.11.018. Epub 2019 Jan 3.

The Crohn's Disease Risk Factor IRGM Limits NLRP3 Inflammasome Activation by Impeding Its Assembly and by Mediating Its Selective Autophagy

Affiliations

The Crohn's Disease Risk Factor IRGM Limits NLRP3 Inflammasome Activation by Impeding Its Assembly and by Mediating Its Selective Autophagy

Subhash Mehto et al. Mol Cell. .

Abstract

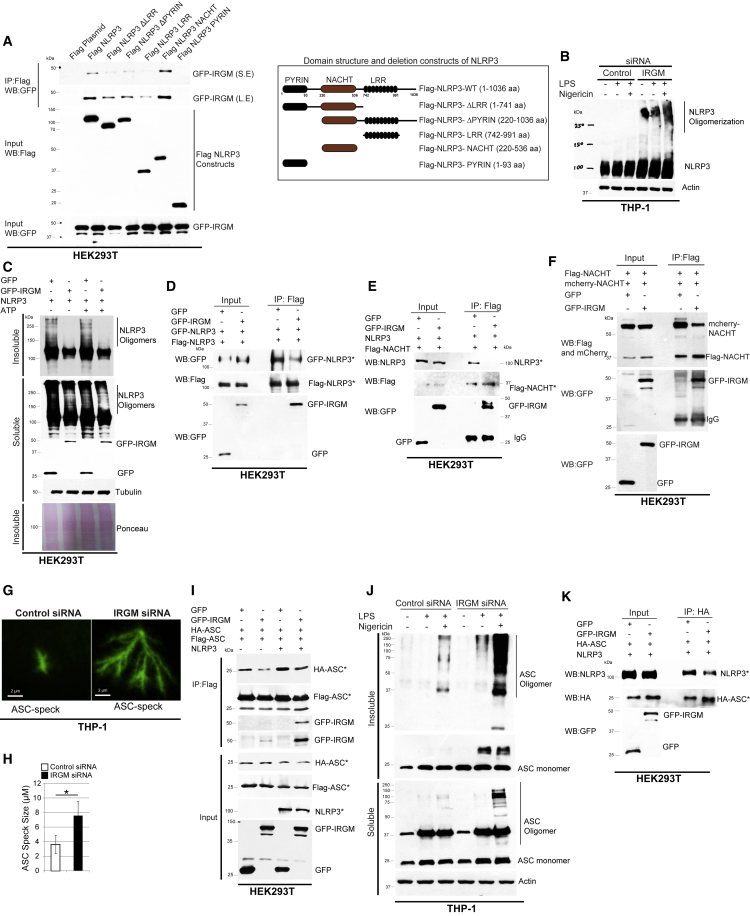
Several large-scale genome-wide association studies genetically linked IRGM to Crohn's disease and other inflammatory disorders in which the IRGM appears to have a protective function. However, the mechanism by which IRGM accomplishes this anti-inflammatory role remains unclear. Here, we reveal that IRGM/Irgm1 is a negative regulator of the NLRP3 inflammasome activation. We show that IRGM expression, which is increased by PAMPs, DAMPs, and microbes, can suppress the pro-inflammatory responses provoked by the same stimuli. IRGM/Irgm1 negatively regulates IL-1β maturation by suppressing the activation of the NLRP3 inflammasome. Mechanistically, we show that IRGM interacts with NLRP3 and ASC and hinders inflammasome assembly by blocking their oligomerization. Further, IRGM mediates selective autophagic degradation of NLRP3 and ASC. By suppressing inflammasome activation, IRGM/Irgm1 protects from pyroptosis and gut inflammation in a Crohn's disease experimental mouse model. This study for the first time identifies the mechanism by which IRGM is protective against inflammatory disorders.

Keywords: ASC; Crohn’s disease; IRGM; Irgm1; NLRP3; autoimmunity; autophagy; inflammasome; inflammatory bowel diseases; inflammatory disorders; p62.


Figures

None
Graphical abstract
Figure 1
Figure 1
IRGM Suppresses Pro-inflammatory Response and NLRP3-Inflammasome Activation (A) Human colon epithelial HT-29 cells were starved (2 hr) or stimulated with LPS (100 ng/mL, 2 hr) alone or in combination with nigericin (10 μM, 1 hr) or with MDP (10 μg/mL, 6 hr), and immunoblotting was performed with lysates. (B) Human PBMCs from healthy volunteers were exposed to LPS (100 ng/mL), and total RNA was subjected to qRT-PCR using IRGM TaqMan probe. (C and D) THP-1 cells were stimulated with inflammasome inducers (C) ATP or (D) MSU crystals for the indicated time periods, and extracts were subjected to western blotting with IRGM antibody. (E and F) HT-29 control and IRGM knockdown cells were infected with S. typhimurium (1:10 MOI, 8 hr), and the total RNA was subjected to qRT-PCR with (E) IL-1β and (F) TNF-α. (G–J) The total RNA isolated from the LPS-stimulated (100 ng/mL, 2 hr) control and IRGM siRNA-transfected (G and H) THP-1 cells or (I and J) PBMCs from five healthy donors were subjected to qRT-PCR for the indicated genes. For (G) and (H), n = 3, mean ± SE, p < 0.05, Student’s unpaired t test. For (I) and (J), n = 5, mean ± SE, p < 0.05, Student’s paired t test. (K) The LPS (500 ng/mL)-stimulated control and IRGM siRNA-transfected THP-1 cell lysates were subjected to immunoblotting with indicated antibodies. (L) The supernatants from control and IRGM siRNA-transfected THP-1 cells, which were stimulated with LPS (100 ng/mL, 4 hr) alone or in combination with nigericin (5 μM, 30 min), were subjected to ELISA with IL-1β antibody. (M and N) The western blotting was performed with control and IRGM siRNA-transfected THP-1 cells, which were stimulated with LPS (1 μg/mL for 3 hr) alone or in combination (M) with nigericin (5 μM, 30 min) or (N) with ATP (2.5 mM, 4 hr). (O and P) Quantification of (O) active caspase-1 (FLICA assay) and (P) secreted IL-1β (ELISA) in THP-1 cells transfected with control, IRGM, and NLRP3 siRNA and treated with LPS (1 μg/mL, 3 hr) and nigericin (5 μM, 15 min). (Q) The control and IRGM siRNA-transfected THP-1 cells were treated with LPS (1 μg/mL, 3 hr), nigericin (5 μM, 15 min), or MCC950 (1 μM) as indicated, and western blotting was performed. Unless otherwise stated above, n = 3, mean ± SD, p < 0.05, ∗∗p < 0.005, ∗∗∗p < 0.0005, #insignificant, Student’s unpaired t test. See also Figure S1.
Figure 2
Figure 2
IRGM Interacts and Co-localizes with NLRP3 Inflammasome Components (A and B) Co-immunoprecipitation (coIP) analysis of interaction between (A) GFP-IRGM and NLRP3 or (B) Flag-NLRP3 and GFP-IRGM in HEK293T cells lysates. (C) IP analysis of interaction between endogenous IRGM and NLRP3 in LPS-stimulated THP-1 cells. (D) Representative confocal images of THP-1 macrophages, treated with LPS and processed for immunofluorescence (IF) analysis. (E) GST pull-down assay of in-vitro-translated and radiolabeled myc-tagged NLRP3 with GST or GST-tagged IRGM. (F) IP analysis of interaction between endogenous IRGM and ASC in LPS+nigericin-treated THP-1 cells. (G) Representative confocal images of THP-1 cells, treated with LPS (1 μg/mL, 3 hr) and nigericin (5 μM, 30 min) and processed for IF analysis. (H) CoIP analysis of interaction between IRGM and ASC in HEK293T cell lysates in absence and in presence of NLRP3. S.E., short exposure; L.E., long exposure. (I and J) Representative confocal images of HEK293T cells transiently expressing (I) GFP-IRGM and HA-ASC and (J) GFP-NLRP3, mcherry-IRGM, and HA-ASC. (K) The graph depicts percentage co-localization of ASC specks with IRGM in the absence and presence of NLRP3 (n = 3, mean ± SD, ∗∗∗p < 0.0005). (L) IP analysis of the interaction between endogenous IRGM and ASC in THP1 cells transfected with control siRNA or NLRP3 siRNA. (M) CoIP analysis to map the interaction of ASC domains with IRGM in HEK293T cell lysates. (N) The domain organization map of ASC and deletion constructs cloned as FLAG-tagged proteins. Scale bars are indicated in the respective figures. See also Figure S1.
Figure 3
Figure 3
IRGM Impedes the Homo- and Hetero-oligomerization of NLRP3 and ASC (A) Left panel, coIP analysis to map the binding of IRGM over the NLRP3 domains in HEK293T cell lysates. Right panel, the domain organization map of NLRP3 and deletion constructs cloned as FLAG-tagged proteins. S.E., short exposure; L.E., long exposure. (B) The western blotting analysis of DSS cross-linked insoluble fraction of LPS and nigericin-treated control and IRGM knockdown THP-1 cells. (C) The soluble and insoluble fractions of DSS cross-linked HEK293T cells lysates expressing NLRP3 and GFP or GFP-IRGM were subjected to western blotting. (D–F) CoIP analysis of interaction between (D) FLAG-NLRP3 and GFP-NLRP3, (E) FLAG-NLRP3-NACHT and NLRP3, and (F) FLAG-NLRP3-NACHT and mcherrry-NLRP3-NACHT in the absence and presence of GFP-IRGM in HEK293T cells lysates. (G) Super-resolution micrograph of control and IRGM siRNA-transfected THP-1 cells stably expressing LPS-inducible GFP-ASC. (H) Average ASC speck size measured (n = 2, mean ± SD [40 specks], p < 0.05). (I) IP analysis from HEK293T cell lysates expressing HA-ASC, FLAG-ASC, and NLRP3 along with GFP control vector or GFP-IRGM vector. (J) The western blot analysis with DSS cross-linked insoluble fraction and soluble fractions of control and IRGM knockdown THP-1 cells stimulated with LPS (1 μg/mL, 3 hr) and nigericin (5 μM, 15 min). (K) IP analysis of interaction between NLRP3 and ASC in the absence and presence of GFP-IRGM. In order to reduce the artifact coming from IRGM-mediated degradation of NLRP3 and ASC, the inputs ratios were adjusted to have equal inputs in both the conditions and the IP samples were run in the same ratios as of the inputs. Scale bars are as indicated in figures. See also Figure S2.
Figure 4
Figure 4
IRGM Mediates Autophagic Degradation of NLRP3 and ASC (A) Western blotting experiment with HEK293T cells expressing NLRP3 and GFP or GFP-IRGM plasmids. (B) Western blot analysis with untreated or LPS-treated (100 ng/mL, 2 hr) control or IRGM siRNA-transfected THP-1 cells lysates. (C) HEK293T cells expressing FLAG control vector, FLAG-IRGM, and GFP-NLRP3 were treated with MG132 or Bafilomycin A1, and lysates were subjected to western blotting. S.E., short exposure; L.E., long exposure. (D and E) The control and (D) ATG5 siRNA or (E) ATG7 siRNA-transfected HEK293T cells expressing NLRP3, GFP, or/and GFP-IRGM were subjected to immunoblotting. (F and G) The control and the (F) ATG5 siRNA or (G) ATG7 siRNA-transfected THP-1 cells expressing GFP or GFP-IRGM were stimulated with LPS (1 μg/mL, 3 hr), and the cell lysates were subjected to immunoblotting. (H) HEK293T cells expressing HA-ASC and GFP or GFP-IRGM were subjected to immunoblotting. (I) The control and IRGM siRNA-transfected THP-1 cells lysates were subjected to immunoblotting. (J) Western blotting analysis with lysates from HEK293T cells transfected with HA-ASC and GFP or GFP-IRGM, untreated or treated with BafA1 or MG132. (K) CoIP analysis of interaction between FLAG-p62 and GFP-IRGM in HEK293T cell lysates. (L and M) Representative confocal images of HEK293T cells expressing (L) GFP-p62 and mcherry-IRGM (M) HA-p62, mcherry-IRGM, and GFP-NLRP3. (N) CoIP analysis of interaction between HA-p62 and GFP-NLRP3 in the absence and presence of FLAG-IRGM. (O) Graph depicts the quantification of GFP-NLRP3 band intensity in IP (normalized compared to inputs) (n = 3, mean ± SD, p ≤ 0.05, Student’s unpaired t test) (P) CoIP analysis of interaction between p62 and ASC in the absence and presence of IRGM in HEK293T cell. (Q) Analysis of degradation of NLRP3 in the absence and presence of IRGM and in HEK293T cells transfected with control siRNA and p62 siRNA. (R) Representative confocal images of HEK293T cells expressing mcherry-IRGM, GFP-Beclin-1, and NLRP3. (S) CoIP analysis of interaction between NLRP3 and Beclin-1 in the absence and presence of IRGM in HEK293T cells expressing the indicated plasmids. In order to reduce the artifact coming from IRGM-mediated degradation of NLRP3 and ASC, the inputs ratios were adjusted to have equal inputs in both the conditions, and the IP samples was run in the same ratios as of the inputs. Scale bars are as indicated in figures. S.E., short exposure; L.E., long exposure. See also Figures S2 and S3.
Figure 5
Figure 5
Both Autophagy and Inflammasome Assembly Defect Triggered by IRGM Leads to Inhibition of NLRP3 Inflammasome Activation (A and B) Analysis of regulation of autophagy flux in control and IRGM knockdown THP-1 cells stimulated with LPS (1 μg/mL, 3 hr) or (A) LPS +ATP (5 mM, 60 min) or (B) LPS+nigericin (5 μM, 15 min) with or without Bafilomycin A1 (300 nM, 3 hr). (C and D) Western blotting analysis of the DSS cross-linked insoluble and soluble fraction of HEK293T cells expressing (C) FLAG-ASC or (D) FLAG-NLRP3 and GFP or GFP-IRGM in absence or presence of chloroquine (50 μM, 5 hr). (E and F) CoIP analysis of interaction between (E) myc-ASC and HA-ASC or (F) GFP-NLRP3 and FLAG-NLRP3 in the absence and presence of GFP-IRGM in HEK293T cells treated or untreated with chloroquine (50 μM, 5 hr). (G–J) Average number of (G and I) ASC specks or (H and J) secreted IL-1 β from THP-1 GFP-ASC stable cells transfected with control and IRGM siRNA and stimulated with LPS+nigericin, in the absence and presence of (G and H) 3-MA (10 mM, 3 hr) or (I and J) p62 siRNA (n = 3, mean ± SD, p ≤ 0.05, ∗∗p ≤ 0.005, ∗∗∗p ≤ 0.0005, Student’s unpaired t test). (K–M) HEK293T cells transfected with NLRP3, HA-ASC, caspase-1, pro-IL-1β, GFP-IRGM, and GFP for 30 hr and (K and M) treated with chloroquine for next 6 hr or (L) transfected with ATG5 siRNA. (K and L) The cell lysates were subjected to western blotting and (M) supernatant used in ELISA to measure IL-1β. (n = 3, mean ± SD, p ≤ 0.05, ∗∗p ≤ 0.005, Student’s unpaired t test). S.E., short exposure; L.E., long exposure. See also Figures S4 and S5.
Figure 6
Figure 6
IRGM Protects from Caspase-Dependent Inflammatory Cell Death (A and B) Flow cytometry analysis of control and IRGM siRNA knockdown cells untreated or treated with LPS (1 μg/mL, 3 hr) and nigericin (5 μM, 30 min). Bar graphs show percentage of (A) PI positive or (B) Annexin V/PI double-positive cells. (C) Representative dot plot showing flow cytometry analysis of control and IRGM siRNA knockdown cells untreated or treated with LPS and nigericin. (D–G) Flow cytometry analysis of control and IRGM siRNA knockdown cells untreated or treated with LPS, MSU, cholesterol crystal, and ATP as indicated. Bar graph showing percentage of (D and F) PI positive and (E and G) Annexin V/PI double-positive cells. (H and I) The control and IRGM siRNA-transfected THP-1 cells treated with LPS and nigericin were subjected to immunoblot analysis with (H) Gasdermin D or (I) PARP1 and actin antibodies. (J and K) Flow cytometry analysis of control and IRGM siRNA knockdown cells untreated or treated with LPS, nigericin, and Z-VAD-FMK (5 μM, 30 min) as indicated. Bar graph showing the percentage of (J) PI positive and (K) Annexin V/PI double-positive cells. (L) Representative dot plot is showing flow cytometry analysis of control and IRGM siRNA knockdown cells untreated or treated with LPS and nigericin and Z-VAD FMK as depicted. (M and N) Western blot analysis of control and IRGM knockdown THP-1 cells untreated or treated with LPS, nigericin, and (M) Z-VAD-FMK or (N) Ac-YVAD-cmk. Unless otherwise stated, n = 3, mean ± SD, p ≤ 0.05∗∗p ≤ 0.005, ∗∗∗p ≤ 0.0005, #insignificant, Student’s unpaired t test). S.E., short exposure; L.E., long exposure. See also Figure S6.
Figure 7
Figure 7
Irgm1 Suppresses Colitis via Inhibition of NLRP3 Inflammasome (A) The qPCR analysis from the total RNA isolated from colon of DSS-treated Irgm1+/+ and Irgm1−/− knockout mice (n = 3, mean ± SE, p < 0.05, Student’s unpaired t test). (B and C) Western blot analysis with BMDM lysates from (B) untreated or (C) DSS-treated Irgm1+/+ and Irgm1−/− knockout mice with indicated antibodies. (D) Western blot analysis with colon lysates from DSS-treated Irgm1+/+ and Irgm1−/− mice. (E) Western blotting analysis of cross-linked insoluble and soluble cell fraction from LPS- and nigericin-treated Irgm1+/+ and Irgm1−/− BMDMs. (F) The quantification of activated caspase-1 (FLICA assay) in LPS- and nigericin-treated Irgm1+/+ and Irgm1−/− BMDM lysates. (G) Western blotting analysis from LPS- and Bafilomycin A1-treated Irgm1+/+ and Irgm1−/− BMDM cell lysates. (H) Graph depicting the percentage of change in body weight during the course of DSS treatment. (I) Representative pictures of colons of DSS- and MCC950-treated and -untreated Irgm1+/+ and Irgm1−/− mice. (J) Graph depicts colon length of DSS- and MCC950-treated and -untreated Irgm1+/+ and Irgm1−/− mice. (K) Western blot analysis from colon lysates of DSS- and MCC950-treated and -untreated Irgm1+/+ and Irgm1−/− mice. (L and M) The quantification of activated caspase-1 (FLICA assay) in (L) colon lysates of DSS and MCC950 or (M) BMDM lysates of LPS, nigericin, and MCC950 (1 μM)-treated and -untreated Irgm1+/+ and Irgm1−/− mice. (N) Western blot analysis from of LPS, nigericin, and MCC950 (1 μM)-treated or -untreated BMDM cell lysates from Irgm1+/+ and Irgm1−/− mice. Non-specific. (O and P) Quantification of active caspase-1 (caspase-1 FLICA assay) (O) and secreted IL-1β (ELISA) (P) in LPS- (100 ng/mL, 3 hr) and nigericin- (5 μM, 15 min) treated NLRP3-depleted BMDMs from Irgm1+/+ and Irgm1−/− mice. S.E., short exposure; L.E., long exposure. n = 3, mean ± SD, p < 0.05, ∗∗p < 0.005, ∗∗∗p < 0.0005, #insignificant Student’s t test unpaired). See also Figure S7.

Comment in

Similar articles

Cited by

References

    1. Alcocer-Gómez E., Cordero M.D. NLRP3 inflammasome: Common nexus between depression and cardiovascular diseases. Nat. Rev. Cardiol. 2017;14:124. - PubMed
    1. Bafica A., Feng C.G., Santiago H.C., Aliberti J., Cheever A., Thomas K.E., Taylor G.A., Vogel S.N., Sher A. The IFN-inducible GTPase LRG47 (Irgm1) negatively regulates TLR4-triggered proinflammatory cytokine production and prevents endotoxemia. J. Immunol. 2007;179:5514–5522. - PubMed
    1. Baskaran K., Pugazhendhi S., Ramakrishna B.S. Association of IRGM gene mutations with inflammatory bowel disease in the Indian population. PLoS ONE. 2014;9:e106863. - PMC - PubMed
    1. Brest P., Lapaquette P., Souidi M., Lebrigand K., Cesaro A., Vouret-Craviari V., Mari B., Barbry P., Mosnier J.F., Hébuterne X. A synonymous variant in IRGM alters a binding site for miR-196 and causes deregulation of IRGM-dependent xenophagy in Crohn’s disease. Nat. Genet. 2011;43:242–245. - PubMed
    1. Burada F., Plantinga T.S., Ioana M., Rosentul D., Angelescu C., Joosten L.A., Netea M.G., Saftoiu A. IRGM gene polymorphisms and risk of gastric cancer. J. Dig. Dis. 2012;13:360–365. - PubMed

Publication types

MeSH terms