. 2019 May 7;29(5):1061-1077.e8.
doi: 10.1016/j.cmet.2018.12.008. Epub 2019 Jan 3.

Obesity-Induced Cellular Senescence Drives Anxiety and Impairs Neurogenesis

Affiliations

Obesity-Induced Cellular Senescence Drives Anxiety and Impairs Neurogenesis

Mikolaj Ogrodnik et al. Cell Metab. .

Erratum in

  • Obesity-Induced Cellular Senescence Drives Anxiety and Impairs Neurogenesis.
    Ogrodnik M, Zhu Y, Langhi LGP, Tchkonia T, Krüger P, Fielder E, Victorelli S, Ruswhandi RA, Giorgadze N, Pirtskhalava T, Podgorni O, Enikolopov G, Johnson KO, Xu M, Inman C, Palmer AK, Schafer M, Weigl M, Ikeno Y, Burns TC, Passos JF, von Zglinicki T, Kirkland JL, Jurk D. Ogrodnik M, et al. Cell Metab. 2019 May 7;29(5):1233. doi: 10.1016/j.cmet.2019.01.013. Cell Metab. 2019. PMID: 31067450 Free PMC article. No abstract available.

Abstract

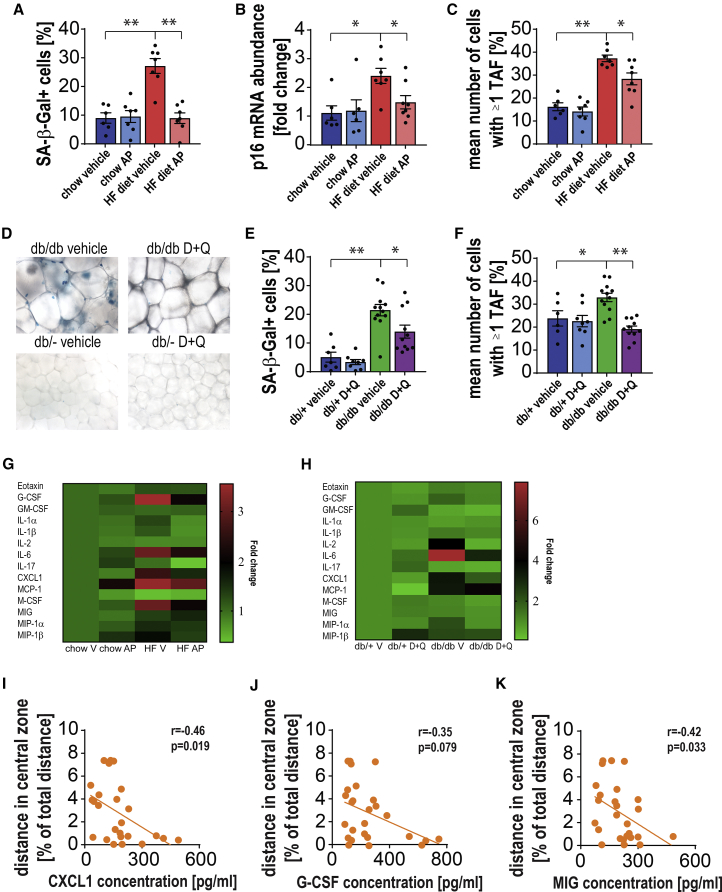
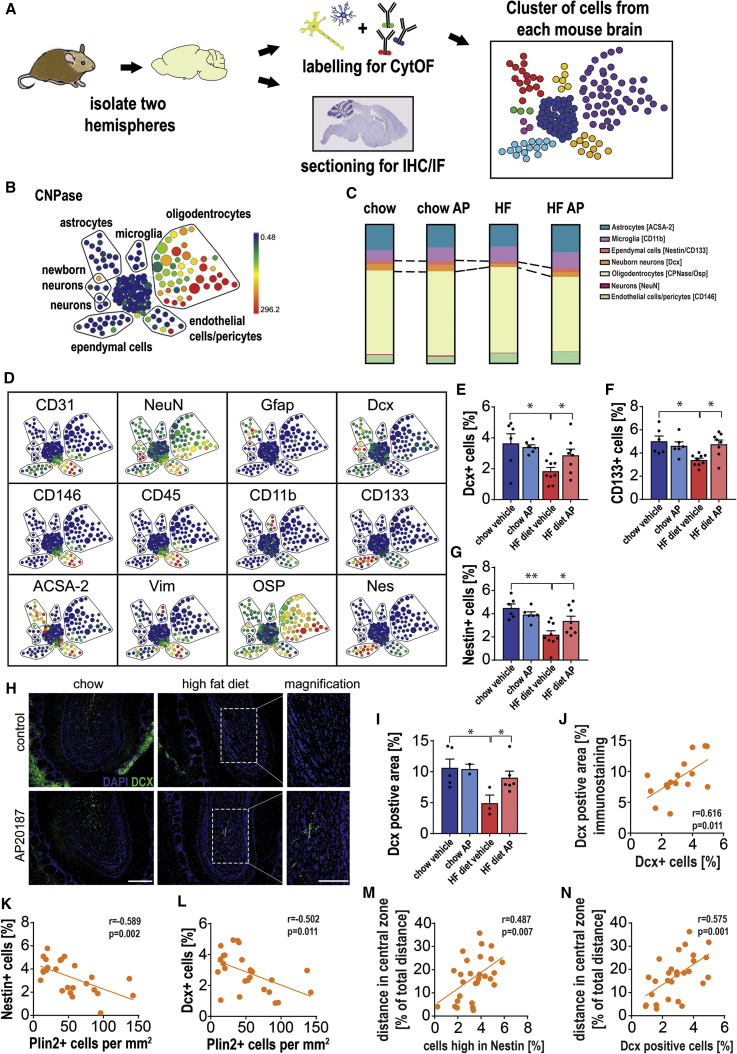
Cellular senescence entails a stable cell-cycle arrest and a pro-inflammatory secretory phenotype, which contributes to aging and age-related diseases. Obesity is associated with increased senescent cell burden and neuropsychiatric disorders, including anxiety and depression. To investigate the role of senescence in obesity-related neuropsychiatric dysfunction, we used the INK-ATTAC mouse model, from which p16Ink4a-expressing senescent cells can be eliminated, and senolytic drugs dasatinib and quercetin. We found that obesity results in the accumulation of senescent glial cells in proximity to the lateral ventricle, a region in which adult neurogenesis occurs. Furthermore, senescent glial cells exhibit excessive fat deposits, a phenotype we termed "accumulation of lipids in senescence." Clearing senescent cells from high fat-fed or leptin receptor-deficient obese mice restored neurogenesis and alleviated anxiety-related behavior. Our study provides proof-of-concept evidence that senescent cells are major contributors to obesity-induced anxiety and that senolytics are a potential new therapeutic avenue for treating neuropsychiatric disorders.

Keywords: aging; anxiety; anxiety-like behavior; brain; high-fat diet; lipid droplets; neurogenesis; obesity; senescence; stem cells.


Figures

None
Graphical abstract
Figure 1
Figure 1
Obese Mice Exhibit Anxiety-like Behavior that Is Not Directly Related to an Increase in Body Mass Behavior changes were tested in the open-field (OF) chamber. Dark rectangle marks the central area (25% of total area). (A) Representative movement traces (red lines) for chow- and high-fat diet (HFD)-fed mice at 10 months of age (baseline). (B and C) Parameters recorded and analyzed in OF: (B) distance traveled in the central area (as a function of total distance traveled) (t(54) = 2.359; p = 0.022) and (C) entries into the central area (U = 187, p = 0.0006). (D and E) No significant correlations (linear regression) were found in either chow or HFD animals between (D) body mass and the normalized distance mice traveled in the central area (r = 0.1024, p = 0.5972; r = −0.283, p = 0.1704) and (E) the number of entries into the central area (r = 0.09993, p = 0.606; r = −0.2692, p = 0.1933). (F) Representative heatmaps of time mice spent in the elevated plus maze (EPM) for chow and HFD mice. Closed arms of the maze are indicated by pink brackets. (G and H) (G) The frequency of head pokes into open arms (t(36.66) = 2.045; p = 0.048) and (H) the time mice spent with their head in open arms (U = 230, p = 0.0209) are significantly decreased in HFD mice when compared to chow-fed mice. (I and J) No substantial correlations were found between body mass and EPM test parameters in chow and HFD mice: (I) frequency of head pokes into open arms (r = −0.09171, p = 0.6361; r = −0.1927, p = 0.356) and (J) time spent in open arms (r = 0.1477, p = 0.4444; r = −0.000444, p = 0.9983). Data are from n = 25–30 mice per group. Mean ± SEM plotted. p ≤ 0.05 and ∗∗p ≤ 0.001.
Figure 2
Figure 2
Pharmacogenetic and Pharmacologic Clearance of Senescent Cells from Obese Mice Alleviates Obesity-Related Behavioral Changes (A) Eight-month-old C57Bl/6(INK-ATTAC) male mice were split into four groups and assigned to chow (n = 24) or high fat (HF, n = 30) diets and treated at 10 months of age with vehicle (n = 12 for chow and n = 15 for HF) or AP20187 (n = 12 for chow and n = 15 for HF) until 13 months of age. (B–D) (B) Open-field (OF) testing: representative movement traces (red lines) of lean and obese INK-ATTAC mice treated with/without AP20187 (AP) indicates that anxiety-like behavior of HFD mice can be alleviated by AP treatment as measured by (C) the normalized distance traveled in the central area of the OF box (U = 36, p = 0.0037; U = 64, p = 0.0453) and (D) increased frequency of entries into the central area. Alleviation of anxiety-like behavior of HFD mice was also observed in the EPM test (U = 10.5, p < 0.0001; U = 64.5, p = 0.0463). (E) Representative heatmap images of the time mice spent in open and closed sections of the EPM. Parameters were registered by EthoVision software. (F and G) (F) Frequency of head pokes into the open arms (U = 17.5, p < 0.0001; t(27) = 2.1; p = 0.0452) and the (G) time mice spent with their heads in the open area were significantly reduced with HFD and increased with AP (U = 26, p = 0.001; U = 59.5, p = 0.0472). (H) Representative movement traces (red lines) of db/db and heterozygous control mice with or without treatment with senolytic cocktail, dasatinib + quercetin (D+Q) in the OF test during a 30-min trial. (I and J) Data indicate an improvement in the anxiety-like behavior of db/db mice upon D+Q treatment determined by OF test parameters: (I) normalized distance traveled in the middle area (t(7.259) = 2.269, p = 0.0562; t(21) = 3.001, p = 0.0068) and (J) frequency of entries into the middle area of the OF box (U = 1, p < 0.0001; U = 24.5, p = 0.009). (K and L) In the OF test, INK-ATTAC;db/db mice (K) displayed a significant difference in the distance traveled in the central area after treatment with AP20187 compared to vehicle (U = 61; p = 0.0106), but (L) the number of entries into the central area was not significantly increased after treatment with AP (U = 85.5; p = 0.1096). Data are from n = 12–15 mice per group for (A)–(G); n = 8–12 mice per group for (H)–(J); n = 5–9 mice per group for (K)–(L). Mean ± SEM plotted. p ≤ 0.05 and ∗∗p ≤ 0.001.
Figure 3
Figure 3
Clearance of Senescent Cells from Obese Animals Reduces Circulating Cytokine Levels (A) Quantification of percentage of senescence-associated beta-galactosidase (SA-β-Gal)-positive cells in perigonadal adipose tissue shows increased values in HFD-fed animals and complete rescue after treatment with AP20187 (t(11) = 5.563, p = 0.0002; t(12) = 5.739, p < 0.0001). (B and C) Senescence markers (B) p16 (measured by RT-PCR) (U = 5, p = 0.0221; t(13) = 2.631, p = 0.0208) and (C) telomere associated DNA damage foci (TAF) (t(11) = 9.495, p < 0.0001; t(13) = 2.913, p = 0.0121) show a similar pattern. (D and E) (D) Representative images and (E) quantification of SA-β-Gal activity in perigonadal adipose tissue of db/db and db/+ mice shows that the percentage of SA-β-Gal-positive cells increases in db/db mice compared to db/+ and is significantly reduced after treatment with the senolytic cocktail, D+Q (t(17) = 5.615, p < 0.0001; t(21) = 2.504, p = 0.0206). (F) Frequencies of TAF-positive cells in perigonadal adipose tissue of db/db mice increased significantly in comparison to db/+ mice and decreased after D+Q treatment (t(16) = 2.612, p = 0.0189; t(21) = 5.937, p < 0.0001). (G) Cytokine protein expression [fold change] in blood plasma from HFD animals treated with/without AP20187. (H) Cytokine expression [fold change] in blood plasma from db/db animals treated with/without AP20187. (I–K) Linear regression analysis between anxiety markers and cytokines in blood plasma showed a significant negative correlation between (I) Cxcl-1 (r = −0.4663, p = 0.0188), (J) G-Csf (r = −0.3507, p = 0.079), (K) Mig (r = −0.4205, p = 0.0325), and the distance traveled in the central zone of the OF box in HFD-fed mice. Data are from n = 6–9 mice per group for (A)–(C) and (G); n = 7–12 mice per group for (E), (F), and (H); n = 27 mice per group for (I)–(K). Mean ± SEM plotted. p ≤ 0.05 and ∗∗p ≤ 0.001.
Figure 4
Figure 4
Markers of Senescence in the Amygdala Are Reduced after Treatment with AP20187 (A) p16-positive cells were measured by RNA-ISH in the basomedial layer of the amygdala (t(9) = 2.627, p = 0.0275; t(12) = 2.918, p = 0.0129). (B) Representative images showing telomere-associated DNA damage foci (TAF), (blue = DAPI, red = telomeres, green = γ-H2A.X, white arrow indicates TAF; scale bars, 5 μm) in 3-μm-thick paraffin embedded brain sections. (C and D) (C) Mean number of TAF (t(9) = 2.221, p = 0.0535; t(12) = 2.874, p = 0.014) and (D) percentage of NeuNpos cells with 2 or more TAF (t(4.298) = 3.943, p = 0.0147; t(11) = 3.854, p = 0.0027) was increased in HFD INK-ATTAC mice and was significantly reduced after AP20187 treatment in the basomedial layer of the amygdala. (E and F) (E) Mean number of TAF (t(11) = 4.449, p = 0.001; U = 2, p=0.0062) and (F) percentage of NeuNneg cells with 2 or more TAF (t(11) = 4.501, p = 0.0009; U = 1, p = 0.0031) were increased in HFD INK-ATTAC mice and significantly reduced after AP20187 treatment in the hypothalamus in close proximity to the 3rd ventricle. Data are from n = 5–6 mice per group for (B)–(D); Mean ± SEM plotted. p ≤ 0.05 and ∗∗p ≤ 0.001.
Figure 5
Figure 5
Obesity-Related Accumulation of Lipid Droplets in Senescent Periventricular Glia Is Reduced upon Senescent Cell Clearance (A) Representative images of perilipin 2 (Plin2) staining showing accumulation of cells exhibiting a buildup of lipid droplets in close proximity to the lateral ventricle (LV) of middle-aged, obese mice compared to their lean littermates. Scale bars, 200 μm/50 μm (for magn.) (B) Quantification of frequencies of Plin2+ cells in the proximity (up to 250 μm from the ependymal cell layer) to the LV in high-fat diet (HFD)-fed and lean mice (t(11) = 4.48, p = 0.0009). (C) Representative images showing Plin2+ cells co-localizing with markers of microglia (Iba1; top left panel) and astrocytes (vimentin [Vim]; top right panel), but not with neuronal markers (NeuN; bottom panel, scale bars, 20 μm). (D) Pie chart shows cell-type composition of Plin2+ cells, determined after immunostaining for Plin2 and different cell-type markers, as shown in (C). (E) Periventricular Plin2+ glial cells show increased numbers of the senescence marker, telomere-associated foci (TAF). Quantification of the mean number of TAF per cell in non-neuronal (NeuNneg) Plin+ and Plin cells (t(10) = 2.475, p = 0.0328). (F) Representative images show the LV of chow (top panel) and HFD AP20187-treated mice stained with Plin2, exhibiting reduced lipid droplets. Scale bars, 200 μm/50 μm (for magn.) (G) Quantification of cells containing lipid droplets (Plin2+) in the periventricular area of lean HF INK-ATTAC mice with or without AP20187 treatment (t(11) = 4.48, p = 0.0009; t(9.362) = 3.28, p = 0.0091). (H) Quantification of frequencies of NeuNneg, TAF-positive cells in the periventricular region of lean/HFD and vehicle- or AP20187-treated mice (t(10) = 3.128, p = 0.0107; t(13) = 2.693, p = 0.0184). (I) Representative images showing double staining for CXCL1 (RNA-ISH in red) and Plin2 (green) in the periventricular area of HF INK-ATTAC mice. White arrows indicate CXCL1 and Plin2 double positive cells (scale bars, 50 μm/10 μm for mag.). Cells magnified in panel 4 encircled in red show positive staining for Plin2 and CXCL1, whereas white-bordered cells are not double positive. (J and K) Quantification of cells positive for (J) Cxcl1 (t(10) = 8.017, p < 0.0001) and (K) Il-6 (t(10) = 8.298, p < 0.0001) stained by RNA-ISH indicate that Plin+ cells display significantly higher expression levels of the SASP factors, Il-6 and Cxcl1, than Plin cells. (L and M) Buildup of fat in periventricular brain region as assessed by Plin2 staining significantly correlates with parameters associated with anxiety-like behavior: (L) percentage of distance traveled in the central zone (percentage of central zone) (r = −0.6475, p = 0.0005) and (M) number of entries into the central zone (entries) in OF testing (r = −0.6976, p = 0.0001). Data are from n = 5–8 mice per group for (B), n = 6 mice per group for (E), (J), and (K), n = 4–8 mice per group for (G) and (H), and n = 25 mice per group for (L) and (M). Mean ± SEM plotted. p ≤ 0.05 and ∗∗p ≤ 0.001.
Figure 6
Figure 6
ALISE Phenotype Drives CCF Accumulation and the SASP Similar to glia in the brains of obese mice, mouse adult fibroblasts (MAFs) show an accumulation of lipids in senescence (ALISE) phenotype. (A–F) Depletion of lipids from culture media reduces area of lipid droplets in MAFs. (A) The ALISE phenotype in MAFs is characterized by an increased area of lipid droplets surrounded by Plin2 vesicles (scale bars, 20 μm). (B) Quantification of Nile Red-positive staining in non-senescent young (you) and senescent (sen) MAFs (p < 0.0001, p = 0.0004). (C and D) Suppression of the ALISE phenotype reduces frequencies of cytoplasmic chromatin fragments (CCF) in senescent fibroblasts (p < 0.0001, p = 0.0006) (scale bars, 10 μm), but (E) and (F) does not affect number of 53BP1 DNA damage foci (p = 0.0973) (scale bars, 10 μm). (G–K) Senescent fibroblasts show increased secretion of SASP components including Il-6, KC (Cxcl1), and Ip-10 (Cxcl10) that is alleviated upon suppression of the ALISE phenotype. (G) Heatmap shows fold change in secretion of SASP components in cell culture media over a 72-hr time period when compared to non-senescent fibroblasts cultured with lipid-containing media. Each square represents a separate biological replicate, i.e., MAFs isolated from a different mouse donor. Concentration of SASP components in culture media with and without lipids (ALISE phenotype suppression) for (H) Il-6 (p = 0.0003, p < 0.0001), (I) Ip-10 (Cxcl10) (p = 0.0002, p = 0.0008), (J) Vegf (p = 0.6407, p = 0.003), and (K) Kc (Cxcl1) (p = 0.0114, p = 0.0075). (L) Images show accumulation of lipid droplets in senescent but not non-senescent GFAP-positive astrocytes (scale bars, 20 μm). (M–O) Characterization of senescence in astrocytes. Senescent astrocytes show (M) the ALISE phenotype measured using Nile Red staining (t(2.034) = 11.32, p = 0.0073), (N) increased frequencies of telomere dysfunction measured as the frequency of cells with 1 or more telomere associated DNA damage focus (TAF) (t(4) = 12.45, p = 0.0002), and (O) increased frequencies of CCF (t(2) = 7.551, p = 0.0171). Senescence was induced by X-ray irradiation (10Gy) and established within 14–21 days post-irradiation. Data are from n = 3–6 mice per group. Mean ± SEM plotted. p ≤ 0.05 and ∗∗p ≤ 0.001.
Figure 7
Figure 7
Clearance of Senescent Cells Partially Reverses the Neural Progenitor Cell Depletion Induced by Obesity (A) Each hemisphere of INK-ATTAC lean and high-fat (HF) mouse brains was either dissociated into a single-cell suspension or processed for IHC/IF. Dissociated brain cells were labeled with metal-conjugated antibodies and processed for cytometry by time of flight (CyTOF). (B and D) Spanning-tree progression analysis of density-normalized events (SPADE) was performed on brain cell populations identified by markers shown on the micrographs. Heatmap shows the intensity of the antibody signal, and the size of each spot is determined by the number of cells within this population. (C) CyTOF shows differences in brain cell populations of INK-ATTAC chow- and HFD-fed mice, which were treated with vehicle or AP20187. (E–G) Frequencies of cells expressing the markers (E) doublecortin (Dcx) (t(13) = 3.057, p = 0.0092; t(15) = 2.236, p = 0.041), (F) CD133 (t(6.291) = 3.339, p = 0.0146; t(9.674) = 3.383, p = 0.0073), and (G) Nestin (t(13) = 4.405, p = 0.0007; t(15) = 2.217, p = 0.0425) were quantified. (H) Representative images of Dcx staining in the olfactory bulb of chow- and HFD-fed mice treated with vehicle or AP20187 (scale bars, 250 μm). White boxes show magnified regions (scale bars, 200 μm). (I and J) (I) Quantitative analysis of the Dcx-positive area of the granular layer in the olfactory lobe of lean and obese INK-ATTAC mice (t(6) = 2.707, p = 0.0352; U = 1, p = 0.0476) and (J) correlation between area occupied by Dcx+ cells in the granular layer of the olfactory bulb and frequencies of Dcx+ cells from the whole brain measured by CyTOF (r = 0.616, p = 0.0111). (K and L) Correlations (linear regression analysis) between frequencies of periventricular glia exhibiting accumulation of lipid droplets and frequencies of cells expressing markers of neurogenesis and ependymal cells (determined by CyTOF): (K) Nestin (r = −0.5887, p = 0.002) and (L) Dcx (r = −0.5022, p = 0.0105). (M and N) Correlations (linear regression analysis) between distance traveled in the central zone and the frequencies of cells expressing (M) Nestin (r = 0.487, p = 0.0074) and (N) Dcx (r = 0.5749, p = 0.0011) (determined by CyTOF). Data are from n = 5–9 mice per group for (C)–(G); n = 2–6 mice per group for (I); n = 11 mice per group for (J); n = 29 mice per group for (K)–(N). Mean ± SEM plotted. p ≤ 0.05 and ∗∗p ≤ 0.001.

References

    1. Acosta J.C., Banito A., Wuestefeld T., Georgilis A., Janich P., Morton J.P., Athineos D., Kang T.-W., Lasitschka F., Andrulis M. A complex secretory program orchestrated by the inflammasome controls paracrine senescence. Nat. Cell Biol. 2013;15:978–990. - PMC - PubMed
    1. Adhikari A., Lerner T.N., Finkelstein J., Pak S., Jennings J.H., Davidson T.J., Ferenczi E., Gunaydin L.A., Mirzabekov J.J., Ye L. Basomedial amygdala mediates top–down control of anxiety and fear. Nature. 2015;527:179–185. - PMC - PubMed
    1. Ambrosi T.H., Scialdone A., Graja A., Gohlke S., Jank A.M., Bocian C., Woelk L., Fan H., Logan D.W., Schürmann A. Adipocyte accumulation in the bone marrow during obesity and aging impairs stem cell-based hematopoietic and bone regeneration. Cell Stem Cell. 2017;20:771–784.e6. - PMC - PubMed
    1. Anacker C., Hen R. Adult hippocampal neurogenesis and cognitive flexibility - linking memory and mood. Nat. Rev. Neurosci. 2017;18:335–346. - PMC - PubMed
    1. Baar M.P., Brandt R.M.C., Putavet D.A., Klein J.D.D., Derks K.W.J., Bourgeois B.R.M., Stryeck S., Rijksen Y., van Willigenburg H., Feijtel D.A. Targeted apoptosis of senescent cells restores tissue homeostasis in response to chemotoxicity and aging. Cell. 2017;169:132–147.e16. - PMC - PubMed

Publication types

MeSH terms