. 2019 Jan 21;29(2):268-282.e8.
doi: 10.1016/j.cub.2018.11.065. Epub 2019 Jan 3.

Kinesin-3 Responds to Local Microtubule Dynamics to Target Synaptic Cargo Delivery to the Presynapse

Affiliations

Kinesin-3 Responds to Local Microtubule Dynamics to Target Synaptic Cargo Delivery to the Presynapse

Pedro Guedes-Dias et al. Curr Biol. .

Abstract

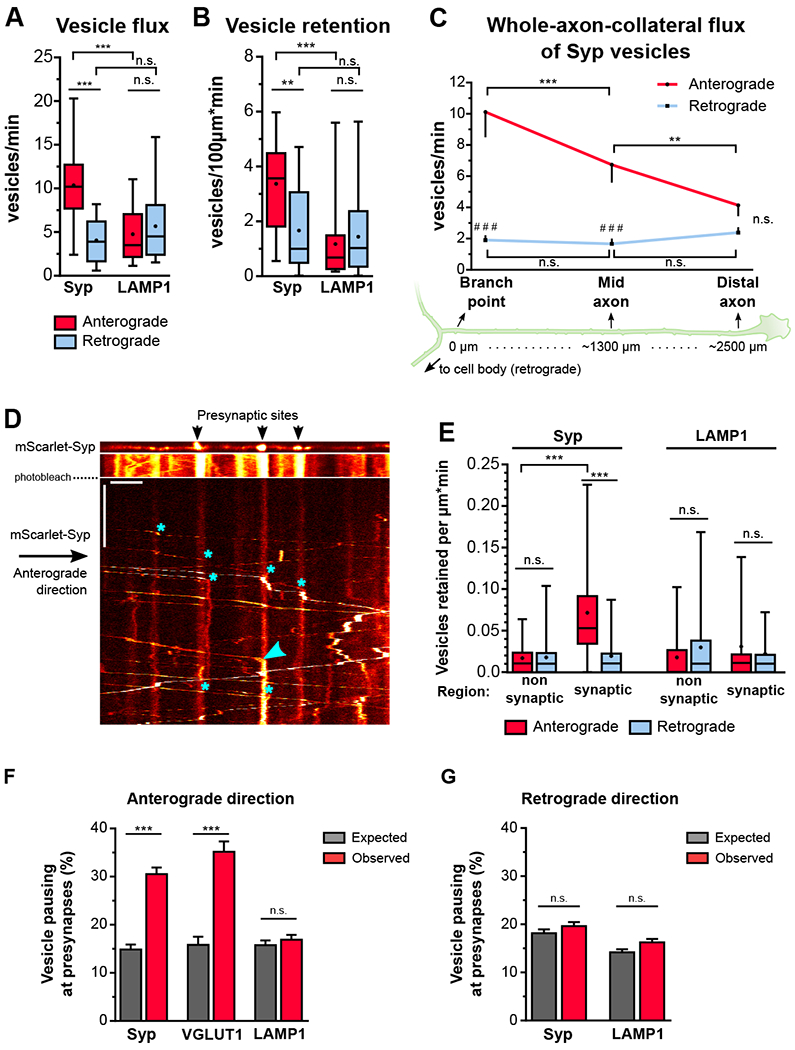
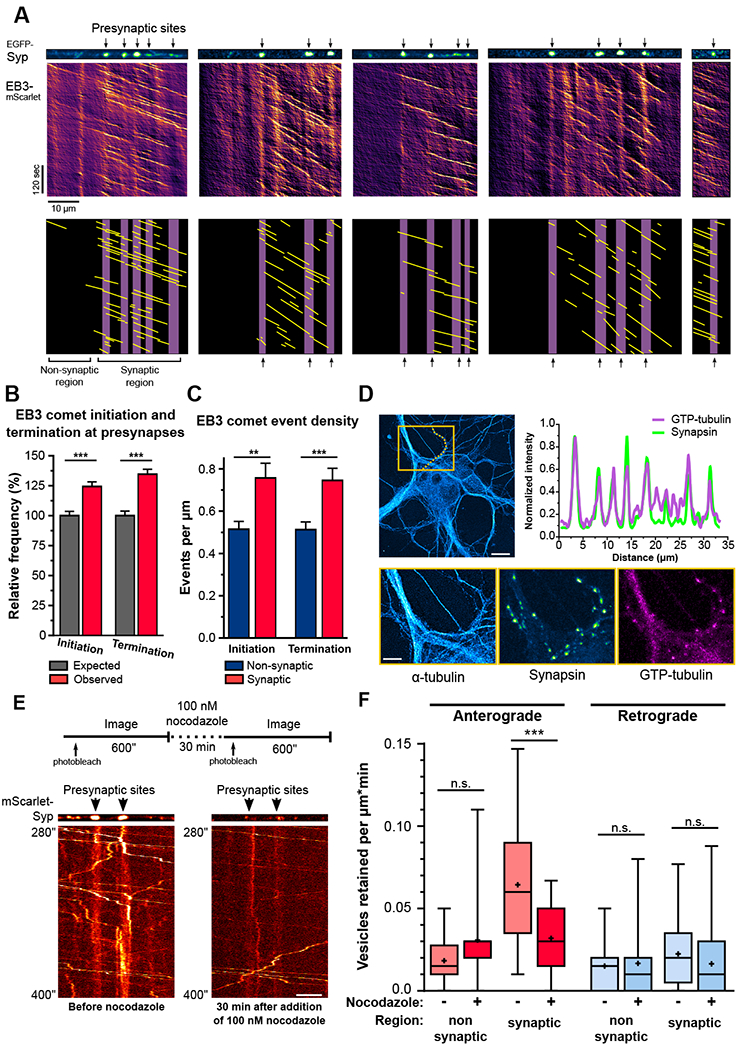
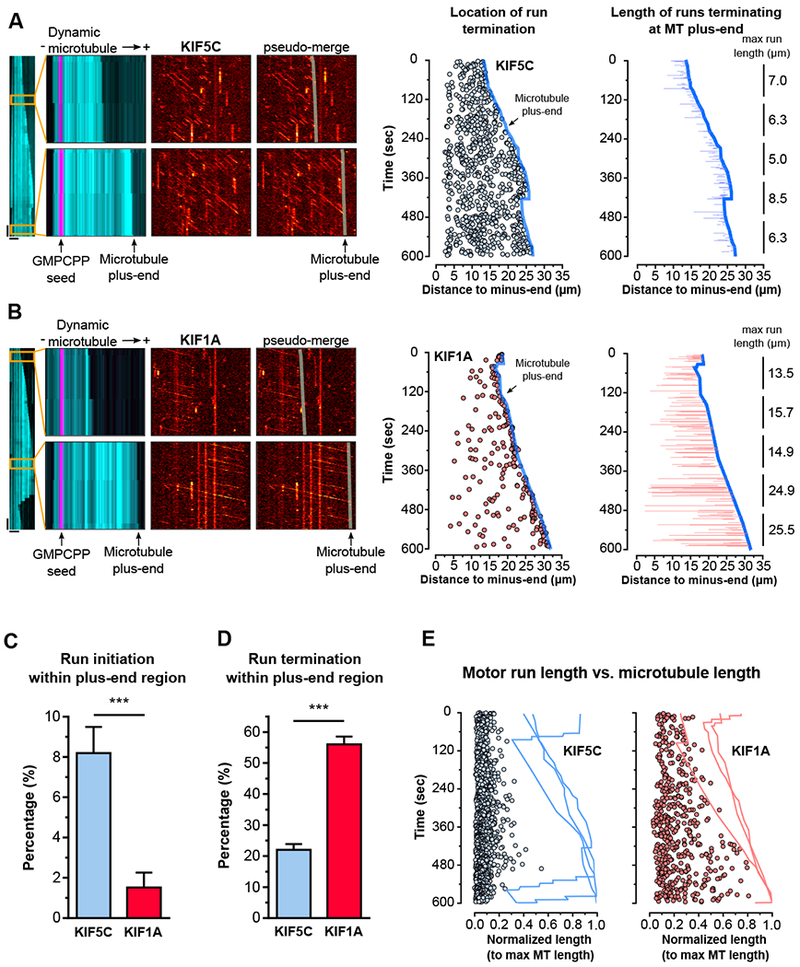
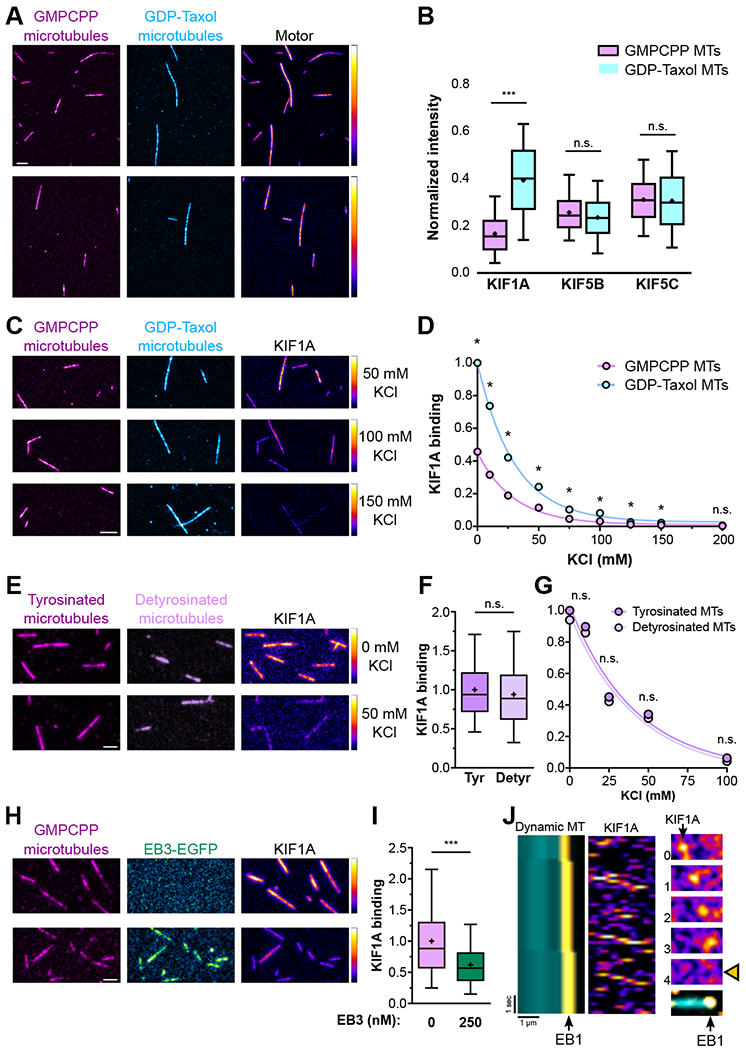
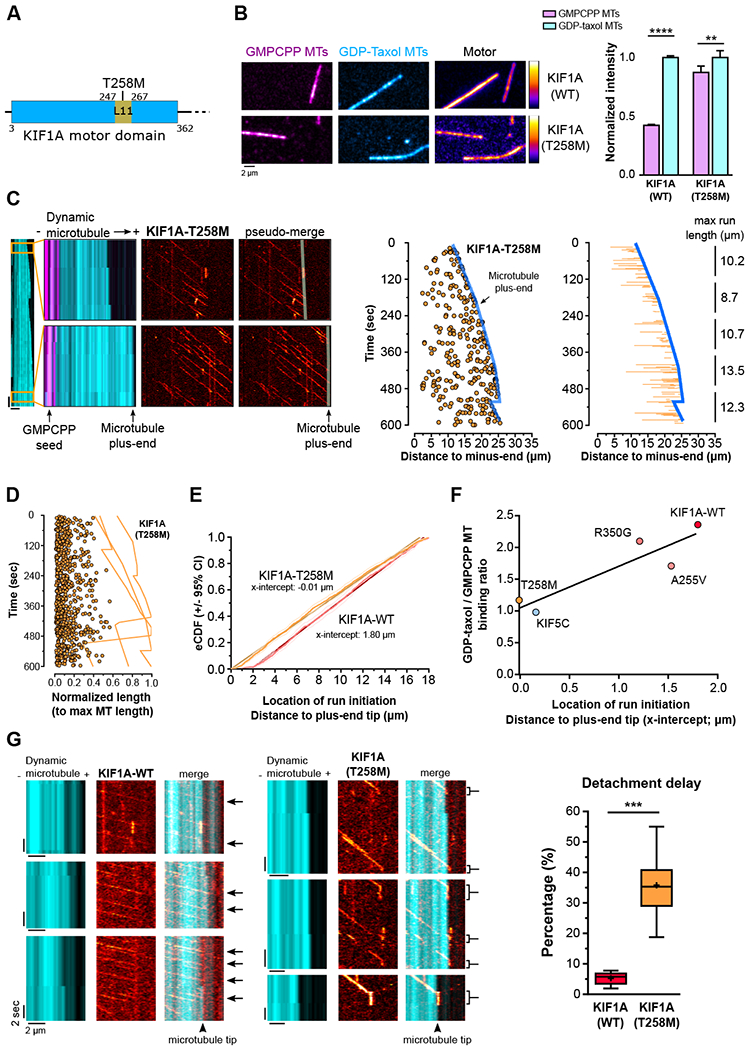
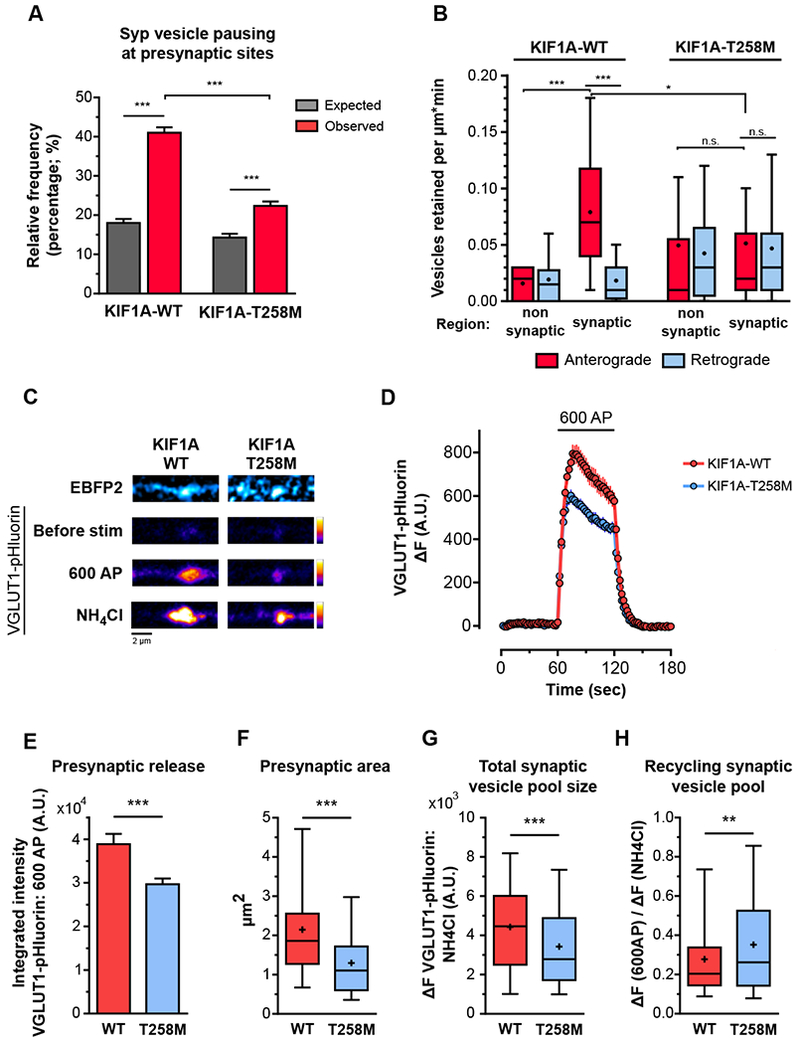
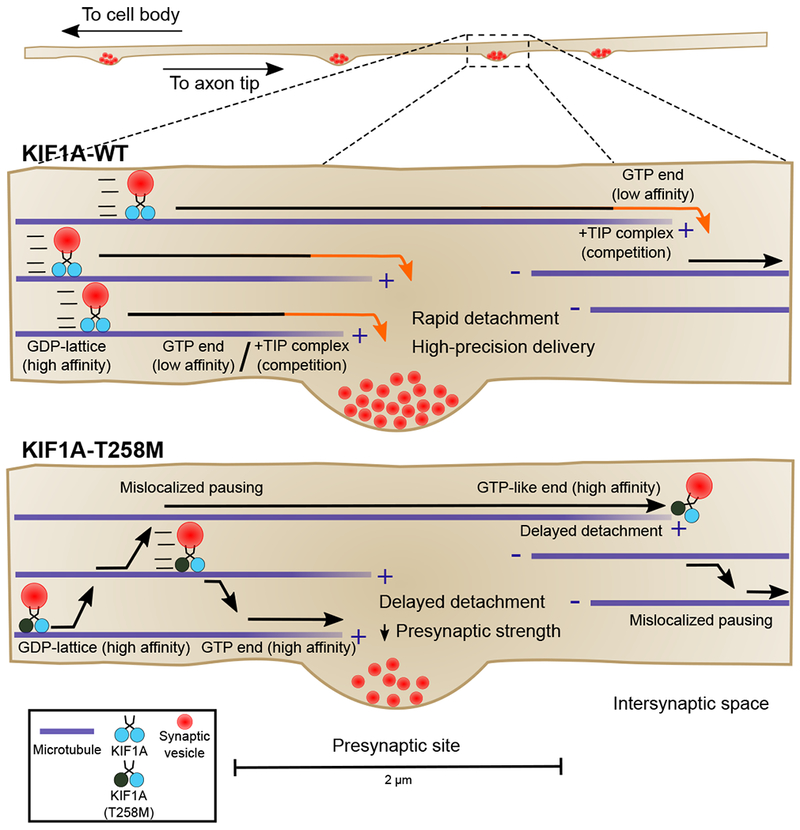
Neurons in the CNS establish thousands of en passant synapses along their axons. Robust neurotransmission depends on the replenishment of synaptic components in a spatially precise manner. Using live-cell microscopy and single-molecule reconstitution assays, we find that the delivery of synaptic vesicle precursors (SVPs) to en passant synapses in hippocampal neurons is specified by an interplay between the kinesin-3 KIF1A motor and presynaptic microtubules. Presynaptic sites are hotspots of dynamic microtubules rich in GTP-tubulin. KIF1A binds more weakly to GTP-tubulin than GDP-tubulin and competes with end-binding (EB) proteins for binding to the microtubule plus end. A disease-causing mutation within KIF1A that reduces preferential binding to GDP- versus GTP-rich microtubules disrupts SVP delivery and reduces presynaptic release upon neuronal stimulation. Thus, the localized enrichment of dynamic microtubules along the axon specifies a localized unloading zone that ensures the accurate delivery of SVPs, controlling presynaptic strength in hippocampal neurons.

Keywords: KIF1A; axonal transport; dynein; kinesin; microtubule dynamics; synaptic strength; synaptic vesicles.


Conflict of interest statement

Author Contributions

The authors declare no competing interests.

Figures

Figure 1.
Figure 1.. Retention of anterograde-moving axonal SVPs at presynaptic sites is preceded by highly precise pausing.
A) Flux and retention (B) of axonal SVPs and LAMP1 vesicles (n=18-21 axons from 5 independent cultures; n.s., not significant, **p<0.01, ***p<0.001; two-way ANOVA with Sidak’s post-hoc test). C) Flux of SVPs along non-branching whole-axon collaterals (n=8 axons from 3 independent cultures; (*) compares between axonal regions, (#) compares between directions; n.s., not significant, **p<0.01, ***/###p<0.001; two-way ANOVA with Sidak’s post-hoc test). D) Motility of SVPs along an axonal section of an mScarlet-Syp expressing neuron. Upper panel: still showing presynaptic sites (Syp clusters); lower panels: kymograph of Syp-positive vesicles. The axonal section was photobleached to allow the clear visualization and tracking of the SVP motile fraction. Asterisks show seven representative pausing sites of anterograde-moving Syp-vesicles and the arrowhead points to a retention event. E) Retention of axonal SVPs and LAMP1 vesicles at synaptic and non-synaptic regions (n=31-46 regions per group from 14-18 axons from 3-4 independent cultures; n.s., not significant, ***p<0.001; two-way ANOVA with Tukey’s post-hoc test). F) Relative frequency of anterograde- and (G) retrograde-moving Syp, VGLUT1 and LAMP1 vesicle pauses within 1μm of presynapse centroid (Syp: 1139 anterograde pauses, 2322 retrograde pauses and 40 presynaptic sites observed in 6 axons from 3 independent cultures; average±SEM spacing between presynapses=18.3±4.0μm; VGLUT1: 465 anterograde pauses, and 38 presynaptic sites observed in 7 axons from 2 independent cultures; spacing between presynapses=12.1±1.3μm; LAMP1: 1469 anterograde pauses, 2905 retrograde pauses, and 56 presynaptic sites detected in 10 axons from 4 independent cultures; spacing between presynapses=21.8±7.3μm; average±SD; n.s. not significant, ***p<0.0001; oneway ANOVA with Sidak’s post-hoc test. See also Figure S1, S2, and S3.
Figure 2.
Figure 2.. Enrichment of dynamic microtubule plus-ends at presynaptic sites specifies SVP delivery and retention.
A) Microtubule dynamics on five different axonal sections co-expressing EGFP-Syp and EB3-mScarlet. Lower panels are the annotated kymographs with purple bars representing the presynaptic area and the yellow lines the trajectories of EB3 comets. B) Relative frequency of EB3 comet initiation and termination events within 1μm of presynapse centroids. (n=3211 EB3 initiation events, 3169 EB3 termination events, and 554 presynaptic sites observed in 57 axons from 5 independent cultures; average±SEM spacing between presynapses=14.1±1.4μm; average±SD; ***p<0.0001; one-way ANOVA with Sidak’s post-hoc test. C) Density of EB3 initiation and termination events in synaptic and non-synaptic regions (n=57 axons from 5 independent cultures; average±SEM; **p<0.01, ***p<0.001; Mann-Whitney U test). D) Enrichment of GTP-tubulin at presynaptic sites.. Upper panels: orange box represents inset area; line scan (orange dotted line) shows the synapsin and GTP-tubulin intensity plots along a synaptically connected axon. Lower panels: insets of the α-tubulin, synapsin, and GTP-tubulin channels. E) Experimental design for imaging SVP delivery in the same axonal section before and after nocodazole addition and representative kymographs. F) SVP retention before and after 30 min of 100nM nocodazole treatment (n=25 synaptic and 12 non-synaptic regions from 7 axons from 3 independent cultures; n.s., not significant, ***p<0.001; two-way ANOVA with Sidak’s post-hoc test). See also Figure S4.
Figure 3.
Figure 3.. Processive runs of the SVP motor KIF1A terminate preferentially at dynamic microtubule plus-ends and their length is coupled to the microtubule length.
A) KIF5C(1-560)-HaloTag motility on dynamic microtubules. Left panel shows full kymograph of dynamic microtubule channel. Insets: upper panel shows early time point when the microtubule is short; Left, overlay of dynamic microtubule (cyan) and GMPCPP-stabilized microtubule seed (magenta) channels, (−) and (+) represent the microtubule minus- and plus-end; Center, KIF5C channel; Right, overlay of a line representing the growing microtubule plus-end on the KIF5C channel. Horizontal scale bars: 10 μm; Vertical scale bars: 30 sec. The plot in the middle represents the location of KIF5C run terminations (blue circles) along a growing dynamic microtubule (dark blue line; microtubule plus-end), respective to the distance to the minus-end of that microtubule. The plot on the right shows the length of KIF5C runs (blue lines) that terminated at the plus-end (dark blue line). The numbers refer to the maximum KIF5C run-length observed in 120 seconds periods over 10 minutes. B) same as (A), but for KIF1A(1-393)-HaloTag. C) Percentage of runs initiating and D) terminating within 2μm of a microtubule plus-end (n=1035-1755 runs from 4-6 microtubules; average±95%CI). E) Circles represent KIF1A (red) and KIF5C (blue) run lengths observed on three representative microtubules and normalized to the maximum length of the microtubule they were observed on. The line traces show the dynamic profile of the representative microtubules along time. See also Figure S5 and S6.
Figure 4.
Figure 4.. Binding of KIF1A to the microtubule lattice is negatively affected by GTP-tubulin and EB proteins, but not tubulin tyrosination.
A) Binding and B) quantification of KIF1A, KIF5B, and KIF5C to GMPCPP- and GDP-taxol-stabilized microtubules in the presence of AMP-PNP (n=1004-5855 microtubules per condition; n.s., non-significant, ***p<0.0001; one-way ANOVA with Sidak’s post-hoc test). C) Binding and D) quantification of KIF1A binding to GMPCPP- and GDP-taxol-stabilized microtubules under increasing ionic strength. Circles show mean intensity values; the 95% confidence intervals are too narrow and not visible in the graph. (n=398-2491 microtubules). E) Binding and F) quantification of KIF1A binding to fully tyrosinated and detyrosinated GMPCPP-stabilized microtubules G) under increasing ionic strength. Circles show mean intensity values; the 95% confidence intervals are too narrow and not visible in the graph. (n=2709-6737 microtubules). H) Binding and I) quantification of KIF1A binding to GMPCPP-stabilized microtubules in the presence or absence of EB3 (n=13569-14309 microtubules). J) Representative kymographs and stills depictingKIF1A motors rapidly detaching from a microtubule at the EB1 comet region (asterisks). The stills on the right show one of these events (each time point integrates a 150 msec interval).
Figure 5.
Figure 5.. Weak binding to GTP-tubulin is mediated by the Loop 11 region of the KIF1A motor domain and is important for rapid KIF1A detachment from microtubules.
A) KIF1A motor domain. The T258M mutation affects a residue located in KIF1A motor domain loop 11. B) Panels and quantification showing KIF1A-WT and -T258M(1-393)-HaloTag binding to GMPCPP- and GDP-taxol-stabilized microtubules. (n=2303-2351 microtubles per group; average±95%CI; **p<0.01,****p<0.0001; Kruskal-Wallis with Dunn’s post-hoc test). C) same as Figure 3A-B and D) same as Figure 3E but for KIF1A-T258M(1-393)-HaloTag, which is represented in orange. E) eCDF showing the location of KIF1A-WT (red) and KIF1A-T258M (orange) run initiation, respective to the plus-end tip. X-intercepts represent the location on the microtubule where run initiations starts to follow a random pattern. (KIF1A-WT, n=1035 runs from 6 microtubules; KIF1A-T258M, n=1628 runs from 5 microtubules). F) Correlation between GDP-taxol/GMPCPP microtubules binding ratio and distance of run initiation to the plus-end tip. (KIF5C: n=1755 runs from 4 microtubules; KIF1A-WT: n=1035 runs from 6 microtubules; KIF1A-A255V: n=702 runs from 4 microtubules; KIF1A-T258M: n=1628 runs from 5 microtubules; KIF1A-R350G: n=596 runs from 4 microtubules; GDP/GMPCPP MT binding ratio – KIF5C-WT: n=5855/4000; KIF1A-WT: n=2491/2303; KIF1A-A255V: n=2130/1046; KIF1A-T258M: n=2351/2351; KIF1A-R350G: n=2106/1162). G) KIF1A-WT rapidly detaches from microtubules once it reaches the microtubule plus-end, whereas KIF1A-T258M frequently lingers at the microtubule plus-end before detaching. See also Figure S5, S6, and Table S1.
Figure 6.
Figure 6.. The KIF1A-T258M disease mutant disturbs presynaptic SVP delivery and decreases presynaptic strength in hippocampal neurons.
A) Relative frequency of anterograde-moving Syp vesicle pauses within 1μm of presynapse centroid in KIF1A-WT-EGFP- and KIF1A-T258M-EGFP-positive neurons. (KIF1A-WT: 1249 anterograde pauses and 32 presynaptic sites observed in 5 axons from 2 independent cultures; average±SEM spacing between presynapses=12.6±1.9 μm; KIF1A-T258M: 1321 anterograde pauses, and 25 presynaptic sites observed in 6 axons from 2 independent cultures; average±SEM spacing between presynapses=25.2±7.4 μm; average±SD; ***p<0.0001; one-way ANOVA with Sidak’s post-hoc test). B) Retention of anterograde- and retrograde-moving SVPs at synaptic and non-synaptic regions along the axons of KIF1A-WT and KIF1A-T258M-positive neurons (n=14-34 regions per group from 8 axons from 2-3 independent cultures; n.s., not significant, *p<0.05, ***p<0.001; Kruskal-Wallis with Dunn’s post-hoc test). C) Representative images of presynaptic sites of KIF1A-WT-EBFP2- (left) and KIF1A-T258M-EBFP2-positive neurons (right) co-expressing VGLUT1-pHluorin. The EBFP2 signal is shown on the upper panel. The lower panels show the VGLUT1-pHluorin signal at baseline, under electric field stimulation, and after luminal alkalinization with NH4Cl. Plot of VGLUT1-pHluorin signal in KIF1A-WT-EBFP2- and KIF1A-T258M-EBFP2-positive neurons before, during, and after a train of 600 action potential (AP) at 10 Hz. Integrated intensity of the VGLUT1-pHluorin signal during the 600 AP stimulation paradigm (average±SD). F) Area of the presynaptic VGLUT1-pHluorin signal, under stimulation. G) VGLUTI-pHluorin signal intensity at active presynapses after alkalinization with NH4Cl. H) Recycling pool of synaptic vesicles. (n=233-245 presynaptic sites from 3 independent cultures; **p<0.01, ***p<0.0001; Mann-Whitney U test). See also Figure S6.
Figure 7.
Figure 7.. Weak binding affinity to GTP-like microtubules facilitates KIF1A detachment from dynamic microtubule plus-ends and efficient local delivery of presynaptic cargo.
Model for local delivery of SVPs at en passant synapses.

References

    1. Wilhelm BG, Mandad S, Truckenbrodt S, Krohnert K, Schafer C, Rammner B, Koo SJ, Classen GA, Krauss M, Haucke V, et al. (2014). Composition of isolated synaptic boutons reveals the amounts of vesicle trafficking proteins. Science 344, 1023–1028. - PubMed
    1. Truckenbrodt S, Viplav A, Jahne S, Vogts A, Denker A, Wildhagen H, Fornasiero EF, and Rizzoli SO (2018). Newly produced synaptic vesicle proteins are preferentially used in synaptic transmission. The EMBO journal. - PMC - PubMed
    1. Shepherd GM, Raastad M, and Andersen P (2002). General and variable features of varicosity spacing along unmyelinated axons in the hippocampus and cerebellum. Proceedings of the National Academy of Sciences of the United States of America 99, 6340–6345. - PMC - PubMed
    1. Rizzoli SO (2014). Synaptic vesicle recycling: steps and principles. The EMBO journal 33, 788–822. - PMC - PubMed
    1. Okada Y, Yamazaki H, Sekine-Aizawa Y, and Hirokawa N (1995). The neuron-specific kinesin superfamily protein KIF1A is a unique monomeric motor for anterograde axonal transport of synaptic vesicle precursors. Cell 81, 769–780. - PubMed

Publication types