. 2019 Jan 14;35(1):81-94.e7.
doi: 10.1016/j.ccell.2018.11.017. Epub 2019 Jan 3.

Hyper-Editing of Cell-Cycle Regulatory and Tumor Suppressor RNA Promotes Malignant Progenitor Propagation

Affiliations

Hyper-Editing of Cell-Cycle Regulatory and Tumor Suppressor RNA Promotes Malignant Progenitor Propagation

Qingfei Jiang et al. Cancer Cell. .

Abstract

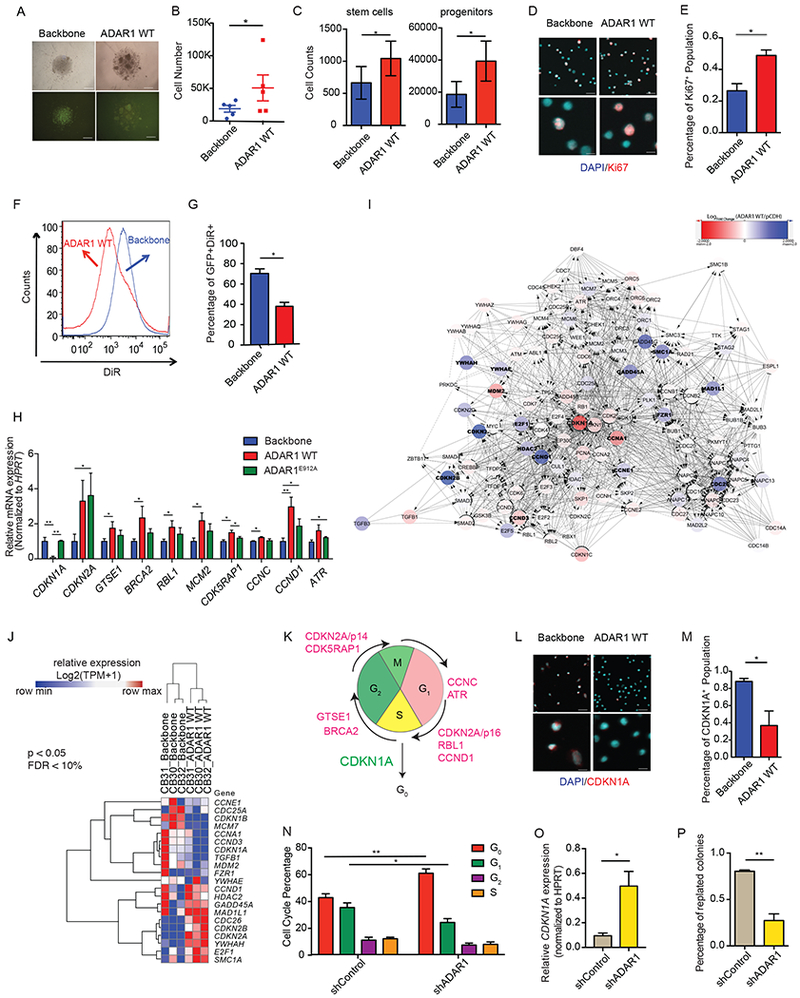
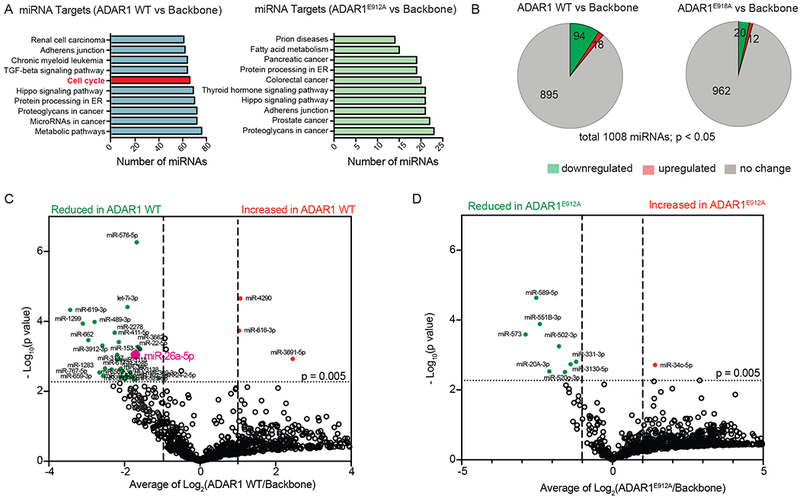
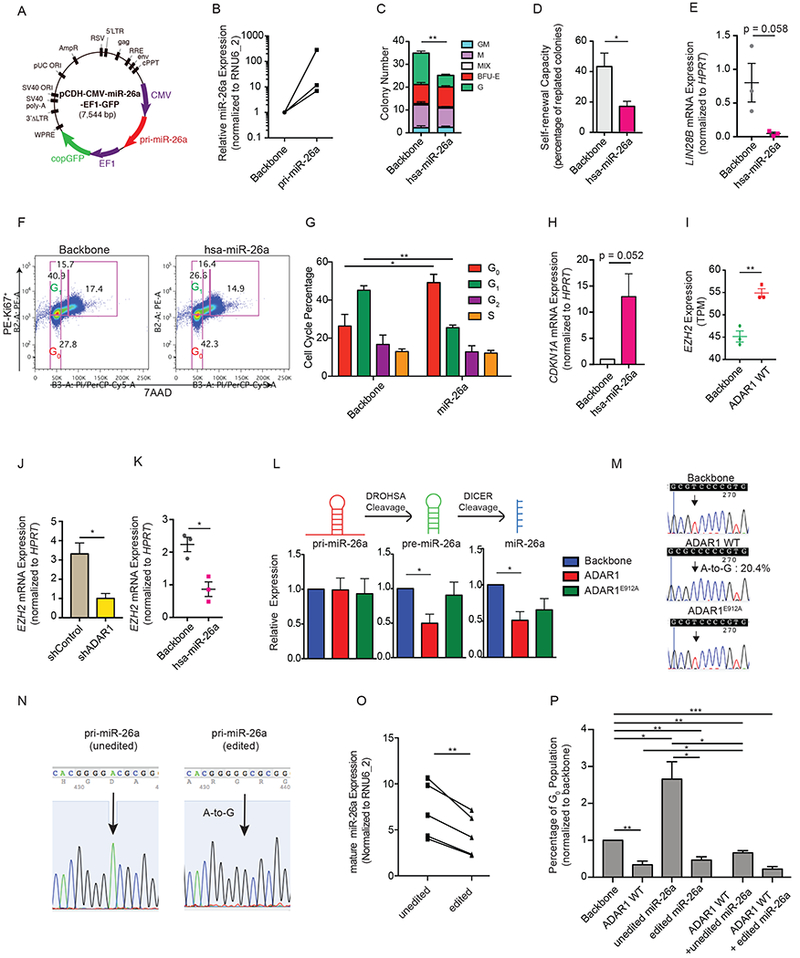
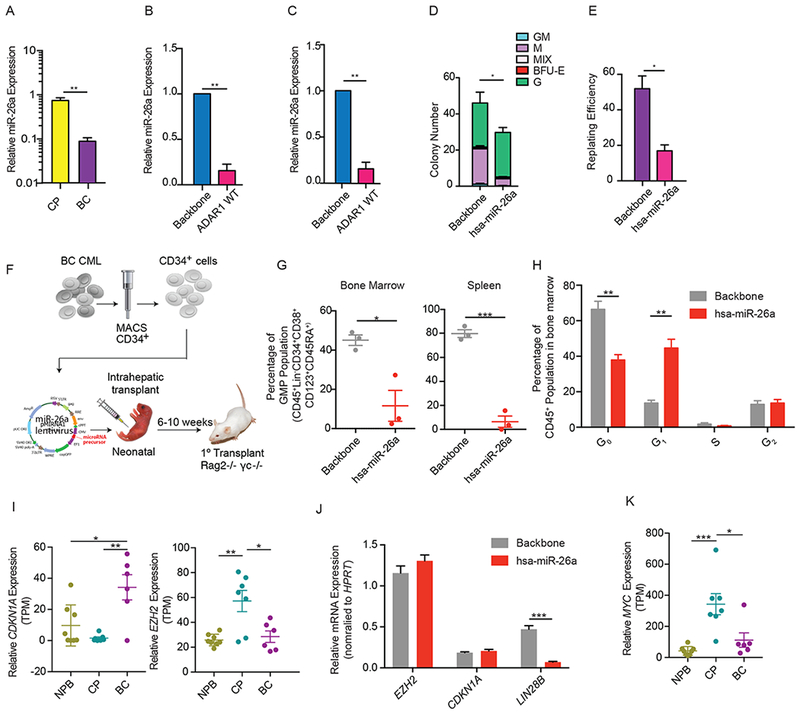
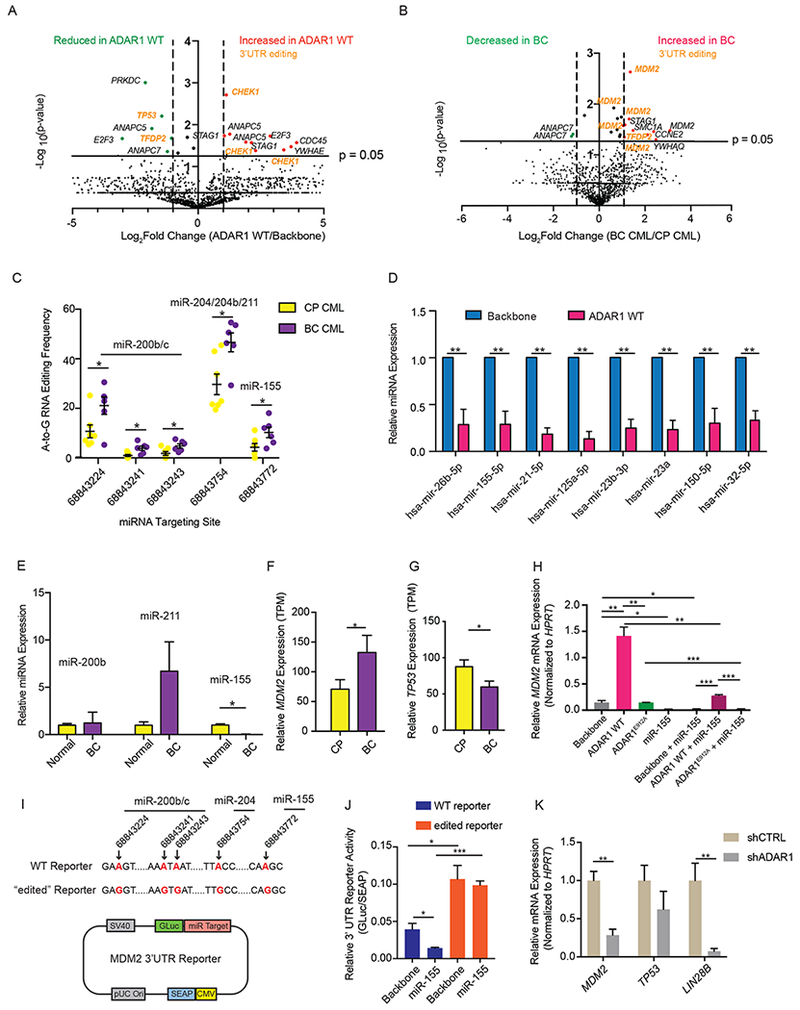
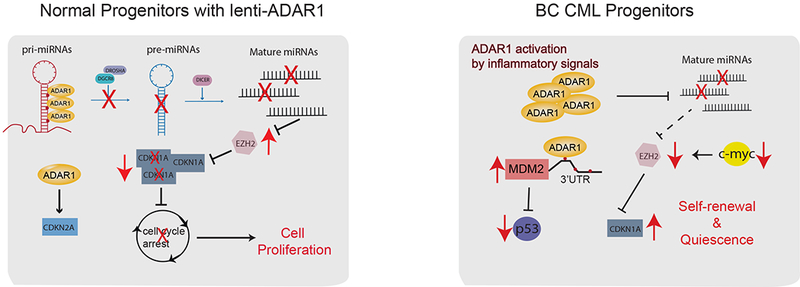
Adenosine deaminase associated with RNA1 (ADAR1) deregulation contributes to therapeutic resistance in many malignancies. Here we show that ADAR1-induced hyper-editing in normal human hematopoietic progenitors impairs miR-26a maturation, which represses CDKN1A expression indirectly via EZH2, thereby accelerating cell-cycle transit. However, in blast crisis chronic myeloid leukemia progenitors, loss of EZH2 expression and increased CDKN1A oppose cell-cycle transit. Moreover, A-to-I editing of both the MDM2 regulatory microRNA and its binding site within the 3' UTR region stabilizes MDM2 transcripts, thereby enhancing blast crisis progenitor propagation. These data reveal a dual mechanism governing malignant transformation of progenitors that is predicated on hyper-editing of cell-cycle-regulatory miRNAs and the 3' UTR binding site of tumor suppressor miRNAs.

Keywords: 3′ UTR; ADAR1; RNA hyper-editing; cancer stem cell; cell cycle; chronic myeloid leukemia; epitranscriptome; leukemia; microRNAs; progenitors; self-renewal.


Conflict of interest statement

DECLARATION OF INTERESTS

C. Jamieson was a co-founder of Impact Biomedicines Inc, which was acquired by Celgene, and holds stock in Forty Seven Inc.

Figures

Figure 1.
Figure 1.. ADAR1 regulates cell cycle in normal hematopoiesis.
(A) Representative picture of ADAR1-WT or lentiviral backbone transduced cord blood CD34+ cells. (B and C) Cell counts of total cell number (B), stem cells (CD34+CD38Lin), and progenitors (CD34+CD38+Lin) (C) following ADAR1 WT overexpression in cord blood CD34+ cells (n=3). (D and E) Representative image of Ki67 immunofluorescent staining in ADAR1 WT-expressing cord blood CD34+ cells (D) and the corresponding calculation of Ki67+ cells (n=3). (F and G) Representative flow cytometry of DiR tracing in cord blood CD34+ cells transduced with backbone control or ADAR1 WT (F) and the corresponding calculation of GFP+DiR+ cells (G) (n=3). (H) Significant differential expressed cell cycle transcripts were determined by qRT-PCR array of 84 transcripts on cord blood HSPC (n=5) transduced with ADAR1 WT, ADAR1E912A, or lentiviral vector control. (I) Cytoscape analysis of differentially expressed transcripts of KEGG Cell Cycle Pathway in ADAR1 WT-transduced cord blood (n=3) versus lentiviral vector control (n=3) by whole transcriptome RNA-seq. (J) RNA-seq quantification on ADAR1 WT-transduced cord blood (n=3) and lentiviral vector control (n=3) for genes corresponding to the KEGG Cell Cycle Pathway visualized in a heatmap (p<0.05, FDR <10%). (K) Representative image of ADAR1-mediated differentially expression targets in cell cycle stages. (L and M). Representative images (L) and quantification (M) of immunofluorescent staining of CDKN1A protein in ADAR1 WT-expressing CD34+ cells (n=3). (N) Cell cycle analysis in cord blood CD34+ HSPC transduced with shRNA targeting ADAR1 (shADAR1) or control shRNA (shControl) as measured by flow cytometry of Ki-67 and 7AAD (n=4). (O). CDKN1A expression measured by qRT-PCR in cord blood CD34+ HSPC (n=3). (P) Percentage of replated colonies in cord blood CD34+ HSPC transduced with shADAR1 or shControl (n=3). All graphs show mean with SEM and statistical analysis was calculated using the Student’s t-test. *p<0.05, **p<0.005, ***p<0.0005. See also Figure S1 and Table S1.
Figure 2.
Figure 2.. Regulation of miRNome by ADAR1 in normal cord blood CD34+ HSPC.
(A) Top ten significantly affected pathways by differentially expressed miRNAs targeted by ADAR1 WT or ADAR1E912A compared with lentiviral backbone. (B) Pie chart of differentially expressed miRNAs in cord blood CD34+ HSPC overexpression ADAR1 WT or ADAR1E912A compared with backbone vector control (n=3-4) derived from miRNome array of 1008 miRNAs. (C and D) Volcano plot analysis derived from miRNome showing significantly differentially expressed miRNAs (p<0.005, Student’s t-test, Log2Fold change >2) between cord blood CD34+ cells transduced with backbone vector control and those with lenti-ADAR1 WT (C) or between cord blood CD34+ cells transduced with backbone vector control and those with lenti-ADAR1E912A (D) (n=3-4). See also Table S2.
Figure 3.
Figure 3.. Important role of miR-26a in self-renewal capacity of normal hematopoietic progenitors
(A) Lentiviral construct for human primary (pri-) miR-26a expression. (B) The expression of mature miR-26a was determined by qRT-PCR in cord blood CD34+ HSPC transduced with pri-miR-26a lentivirus (n=3). (C and D) The total colony number (C) and the percentage of replated colonies in cord blood CD34+ cells overexpressing hsa-miR-26a or the backbone control (n=3). (E) Expression of LIN28B in cord blood CD34+ HSPC overexpressing hsa-miR-26a or the backbone control (n=3). (F) Representative cell cycle flow analysis of CB CD34+ HSPC (n=3) transduced with either backbone or hsa-miR-26a overexpression lentivirus. (G) Flow cytometry analysis of cell cycle transit in cord blood CD34+ HSPC overexpressing hsa-miR-26a or the backbone control (n=3). (H) Expression of CDKN1A mRNA level was determined by qRT-PCR in cord blood CD34+ HSPC overexpressing hsa-miR-26a or the backbone control (n=3). (I) EZH2 expression evaluated by RNA-seq in cord blood CD34+ cells transduced with backbone control of ADAR1 WT (n=3). (J and K). Examination of EZH2 expression in cord blood CD34+ cells with either ADAR1 knockdown by shRNA (J) or overexpression of hsa-miR-26a (K) (n=3). (L) Expression of primary (pri-), precursor (pre-) and mature miR-26a transcripts was measured by qRT-PCR in cord blood CD34+ HSPCs transduced with backbone, ADAR1 WT, or ADAR1E912A (n=3). (M) The A-to-I RNA editing efficiency was determined by TOPO sequencing of blood CD34+ cells overexpressing backbone, ADAR1 WT, or ADAR1E912A (n=3). 20.4% of colonies examined contain A-to-G change at the DROSHA cleavage site. The arrow pointed to the A-to-G mutation site, reverse sequenced as T-to-C change. (N) Confirmation of lentiviral constructs of “unedited” and “edited” pri-miR-26a. The arrow points to the A-to-I (G) mutation site. (O) HEK293T cells were transfected with “unedited” or “edited” pri-miR-26a lentivirus, and the mature miR-26a expression was determined by qRT-PCR (n=5 experiments). (P) Cell cycle flow analysis of G0 population in HEK293T cells transduced with ADAR1 WT in combination with “unedited” or “edited” miR-26a (n=3 experimental triplicate). All graphs show mean with SEM and statistical analysis was calculated using the Student’s t-test. *p<0.05, **p<0.005, ***p<0.0005. See also Figure S2.
Figure 4.
Figure 4.. Reduced miR-26a enhances self-renewal capacity of CML Progenitors.
(A) Expression of mature miR-26a in CML CP (n=3) and CML BC (n=3) CD34+ cells measured by qRT-PCR (n=3). (B) miR-26a expression in CML CP CD34+ cells transduced with backbone control or ADAR1 WT examined by miRNA PCR array (n=3). (C) Validation of miR-26a expression in CP CML CD34+ cells transduced with backbone control or ADAR1 WT lentivirus by qRT-PCR (n=3). (D and E) Number of colonies formed in primary colony-formation assay (D) and percentage of secondary colonies formed after replating primary colonies (E) in BC CML CD34+ cells transduced with backbone control or hsa-miR-26a (n=3). (F) Experimental design of in vivo xenograft mouse studies. (G) Percentage of granulocyte macrophage progenitors (GMP) engraftment in the bone marrow or spleen of Rag2−/−γc−/− mice transplanted with BC CD34+ cells overexpressing control or hsa-miR-26a (n=3 mice per group). (H) Cell cycle flow analysis of backbone or lenti-miR-26a transduced CD34+ cells isolated from engrafted BC bone marrow (n=3 mice per group). (I) RNA-seq analysis of CDKN1A and EZH2 expression in CP (n=7) and BC CML (n=6). (J) Expression of EZH2, CDKN1A, and LIN28B in BC CD34+ cells transduced with backbone control or hsa-miR-26a (n=3). (K) RNA-seq analysis of the expression of MYC in CP (n=7) and BC CML (n=6). All graphs show mean with SEM and statistical analysis was calculated using the Student’s t-test. *p<0.05, **p<0.005, ***p<0.0005. See also Figure S3.
Figure 5.
Figure 5.. Differential A-to-I RNA editing in 3’UTR regions of normal HSPCs and BC LSC.
(A and B) Volcano plot showing the A-to-I(G) editome of cell cycle genes in ADAR1 WT-transduced cord blood CD34+ cells compared with lentiviral vector controls (n=3) (A) and in CP progenitors (n=7) compared with BC counterparts (n=6) (B). (C) A-to-I RNA editing of MDM2 3’UTR in individual CP (n=7) and BC (n=6) samples. The predicted miRNA binding sites within MDM2 3’UTR using miRcode transcriptome-wide miRNA target prediction tool were shown (Jeggari et al., 2012). (D) Relative miRNA expression determined by miRNA qPCR array of 84 miRNAs in CML CP CD34+ cells transduced with backbone or ADAR1 WT (n=3). (E) Relative miRNA expression in normal aged-matched (>55 year old) CD34+ cells (n=4) and BC CML CD34+ cells (n=3). (F and G) The expression of MDM2/p53 pathway transcripts, MDM2 (F) and TP53 (G) in progenitor population of normal peripheral blood (NPB), CML CP (n=7), and CML BC (n=6) determined by RNA-seq. (H) MDM2 expression in HEK293T cells transduced with ADAR1 WT, ADAR1E912A alone or in combination with miR-155 (n=3 experiments). (I) Structure of “wt” or “edited” MDM2 3’UTR reporter construct with A-to-(I)G changes introduced at miRNA targeting sites (highlighted in red). The genomic loci of A-to-(I)G changes were also indicated with arrows. (J) The MDM2 3’UTR reporters were transfected into HEK293T cells and then challenged with miR-155 overexpressing lentivirus (n=3 experimental triplicate). The miRNA targeting efficiency was measured as the relative luciferase activity (GLuc/SEAP ratio). (K) MDM2 and LIN28B expression in BC CML CD34+ cells with shControl or shADAR1 (n=3). All graphs show mean with SEM and statistical analysis was calculated using the Student’s t-test. *p<0.05, **p<0.005, ***p<0.0005. See also Figure S4 and Table S3.
Figure 6.
Figure 6.
Summary of A-to-I RNA editing function in normal HSPCs and BC LSC.

References

    1. Abrahamsson AE, Geron I, Gotlib J, Dao KH, Barroga CF, Newton IG, Giles FJ, Durocher J, Creusot RS, Karimi M, et al. (2009). Glycogen synthase kinase 3beta missplicing contributes to leukemia stem cell generation. Proceedings of the National Academy of Sciences of the United States of America 106, 3925–3929. - PMC - PubMed
    1. Aken BL, Ayling S, Barrell D, Clarke L, Curwen V, Fairley S, Fernandez Banet J, Billis K, Garcia Giron C, Hourlier T, et al. (2016). The Ensembl gene annotation system. Database (Oxford) 2016. - PMC - PubMed
    1. Batzer MA, and Deininger PL (2002). Alu repeats and human genomic diversity. Nat Rev Genet 3, 370–379. - PubMed
    1. Beguelin W, Teater M, Gearhart MD, Calvo Fernandez MT, Goldstein RL, Cardenas MG, Hatzi K, Rosen M, Shen H, Corcoran CM, et al. (2016). EZH2 and BCL6 Cooperate to Assemble CBX8-BCOR Complex to Repress Bivalent Promoters, Mediate Germinal Center Formation and Lymphomagenesis. Cancer Cell 30, 197–213. - PMC - PubMed
    1. Chen J, Zhang K, Xu Y, Gao Y, Li C, Wang R, and Chen L (2016). The role of microRNA-26a in human cancer progression and clinical application. Tumour Biol 37, 7095–7108. - PubMed

Publication types

MeSH terms