. 2018 Nov 12;8(21):5842-5854.
doi: 10.7150/thno.26888. eCollection 2018.

Arg1 expression defines immunosuppressive subsets of tumor-associated macrophages

Affiliations

Arg1 expression defines immunosuppressive subsets of tumor-associated macrophages

Sean P Arlauckas et al. Theranostics. .

Abstract

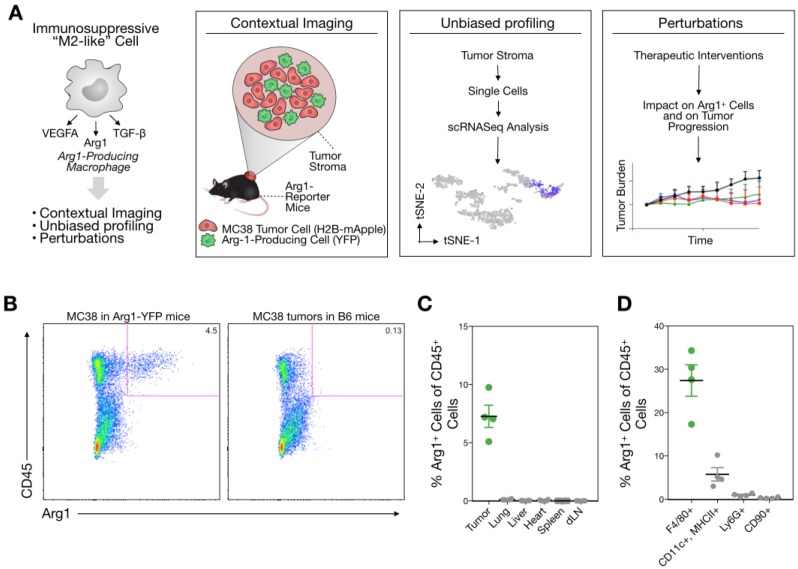
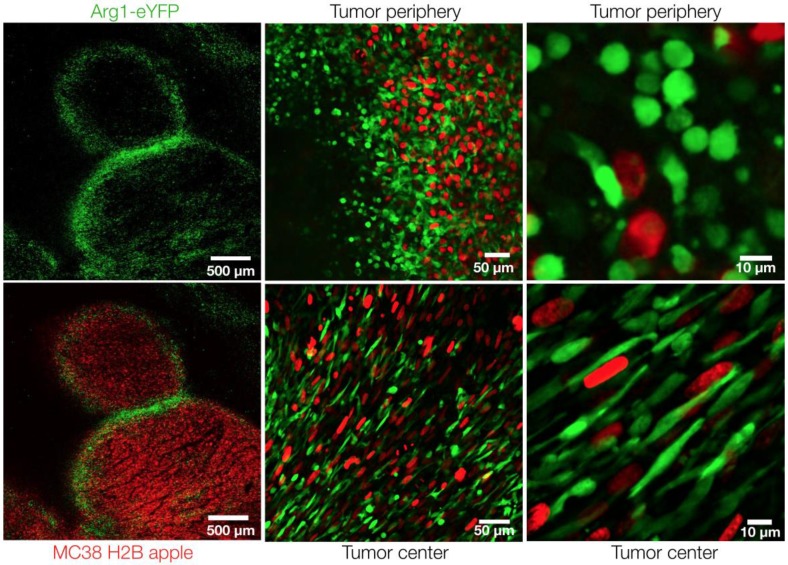
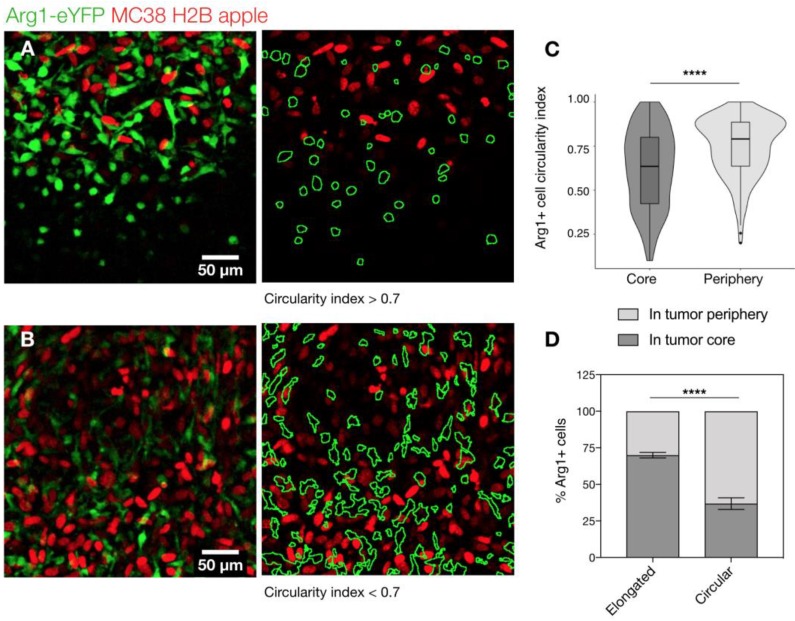
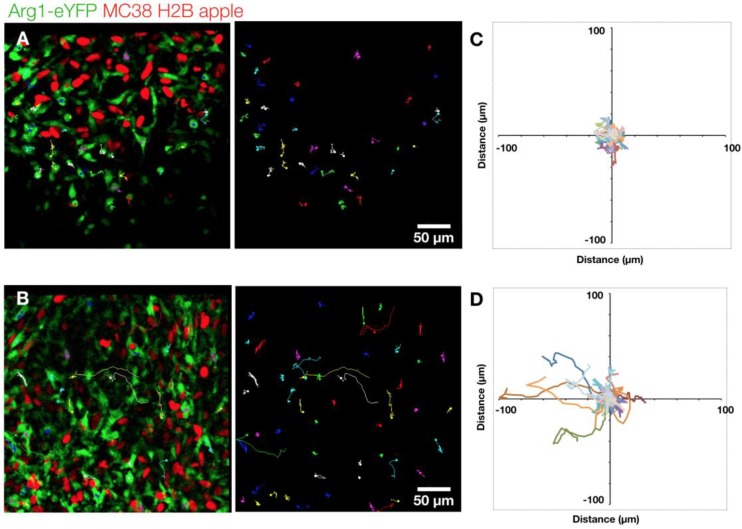
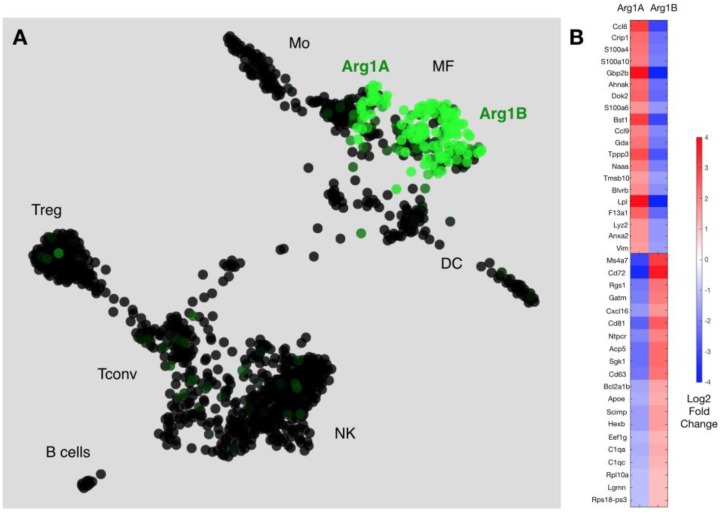
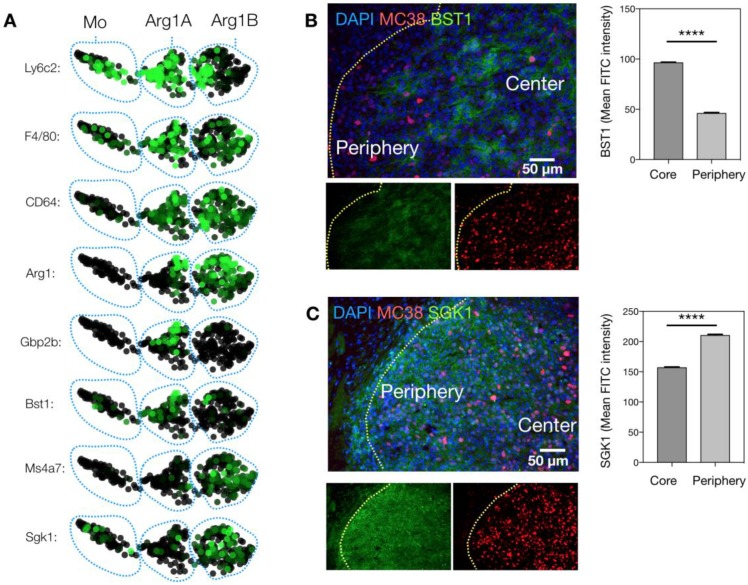
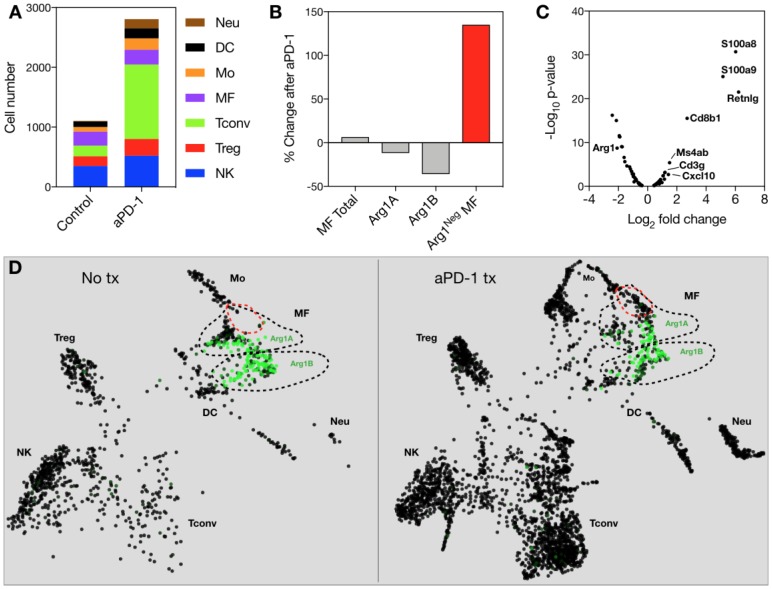
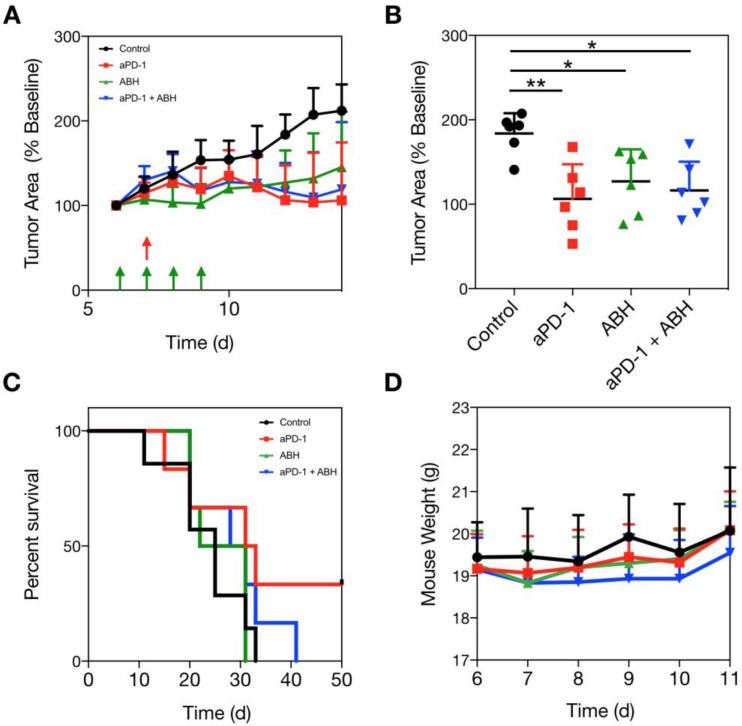
Tumor-associated macrophages (TAM) have attracted attention as they can modulate key cancer-related activities, yet TAM represent a heterogenous group of cells that remain incompletely characterized. In growing tumors, TAM are often referred to as M2-like macrophages, which are cells that display immunosuppressive and tumorigenic functions and express the enzyme arginase 1 (Arg1). Methods: Here we combined high resolution intravital imaging with single cell RNA seq to uncover the topography and molecular profiles of immunosuppressive macrophages in mice. We further assessed how immunotherapeutic interventions impact these cells directly in vivo. Results: We show that: i) Arg1+ macrophages are more abundant in tumors compared to other organs; ii) there exist two morphologically distinct subsets of Arg1 TAM defined by previously unknown markers (Gbp2b, Bst1, Sgk1, Pmepa1, Ms4a7); iii) anti-Programmed Cell Death-1 (aPD-1) therapy decreases the number of Arg1+ TAM while increasing Arg1- TAM; iv) accordingly, pharmacological inhibition of arginase 1 does not synergize with aPD-1 therapy. Conclusion: Overall, this research shows how powerful complementary single cell analytical approaches can be used to improve our understanding of drug action in vivo.

Keywords: PD1; arginase; cancer; immunotherapy; macrophage.


Conflict of interest statement

Competing Interests: The authors have declared that no competing interest exists.

Figures

Figure 1
Figure 1
Arg1 is an immunosuppressive signal found predominantly on TAM. (A) Macrophages polarized toward immunosuppressive phenotype express Arg1. Single cell strategies to explore Arg1-producing macrophages in tumors, including intravital microscopy and scRNA seq. (B) Representative flow cytometry plots of MC38 tumor cells from an Arg1-eYFP reporter mouse (left) compared to a wild-type C57BL/6 mouse (B6, right). The percentage of total cells that are Arg1+ is noted in the top right corner. (C) The percentage of CD45+ immune cells with Arg1 positivity plotted for MC38 tumors, lung, liver, heart, spleen and tumor-draining lymph node (dLN); collected from 4 mice. (D) Arg1 positivity amongst several MC38 tumor immune cell populations defined by surface staining markers, pre-gated on CD45 positivity. Values represent mean ± SEM.
Figure 2
Figure 2
Arg1+ macrophage distribution in the tumor microenvironment. Intravital microscopy images of MC38-H2B-mApple tumor cells (red) in Arg1-eYFP reporter mice. Arg1+ macrophage (green) distribution and shape at higher resolution in the center or periphery of a representative tumor implanted 8 days prior.
Figure 3
Figure 3
Arg1+ macrophage shape analysis. (A) Arg1-eYFP macrophages (green) on the periphery of an MC38-H2B-mApple tumor (red) revealed with intravital microscopy (left). Green ROIs from rounded (circularity index > 0.7) Arg1+ macrophages overlaid on tumor cells (right) (B) Arg1-eYFP cells at the same depth as (A) but in the tumor core (left). Green ROIs outlining elongated (circularity index < 0.7) Arg1+ macrophages (right). (C) Violin plots showing the circularity index probability distribution for Arg1+ macrophages at the core or periphery. Box plots represent the interquartile range. (D) The probability of each Arg1 TAM shape phenotype to be found at the tumor core or periphery. Eight fields of view compiled across 4 Arg1-eYFP reporter mice. Values represent mean ± SEM. ****P < 0.0001 (Student's t-test).
Figure 4
Figure 4
Arg1+ macrophage motility. (A) Arg1+ macrophage tracks over a 60 min time-lapse at the MC38-H2B-mApple tumor periphery overlaid (left) on representative intravital microscopy images. Isolated tracks from the same representative image (right). (B) Arg1+ macrophage tracks at the tumor core shown as overlays (left) or in isolation (right). Track plots centered at the origin revealing overall displacement of Arg1+ macrophages at the periphery (C) and core (D). Images representative of time lapse experiments taken from 8 fields of view compiled across 4 Arg1-eYFP reporter mice.
Figure 5
Figure 5
scRNA seq reveals subsets of Arg-1 macrophages. (A) Arg1 gene expression colorized across immune cell niches clustered using SPRING analysis of scRNA seq gene expression profiles. Two distinct macrophage populations contain Arg1+ macrophages, with heterogenous (Arg1A) and homogenous (Arg1B) Arg1 expression. CD45+ cells from 4 tumors were pooled for single cell analysis. (B) Heat map representing expression values for top 20 genes that discriminate Arg1A and Arg1B populations, based on P-value.
Figure 6
Figure 6
Defining macrophage sub-populations by genes and tumoral location. (A) SPRING plots of scRNA seq data showing expression of myeloid maturity markers in monocyte (Mo)-, Arg1A-, and Arg1B-containing clusters. (B) Representative microscopy images of an MC38-H2B-mApple (red) tumor section stained with DAPI for cell nuclei (blue) and with BST1 for Arg1A cells. Average peri-nuclear expression of BST1 quantified in the core and periphery of 3 tumors. (C) Representative microscopy images from a concomitant slice of the same tumor stained with DAPI for cell nuclei (blue) and with SGK1 for Arg1B cells. Average peri-nuclear expression of SGK1 quantified across 4 tumors. Values represent mean ± SEM. ****P < 0.0001 (Student's t-test).
Figure 7
Figure 7
Effects of anti-PD1 therapy on macrophages. (A) Immune cell abundance, defined by scRNA seq, in control or aPD-1-treated MC38 tumors. CD45+ cells from 4 tumors per treatment group were pooled for single cell analysis. (B) Percent change detected by scRNA seq in total, Arg1A, Arg1B, or Arg1- macrophages in response to aPD-1 treatment. (C) A volcano plot depicting differential gene expression in aPD-1-treated versus control scRNA seq samples. Genes of interest are labeled to indicate their fold change in expression after aPD-1 therapy. (D) SPRING plots of control (left) and aPD-1-treated (right) MC38 tumor scRNA seq data. Green intensity indicates normalized Arg1 gene expression, and Arg1A and Arg1B clusters are outlined with dotted black lines. A new population of Arg1- macrophages, outlined in red, was visible after aPD-1 treatment.
Figure 8
Figure 8
Arg1 inhibition in combination with aPD-1 therapy. (A) MC38 tumors in C57BL6 mice were administered vehicle control, 100 μg ABH i.p. on days 6-9 of tumor growth, 200 μg aPD-1 (clone 29F.1A12) i.p. on day 7 after tumor implantation, or both treatments. Treatment schedules indicated by green (ABH) and red (aPD-1) arrows. (B) MC38 tumor volume for each treated cohort on day 12 after tumor implantation. Data are presented as mean ± SEM; *P < 0.05, **P < 0.01. (C) Mouse survival tracked for each treatment group. (D) Mouse weights throughout the duration of therapy. Data are depicted as the mean ± SEM for > 6 mice per group.

References

    1. Engblom C, Pfirschke C, Pittet MJ. The role of myeloid cells in cancer therapies. Nat Rev Cancer. 2016;16:447–462. - PubMed
    1. Wynn TA, Chawla A, Pollard JW. Macrophage biology in development, homeostasis and disease. Nature. 2013;496:445–455. - PMC - PubMed
    1. Gabrilovich DI, Ostrand-Rosenberg S, Bronte V. Coordinated regulation of myeloid cells by tumours. Nat Rev Immunol. 2012;12:253–268. - PMC - PubMed
    1. Pittet MJ, Nahrendorf M, Swirski FK. The journey from stem cell to macrophage. Ann NY Acad Sci. 2014;1319:1–18. - PMC - PubMed
    1. De Palma M, Lewis CE. Macrophage regulation of tumor responses to anticancer therapies. Cancer Cell. 2013;23:277–286. - PubMed

Publication types