. 2019 Jan 2;5(1):eaau7292.
doi: 10.1126/sciadv.aau7292. eCollection 2019 Jan.

Quantifying the Holocaust: Hyperintense kill rates during the Nazi genocide

Affiliations

Quantifying the Holocaust: Hyperintense kill rates during the Nazi genocide

Lewi Stone. Sci Adv. .

Abstract

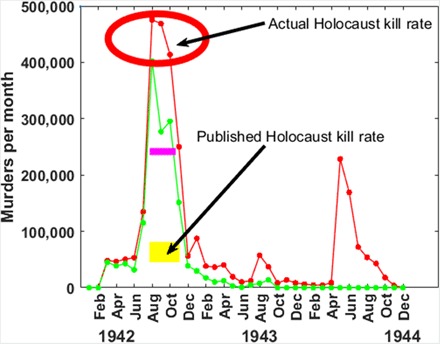
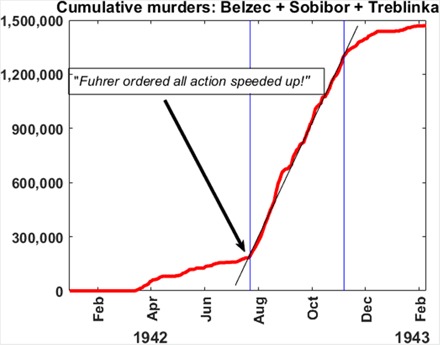
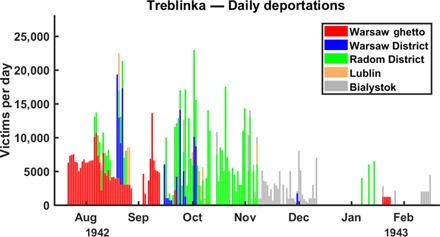
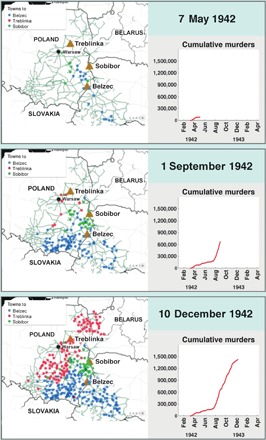
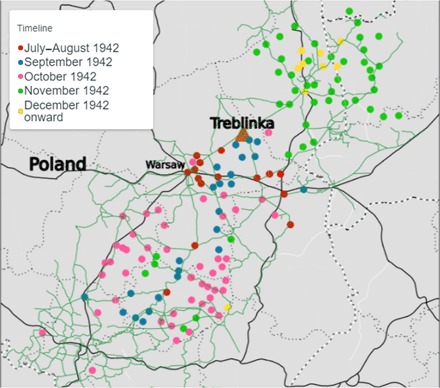
Operation Reinhard (1942-1943) was the largest single murder campaign of the Holocaust, during which some 1.7 million Jews from German-occupied Poland were murdered by the Nazis. Most perished in gas chambers at the death camps Belzec, Sobibor, and Treblinka. However, the tempo, kill rates, and spatial dynamics of these events were poorly documented. Using an unusual dataset originating from railway transportation records, this study identifies an extreme phase of hyperintense killing when >1.47 million Jews-more than 25% of the Jews killed in all 6 years of World War II-were murdered by the Nazis in an intense,100-day (~3-month) surge. Operation Reinhard is shown to be an extreme event, based on kill rate, number, and proportion (>99.9%) of the population murdered in camps, highlighting its singularly violent character, even compared to other more recent genocides. The Holocaust kill rate is some 10 times higher than estimates suggested by authorities on comparative genocide.


Figures

Fig. 1
Fig. 1. Holocaust kill rate.
Reconstruction of Holocaust monthly kill rate in units of murders per month, totalled for Belzec, Sobibor, and Treblinka death camps and plotted as a green line from January 1942 to December 1944. The superimposed red line is the total number of murders per month after inclusion of Auschwitz victims and Einsatzgruppen shooting victims (see section S1). The actual Holocaust kill rates for the months of August, September, and October 1942 are highlighted by red dots in the ellipse. The large peak in the year 1944 (red line) represents Auschwitz victims. The thick magenta line indicates the Rwanda kill rate (243,300 murdered per month). The thick yellow box indicates the range of Holocaust kill rates based on recent erroneously published estimates that assume it to be one-third to one-fifth as intense as the Rwanda genocide kill rate.
Fig. 2
Fig. 2. Cumulative murders.
Cumulative number of victims murdered at the three death camps Belzec, Sobibor, and Treblinka beginning from 1 January 1942. Almost all of these victims were murdered soon after arrival at the camps. The blue vertical lines indicate initiation (22 July 1942) and termination (4 November 1942) dates of the 105-day speed-up action in the GG death camps. The constant steep slope over this period indicates that the kill rate persisted at an almost constant rate. Note that this dataset does not include victims from outside the GG as in Fig. 1.
Fig. 3
Fig. 3. Deportations to Treblinka.
Reconstruction of number of victims transported by train per day to Treblinka as plotted from July 1942 to March 1943, all of whom were murdered with few exceptions. Data are from (2) and (3). Trains originated from different districts of the GG. Warsaw ghetto (red) = 267,100 victims transported in total (minimum). The remaining Warsaw District (blue) = 103,020, District of Radom (green) = 364,400, Bialystok District (gray) = 117,970, and District of Lublin (orange) = 33,300.
Fig. 4
Fig. 4. Spatiotemporal dynamics of death camp deportations.
Three screenshots, from film S1 in section S4, provide reconstructed maps of the train deportations in the GG on the dates 7 May 1942 (top), 1 September 1942 (middle), and 10 December 1942 (bottom). The three death camps are indicated by labeled brown triangles. The source points of the towns or Jewish communities are plotted in different colors, depending on whether they perished at Treblinka (red dots), Belzec (blue dots), or Sobibor (green dots). The solid green lines represent the railway tracks of Poland. By 10 December 1942, almost all Jewish communities in the GG had been transported to the death camps. The right-hand panels plot the increase in the cumulative number of deaths as the genocide proceeded in time (i.e., from the top map to the bottom map). Maps were constructed using CartoDB software.
Fig. 5
Fig. 5. Treblinka.
The sites of the many Jewish communities listed in the Arad (2) dataset that were deported to Treblinka by train. The communities deported in July to August 1942 are marked as red dots, and those in the months of September, October, November, and December are marked as blue, purple, green, and yellow dots, respectively. The solid green lines represent the railway tracks of Poland, which create a network that forms the background structure for the deportations. Thus, September train deportations were focused on collections along the major rail line that sits approximately on the 45° diagonal (blue dots). Map was constructed using CartoDB software.

References

    1. R. Hilberg, The Destruction of the European Jews (Yale Univ. Press, 2003).
    1. Y. Arad, Belzec, Sobibor, Treblinka—The Operation Reinhard Death Camps (Indiana Univ. Press, 1987).
    1. Y. Gutman, Jews of Warsaw 1939-1943: Ghetto, Underground, Revolt (Indiana University Press, 1989).
    1. D. Cesarani, Final Solution: The Fate of the Jews 1933-1949 (Macmillan, 2016).
    1. M. Gilbert, The Holocaust: A History of the Jews of Europe During the Second World War (Holt, Rinehart & Winston, 1985).

Publication types

LinkOut - more resources